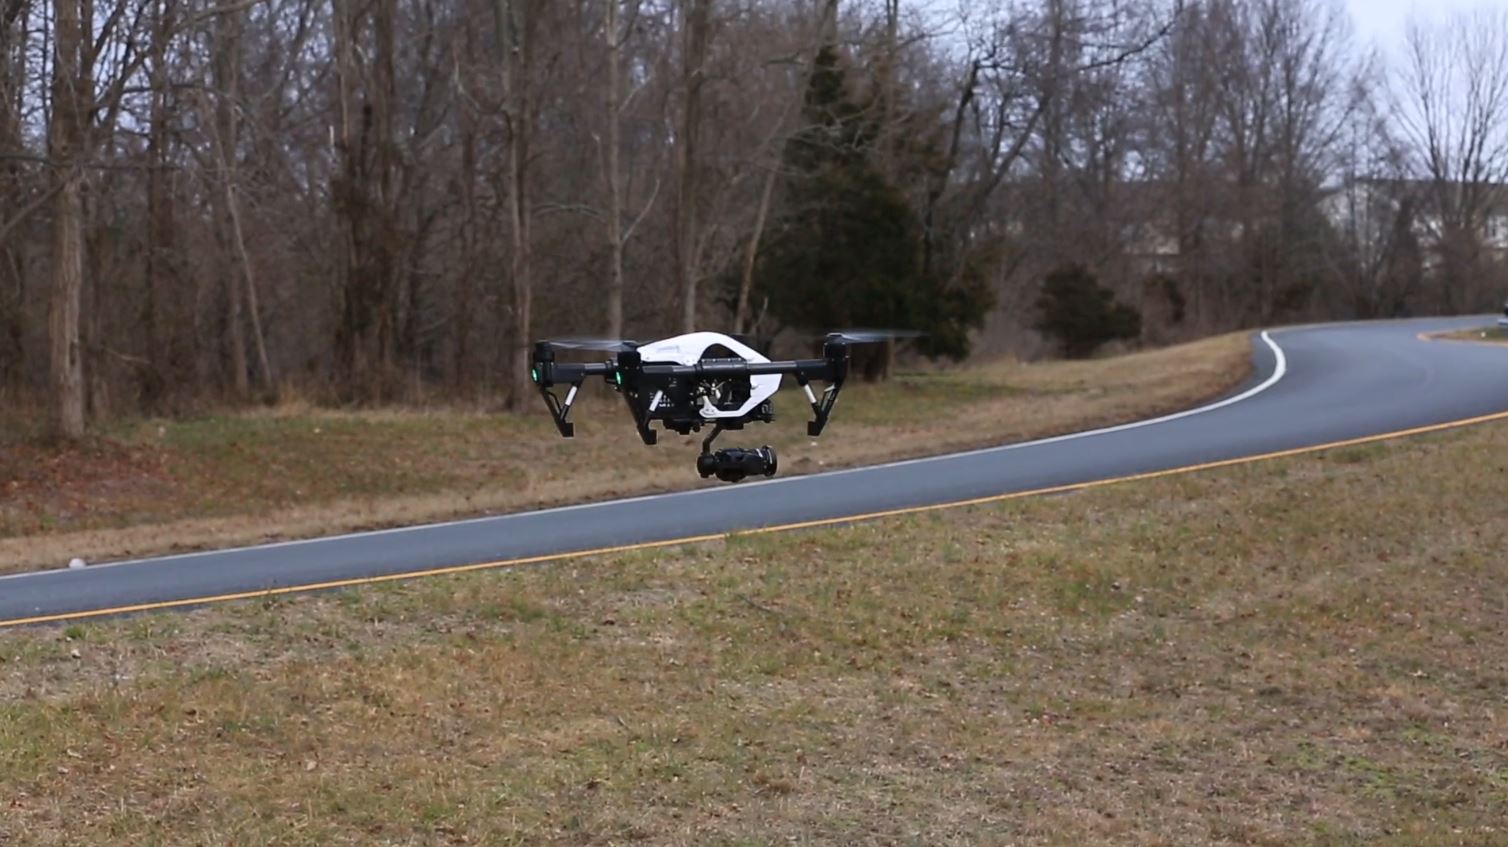
The use of drones at NJDOT has expanded to improve safety and efficiency and save time and money.
The NJDOT Knowledge Management Toolbox offers examples of several knowledge sharing practices that have been, or could be, adopted by agency units to retain knowledge in a unit in the face of illness, retirements or transfers to other units at NJDOT.
NJDOT’s Unmanned Aircraft Systems Flight Operations Manual (UASFOM) is an example of knowledge sharing through development of a procedures manual that guides practice within the agency. In 2021, Anil Agrawal, PhD., a Professor of Engineering at The City College of CUNY, completed a research study, NJDOT UAS/Drone Procedures Manual and Best Practices for Use in New Jersey, funded through the NJDOT’s Bureau of Research. The study resulted in the UASFOM that standardizes all aspects of UAS operations for NJDOT’s use, and provides guidance to NJDOT personnel, consultants, and contractors for the inspection, operation, and management of UAS. The document emphasizes maintaining a high level of safety standards in daily flight operations while meeting performance targets.
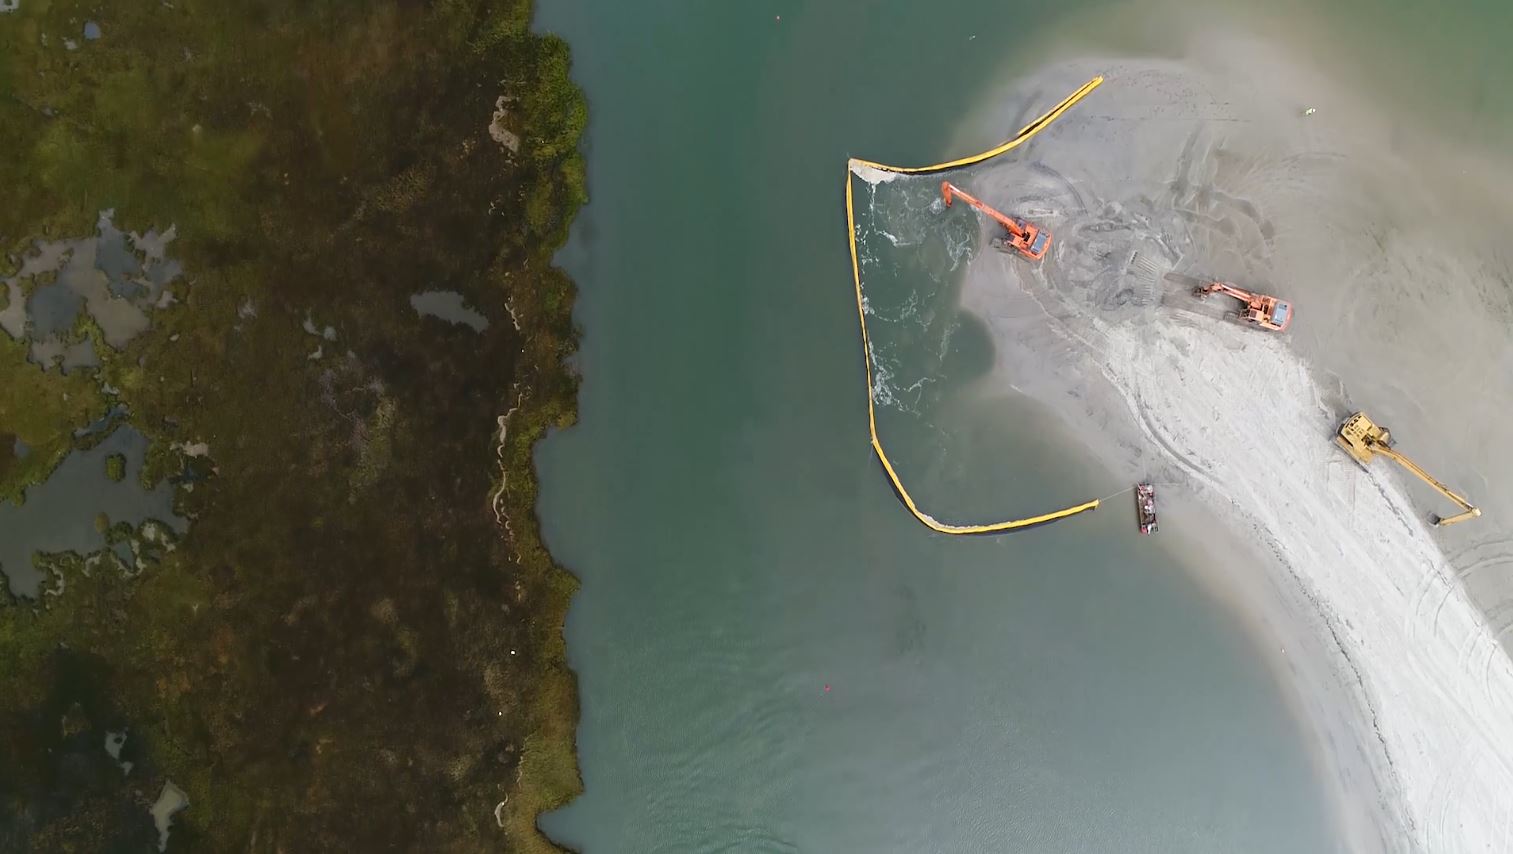
NJDOT’s Bureau of Aeronautics has used drones to video NJDOT dredging operations, among other applications.
Unmanned Aerial Systems (UAS), or drones, were promoted by the Federal Highway Administration (FHWA) as one of the Every Day Counts Round 5 (EDC-5) innovations. In May 2016, the New Jersey Department of Transportation’s Division of Multimodal Services established the Unmanned Aircraft Systems (UAS) Program as a unit within the Bureau of Aeronautics. Under the direction of NJDOT’s UAS Coordinator, Glenn Stott, NJDOT became a national leader in UAS. Mr. Stott retired from the agency in 2021.
NJDOT Bureau of Aeronautics used several funding grants to build the program and purchase equipment and provide training. Integrating UAS in transportation has been the subject of research and field studies to demonstrate the use case for high-mast light pole inspections, traffic incident management and monitoring, dredging and beach replenishment, photogrammetry, bridge inspection, and watershed management, among other topics. UAS has been shown to improve safety, save time and money and increase efficiency. UAS is considered to be institutionalized within NJDOT.
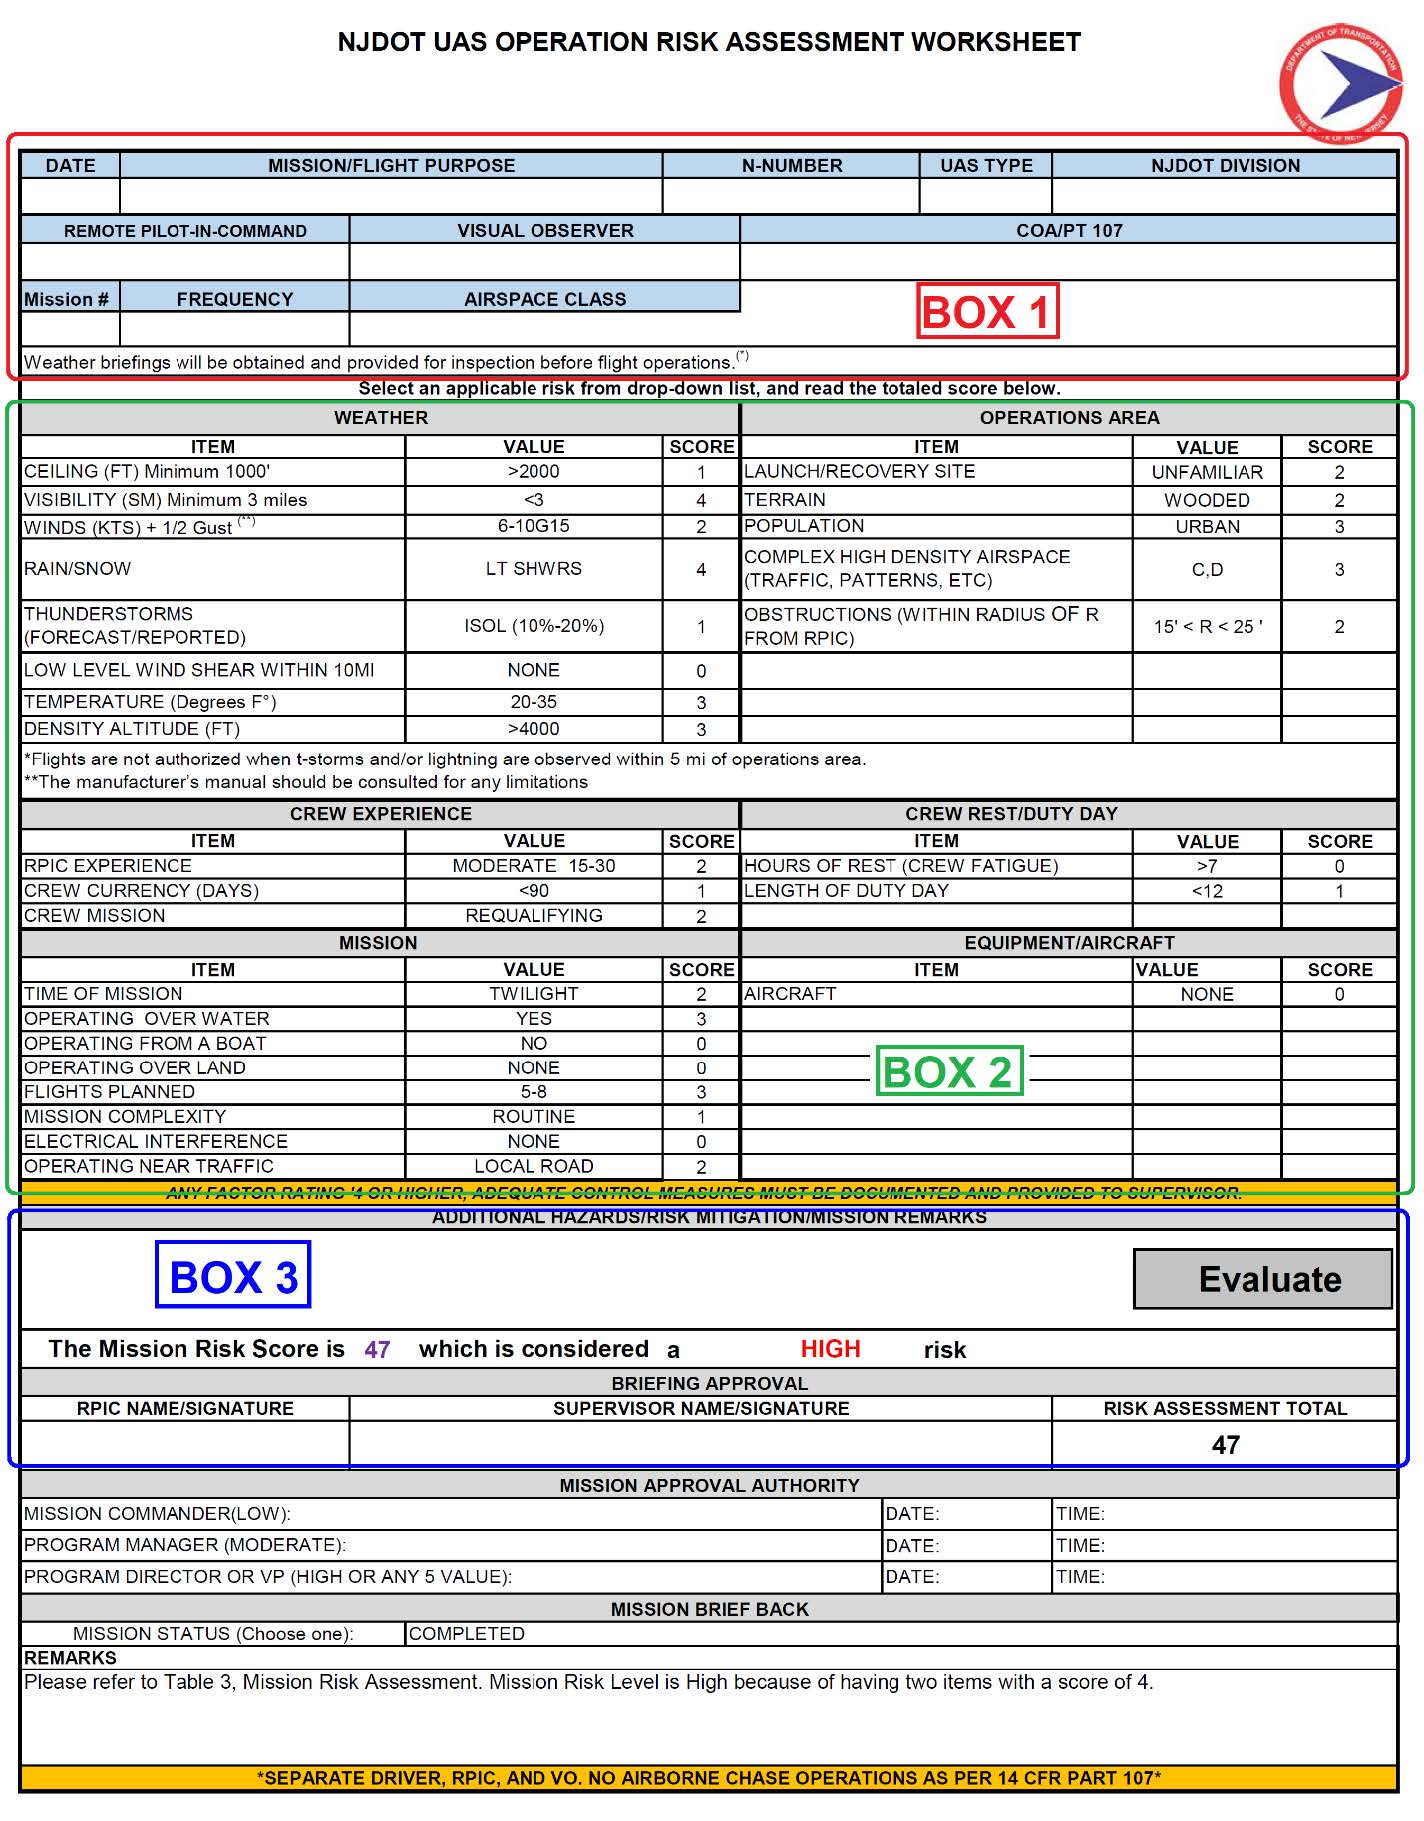
An example Risk Management Worksheet is one of several forms described in the Procedures Manual.
The procedures manual provides comprehensive guidance for UAS missions from planning to debriefing. The manual presents NJ’s laws and regulations affecting UAS operations, discusses NJDOT’s safety management system and risk management approach, established best practices, the agency’s three-phase training program, and incident reporting. The manual also provides NJDOT’s UAS forms needed for documentation and to ensure compliance with Federal Aviation Administration (FAA) regulations. The manual is intended to be a “living document” to incorporate changes as experience grows with UAS within the agency.
A procedures manual is one way to counter the loss of expertise and institutional knowledge when employees retire or transfer. A manual can build and sustain knowledge within the agency to ensure continuity of operations.
The UASFOM can be found in the Knowledge Management Toolbox. The Final Report and Technical Brief for the Research can be accessed here.
The 23rd Annual NJDOT Research Showcase was an opportunity for the New Jersey transportation community to learn about the broad scope of academic research initiatives underway and share technology transfer activities being conducted by institutions of higher education partners and their associates. The annual event serves as a showcase to present the ongoing initiatives and benefits of the NJDOT Research program. This event was the second Research Showcase conducted by webinar with sessions held from 9:00am-2:45pm on October 27, 2021.
The Research Showcase Program included presentations by university researchers, NJ agency representatives, and engineers offering their perspectives and fielding questions on topics including electrification of vehicles, smart transportation and energy use. These presentations were followed by poster sessions presenting research of students attending New Jersey’s universities and colleges.
MORNING
Andrew Swords, Director, Division of Statewide Planning, New Jersey Department of Transportation welcomed attendees to the event.
The NJDOT Commissioner of Transportation, Diane Gutierrez-Scaccetti, provided opening remarks focusing on the need to work collectively to address climate change. Ms. Gutierrez-Scaccetti noted that partnerships among public, private, and academic organizations are essential to reach the state goal of an 80 percent reduction in greenhouse gas emissions by 2050. She touched on several recent NJDOT initiatives and adoption of technological innovations that support this goal and the agency’s mission to provide a safe, cost-effective transportation network for the traveling public. In his opening remarks, Robert Clark, Federal Highway Administration's New Jersey Division Administrator, emphasized the need for research and innovation and noted federal funding awarded to, and agency support for, recent NJDOT initiatives.
Jane Cohen, Executive Director, New Jersey Governor’s Office of Climate Action and the Green Economy gave the keynote address on "Confronting Climate Change through Transportation Initiatives." Ms. Cohen discussed the need to reduce greenhouse gas emissions and explained how temperature increases from climate change can intensify air pollution as well as respiratory and cardiovascular health concerns that are disproportionately borne by overburdened communities. Ms. Cohen emphasized that environmental justice and equity are at the center of the work being done to chart a path forward to a clean energy future. She highlighted recent landmark NJ state legislation (S-232 - Cumulative Impacts Law) and NJDEP's enforcement responsibilities to protect overburdened communities in permit review processes.
Noting that transportation makes up a larger percentage of greenhouse gas emissions, she stressed the need for coordination among state agencies to shift light duty, medium and heavy duty trucks, transit vehicles, and the state fleet to electric vehicles. NJ’s Partnership to Plug-In is a statewide initiative involving state agencies and private sector partners to build out the infrastructure needed to support electric vehicle ownership. Ms. Cohen mentioned various funding sources for projects, including the regional cap and trade system as part of the Regional Greenhouse Gas Initiative, from the Volkswagen Mitigation Trust Fund, the NJ Zero Emission Incentive Program for the purchase of EVs, and an e-mobility program in Trenton through ISLES. She highlighted several other essential transportation initiatives that are aligned with climate planning. including the adoption of Complete Streets policies, Transit Villages, and efforts to reduce Vehicle Miles Traveled (VMT). She promoted the value of integrating green infrastructure such as wetlands and rain gardens in transportation for greater resilience to stormwater and flooding.
In her closing remarks, she made an appeal to those in attendance to recognize the urgency of the moment and reflect on how they might contribute innovative solutions and how they might partner to work collectively toward addressing the challenges of climate change. She recognized the Build the Better Mousetrap Competition as an example of adopting an orientation favorable to innovation. She stressed that her office welcomes new ideas such as pilot projects and programs and partnerships.
A panel of presenters from representing state agencies, academia, and industry followed:
Peg Hanna, Assistant Director, Air Monitoring and Mobile Sources, New Jersey Department of Environmental Protection, spoke about the need to use various approaches to reach goals, such as the Electric Shared Mobility Program grants and the DEP-funded ISLES program in Trenton, and the value of working with local residents to understand transportation needs and gaps, working with the private sector, and considering the sustainability of any program.
Andrew Tunnard, Assistant Commissioner, Transportation Operations Systems and Support, New Jersey Department of Transportation, introduced a study, New Jersey Fleet Electrification: Statewide Charging Facilities Design Recommendations, undertaken to determine locations for the state build-out of EV infrastructure and to create a framework for state agencies to move toward their goals of fleet transition.
Alain Kornhauser, PhD, Professor of Operations Research & Financial Engineering, Princeton University, discussed details of the study, including the cost/benefit analysis comparing EV charging infrastructure favorably to internal combustion fueling locations, and the equitable distribution of the burden for creating EV infrastructure among state agencies.
Spencer Reeder, Director of Government Affairs and Sustainability, Audi of America, spoke about the emerging market for electric vehicles and the expansion of options for buyers.
Julia Rege, Vice President for Energy and Environment, Alliance for Automotive Innovation, spoke about the need for purchase incentives for electric vehicles, for more infrastructure including more charging capacity, and to switch manufacturing and supply that is still geared to the internal combustion fleet.
Presenters responded to attendee questions. The audience was informed that research ideas can be submitted to the Transportation Research Ideas Portal through the NJDOT Technology Transfer website.
Plenary Session Recording
Keynote Address: Confronting Climate Change Through Transportation Initiative
Panel Presentation: Innovation in Transportation Electrification: Getting to 2050
Panel Presentation: New Jersey Fleet Electrification
The program continued as Amanda Gendek, Manager, NJDOT Bureau of Research, announced several awards given in recognition of research, innovation and implementation efforts. Below is a listing of the award winners presented at this year's showcase:
2021 Outstanding University Student in Transportation Research Award – Wei Huang, Rutgers University (Implementation of Porous Concrete for Sidewalks in New Jersey)
2021 Best Poster Award – Xiao Chen, Rutgers University (Hot in-Place Recycling of Asphalt Pavement: Current Practice and New Technology)
2021 NJDOT Research Implementation Award – Husam Najm, Hao Wang, Rutgers University (Implementation of Pervious (Porous) Concrete for Sidewalks)
2021 NJDOT Build a Better Mousetrap Award (State Agency) – Marc Franco, NJ TRANSIT, Tire Centerline Bracket
2021 NJDOT Build a Better Mousetrap Award (Local Agency) – Art Villano, Montgomery Township, Inlet Repair Trailer
The Build a Better a Mousetrap Award for an entry from a state agency was given to Marc Franco from NJ TRANSIT. His Tire Centerline bracket provides a simple means for finding the centerline of the tire when installing the air-operated snow chain systems on the fleet of buses. The process, critical to the proper operation of these systems, increases safety and efficiency, and reduces costs.
The Build a Better a Mousetrap Award for an entry from a local agency was given to Art Villano from Montgomery Township who found a more efficient means to transport all needed equipment and materials to work sites to conduct inlet repairs. The use of a low deck trailer and the availability of an electric crane increased safety for workers.
AFTERNOON
In the afternoon, concurrent break-out sessions for research presentations focused on the topics of Energy/Electrification, Infrastructure, and Smart Transportation, and for the presentation of posters from students and researchers at New Jersey’s colleges and universities describing their methods and findings on ongoing and recently completed research and responding to questions by attendees.
Energy/Electrification Session Recording
Smart Transportation Session Recording
Infrastructure Session Recording
Poster Session Recording
Energy/Electrification Presentations
Laura Soares, Rutgers University, Energy Harvesting Evaluation of Photovoltaic Noise Barriers on Highways LINK
Chris Lamm, Cambridge Systematics, Al Beatty, CALSTART, and Leslie Fordjour, New York Multi-State Regional Clean Freight Corridors Study LINK
Infrastructure Presentations
Xiao Tan, Stevens Institute of Technology, Achieving Resilient and Smart Concrete Bridges by Mapping Strains and Cracks Using Distributed Fiber Optic Sensors LINK
Sougata Roy, Rutgers University, Innovative Metal Deck for Efficient Infrastructure LINK
Kaan Ozbay and Jingqin Gao, New York University, Bridge Management System with Life Cycle Cost Optimization as a Decision Support Tool: A Case Study in New Jersey LINK
Smart Transportation Presentations
Mohammad Jalayer, Rowan University, A Novel Approach to Identify Distracted Drivers in New Jersey LINK
Anjiang Chen, Rutgers University, Integrated Pandemic Travel Demand and Epidemiology Modeling for COVID-19 Case Prediction and Impact on Regional Travel Behavior in 2020 LINK
Abdullah Shabarek, New Jersey Institute of Technology, Predicting Traffic Speed for New Jersey Freeway Work Zones - A Deep Learning Approach LINK
Poster Presentations
Hot In-Place Recycling of Asphalt Pavement: Current Practice and New Technology - Xiao Chen, Rutgers University
An Innovative Green Pervious Concrete Made with Modified Geopolymer Materials - Wei Huang, Rutgers University
Modelling and Mitigating of Thermal-Induced Reflective Cracking in Asphalt Concrete Overlay - Pengyu Xie, Rutgers University
Understanding the Interconnectivity between Intersection Traffic Congestion, and Outdoor Air Quality for Smart Cities - Kourtney Arena, Rowan University
Estimating Roadway Horizontal Alignment Information Using Machine Learning - Bekir Bartin, New York University
Influence of Cracking and Brine Concentration on Corrosion and Chloride Content - Aaron Strand, New Jersey Institute of Technology
Supporting Bridge Deck Condition Assessment Through the Use of TLS - Issa Al-Shaini, Rowan University
New Brunswick Innovation Hub Smart Mobility Testing Ground, Data City: A Smart and Autonomous Initiative - Peter J. Jin, Rutgers University
The 23rd Annual NJDOT Research Showcase was organized and sponsored by the NJDOT Bureau of Research in partnership with the New Jersey Local Technical Assistance Program (NJLTAP) at Rutgers Center for Advanced Infrastructure and Transportation (CAIT) and co-sponsored by the Federal Highway Administration.
Figure 1. The Hanging Lake Tunnels on I-70 in Colorado were targeted in the state DOT’s resiliency planning. ThreadedThoughts | Flickr
The previous article in this two-part series addressed the ways that state DOTs have been innovating to reduce Greenhouse gas (GHG) emissions, as a means of slowing climate change. However, an already changing climate is bringing more severe and unprecedented weather, challenging the durability of the nation’s infrastructure.
Resiliency is defined by the State of New Jersey as “as the ability of social and ecological systems to absorb and adapt to shocks and stresses resulting from a changing climate, while becoming better positioned to respond in the future.” Many state DOTS are rising to this challenge, innovating through adoption of planning, technological, and engineering methods to protect roads, bridges and the people that use them.
In Colorado, an example of climate change-exacerbated weather affecting a vital interstate link illustrates both the growing threat and the potential for action. Between the municipalities of Dotsero and Glenwood Springs, Interstate 70 travels through the Rocky Mountains (Fig. 1), following a narrow canyon bed alongside the Colorado River. In early fall 2020, the Grizzly Creek Fire burned through 32,631 acres, including the elevated terrain above I-70. Then, in summer 2021, an atypically high rainfall event created a large mudslide that poured onto the highway, bringing traffic to a halt and trapping some motorists in the nearby Hanging Lake Tunnels. But, had thorough resiliency planning not been conducted after a devastating 2013 rockslide in the same vicinity, further destruction would have been assured. Instead, a berm built in 2020 diverted 100,000 cubic yards of debris away from the tunnels (and a Colorado Department of Transportation (CDOT) Command Center), saving lives and hundreds of millions of dollars in the process. According to CDOT’s director of maintenance and operations, the berm improvement cost less than $50,000.
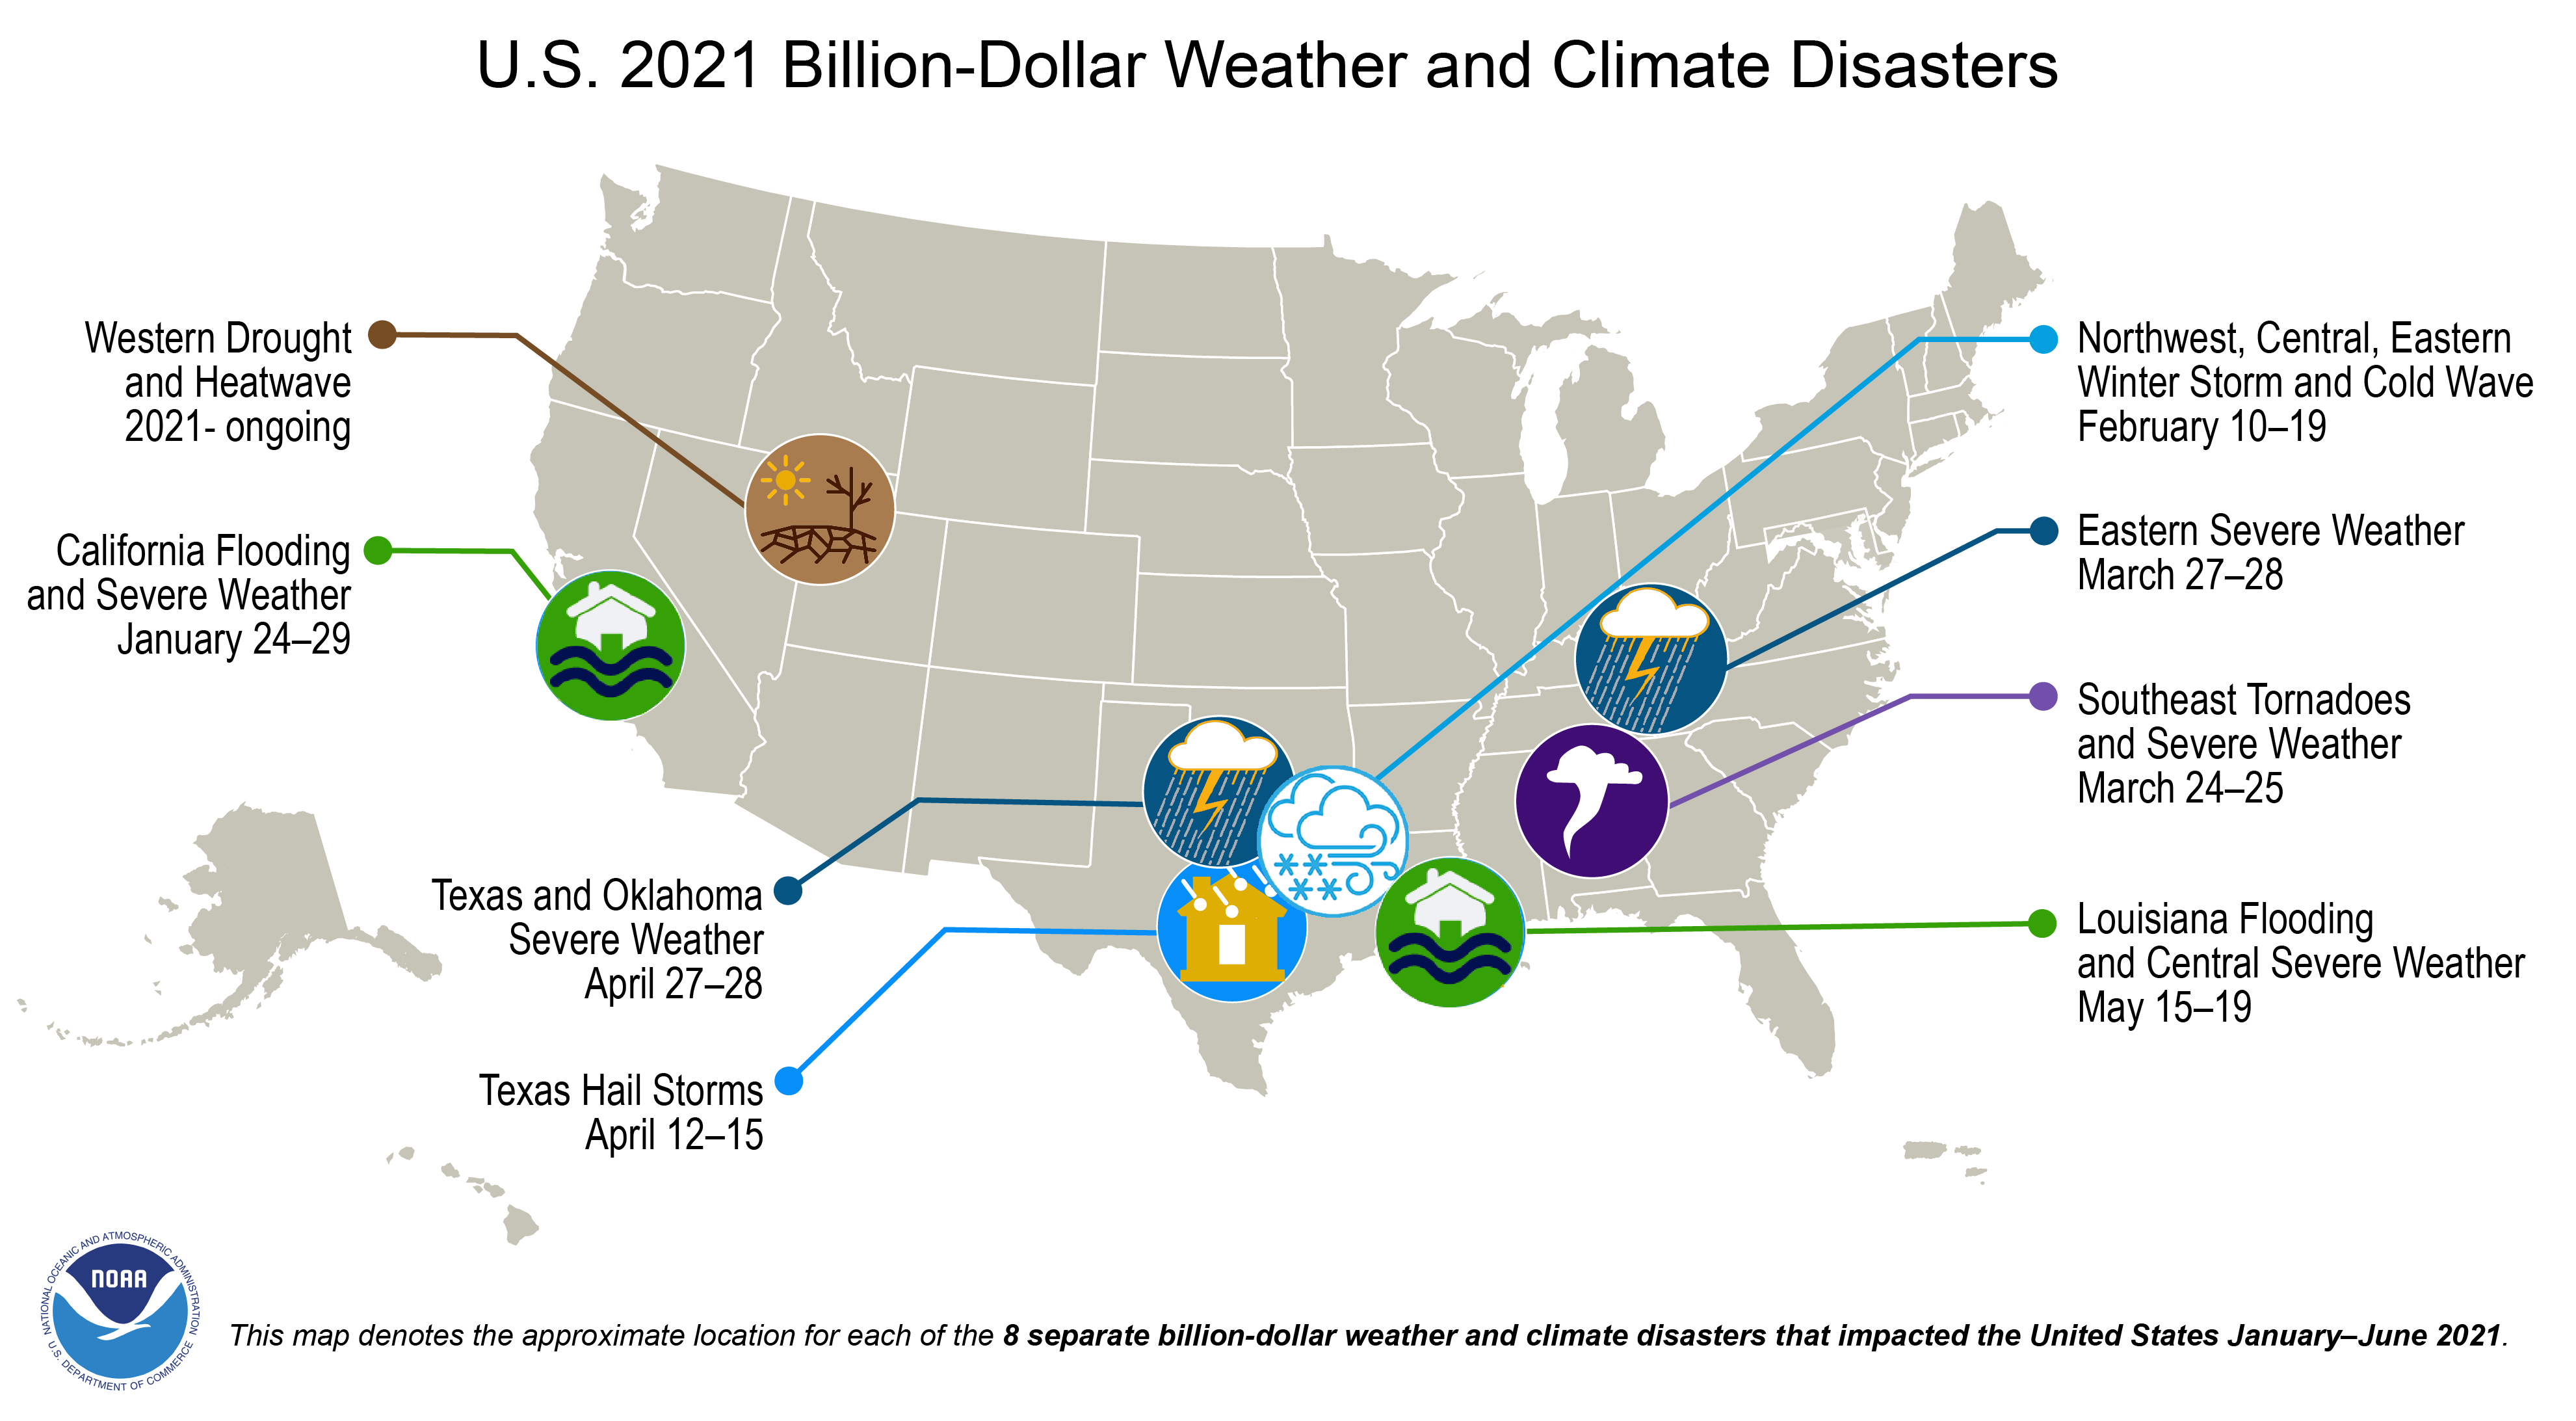
Figure 2. A map of large-scale weather and climate disasters in the first half of 2021. Such occurrences have been increasing in frequency since the 1980s. Courtesy of NOAA
This dramatic case study demonstrates the value of risk and resilience planning for a state roadway network. But Colorado, of course, is not on its own. According to the National Oceanic and Atmospheric Administration (NOAA), billion-dollar climate-borne disasters have been steadily increasing since the agency began tracking them in 1980 (Fig. 2). In particular, our transportation infrastructure, vital for so many economic and societal functions, is challenged by increasingly frequent and severe weather events. While different geographies present different threats, there is a common need for threat assessment and decision-making frameworks to strategically build infrastructure resilience. There is much opportunity to innovate with new technologies, engineering methods, and planning frameworks for the purpose of strengthening our transportation network.
Table 1. A Brief Scan of Resiliency Planning Initiatives
State
Theme
Action
California
Assessment - Comprehensive
Five-tier adaptation report for each district
California
Assessment - Sea Level Rise
Pilot sea-level rise assessment in San Francisco Bay Area
Colorado
Assessment - Comprehensive
Risk and Resilience Analysis Procedure
FHWA
Assessment - Comprehensive
Vulnerability Assessment and Adaptation Framework, 3rd Edition
Florida
Assessment - Sea Level Rise
Sea Level Scenario Sketch Planning Tool
Hawaii
Assessment - Comprehensive
Action plan that identifies risky areas and strategies for incorporating resilience
Illinois
Assessment - Comprehensive
Risk analysis, now developing processes to implement resilience
Iowa
Assessment - Flooding
Resiliency and vulnerability assessment for I-380
New Jersey
Assessment - Flooding
Flood Risk Mapping Project
Texas
Assessment - Comprehensive
Climate Change/Extreme Weather Vulnerability and Risk Assessment for
Transportation Infrastructure in Dallas and Tarrant Counties
Vermont
Assessment - Flooding
Tool for identifying risk levels for roads, bridges and culverts
Washington
Assessment - Comprehensive
Statewide climate analysis of vulnerable agency-owned infrastructure
Washington
Assessment - Flooding
Skagit County targeted assessment of flood risk
FHWA & NCHRP Research Frameworks
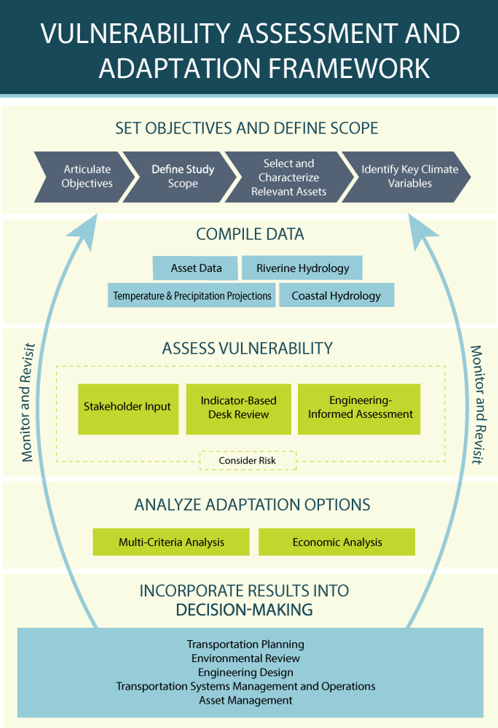
In 2012, the Moving Ahead for Progress in the 21st Century Act (MAP-21) called for each state to create “a risk-based asset management plan for the National Highway System to improve or preserve the condition of the assets and the performance of the system” (MAP-21, 2012). The FHWA resource, Vulnerability Assessment and Adaptation Framework, 3rd Edition (2017), seeks to combine the legislatively-mandated work of risk assessment with the rising threat of climate change upon the system.
The Framework shares examples of approaches for each step in the vulnerability assessment and adaptation framework (see Fig. 3). For example, for the first step, “Articulate objectives and define study scope,” the report gives instances of the North Central Texas Council of Governments’ vulnerability assessment work, the San Francisco Bay Area’s Metropolitan Transportation Commission’s (MTC) ongoing efforts to model and react to sea level rise and storm surge, as well as the Iowa Department of Transportation’s and Massachusetts Department of Transportation’s respective inquiries into how increased flooding would affect critical infrastructure. For state DOTs looking for a rich bibliography of vulnerability assessment resources and case studies, the FHWA Framework’s Appendix A includes resources for selecting climate variables, projecting temperature and precipitation, obtaining sea level rise information, and determining how to incorporate results of assessments into the transportation planning process, among others.
Figure 3. FHWA’s Vulnerability Assessment and Adaptation Framework is a primer for DOTs looking to integrate a changing climate with their risk assessments. Courtesy of FHWA
The National Highway Cooperative Research Program (NCHRP), an initiative supported by the American Association of State Highway and Transportation Officials (AASHTO), working in cooperation with FHWA, has been researching resilience planning for state DOTs, with several ongoing projects. A brief scan of recent work finds a variety of other resiliency initiatives undertaken by state DOTs in roadway engineering, planning, and operations, with several reports reiterating that there remains work to be done.
The program’s 2019 Applying Climate Change Information to Hydrologic and Coastal Design of Transportation Infrastructure addresses how to plan and engineer hydrologic and coastal infrastructure for a changing climate. Typically, engineers use historical assumptions to predict future conditions, but, in a changing climate, this approach is problematic. The guide provides two different decision-making frameworks, Top-Down and Threshold (Bottom-Up), as well as probabilistic risk assessments to best understand the appropriate course of action, such as whether to significantly invest in making a facility more resilient.
A report published by NCHRP the previous year, Resilience in Transportation, Planning, Engineering, Management, Policy, and Administration (2018), works to synthesize the state of the practice. The survey of 40 state DOTs revealed a pressing need for resilience metrics and assessment methods. According to the study, “Currently there is no standard measurement for resilience within highway analysis.” However, in the intervening years, many state DOTs have begun the work of developing risk assessments and resiliency plans.
NCHRP’s Incorporating the Costs and Benefits of Adaptation Measures in Preparation for Extreme Weather Events and Climate Change Guidebook (2020) describes technical steps to assist agencies in conducting CBAs (Cost-Benefit Analyses) for climate resilience. With sample scenarios and problems, the resource explains the necessity for CBAs as a resilience decision-making tool, and the various considerations that must be taken into account. Later, this article will touch upon how CDOT used CBAs for its risk assessments and resiliency planning.
Finally, NCHRP’s Transportation System Resilience: Research Roadmap and White Papers (2021) identifies several pressing research needs for the current five-year period. After synthesizing reports, and conducting workshops and outreach, consultants created a ranked list of projects; notably, the first two of these projects were Integrating Resilience into Transportation Project Development and Economic Benefits from Making Investments in Resilient Transportation Assets. The report calls for continued, balanced research into many topics to build the most system resilience, cautioning that: “Disruptive forces have no end point but continue and may, in fact, worsen over time. Recovery is not an option – the best that can be hoped for is continuous adaptation.”
Analyzing and Prioritizing Vulnerable Assets
Figure 4. The Golden Gate Bridge was one of the Priority 1 assets targeted in Caltrans’ resiliency assessment. FrankBrueck | Wikimedia Commons
A handful of geographically diverse state DOTs provide insightful examples of the present state of resiliency planning. Due to federal requirements, DOTs have conducted in-depth inventories of state roadway networks, categorizing them by vulnerability and level of risk. The handful of examples that follow show how different jurisdictions and geographies have approached this work to understand how environmental shifts are anticipated to affect infrastructure, and to prioritize facilities by their significance to the overall transportation network.
In California, Caltrans has compiled adaptation priority reports for each district. For District 4, which encompasses the Bay Area region, Caltrans and consultants assigned an Average Cross-Hazard Prioritization Score to each exposed bridge, culvert, and roadway asset. A score for each asset was calculated using context-sensitive criteria—for instance, temperature affects the integrity of asphalt binders more significantly than it would a culvert. On the Priority 1 Tier are major, threatened pieces of infrastructure, such as the Golden Gate Bridge, a large culvert over the Transmission Canal, and many segments of coastal roadway around the San Francisco Bay. According to the document, the next steps will be to prepare more detailed adaptation assessments for these assets, as well as to integrate these prioritization measures into the district’s asset management system.
Figure 5. A segment of VT-107 damaged by Tropical Storm Irene, which motivated the development of the Transportation Resilience Planning Tool (TRPT). Courtesy of the Vermont Agency of Transportation
This work has been conducted in East Coast states as well. The Vermont Agency of Transportation (Vtrans) developed an in-house tool for identifying risk levels for roads, bridges, and culverts. The Transportation Resilience Planning Tool (TRPT) takes into account measures of Vulnerability, Criticality, Risk, and Mitigation for its four areas of analysis. Additionally, Vtrans has made the Tool available as a web-based application for ease of use. For example, an examination of the roadway network near East Dorset, Vermont, shows a stretch of the Ethan Allen Highway with a 9/10 Vulnerability score, and 7/10 Criticality score. Because this segment’s right-of-way overlaps with that of an adjacent river, it is particularly vulnerable to erosion. The Tool also contains suggested countermeasures, which in this case include strategies such as planting more vegetation, armoring the riverbank and road, and more costly measures, like adjusting the road’s alignment. Cost estimates for these actions are also given.
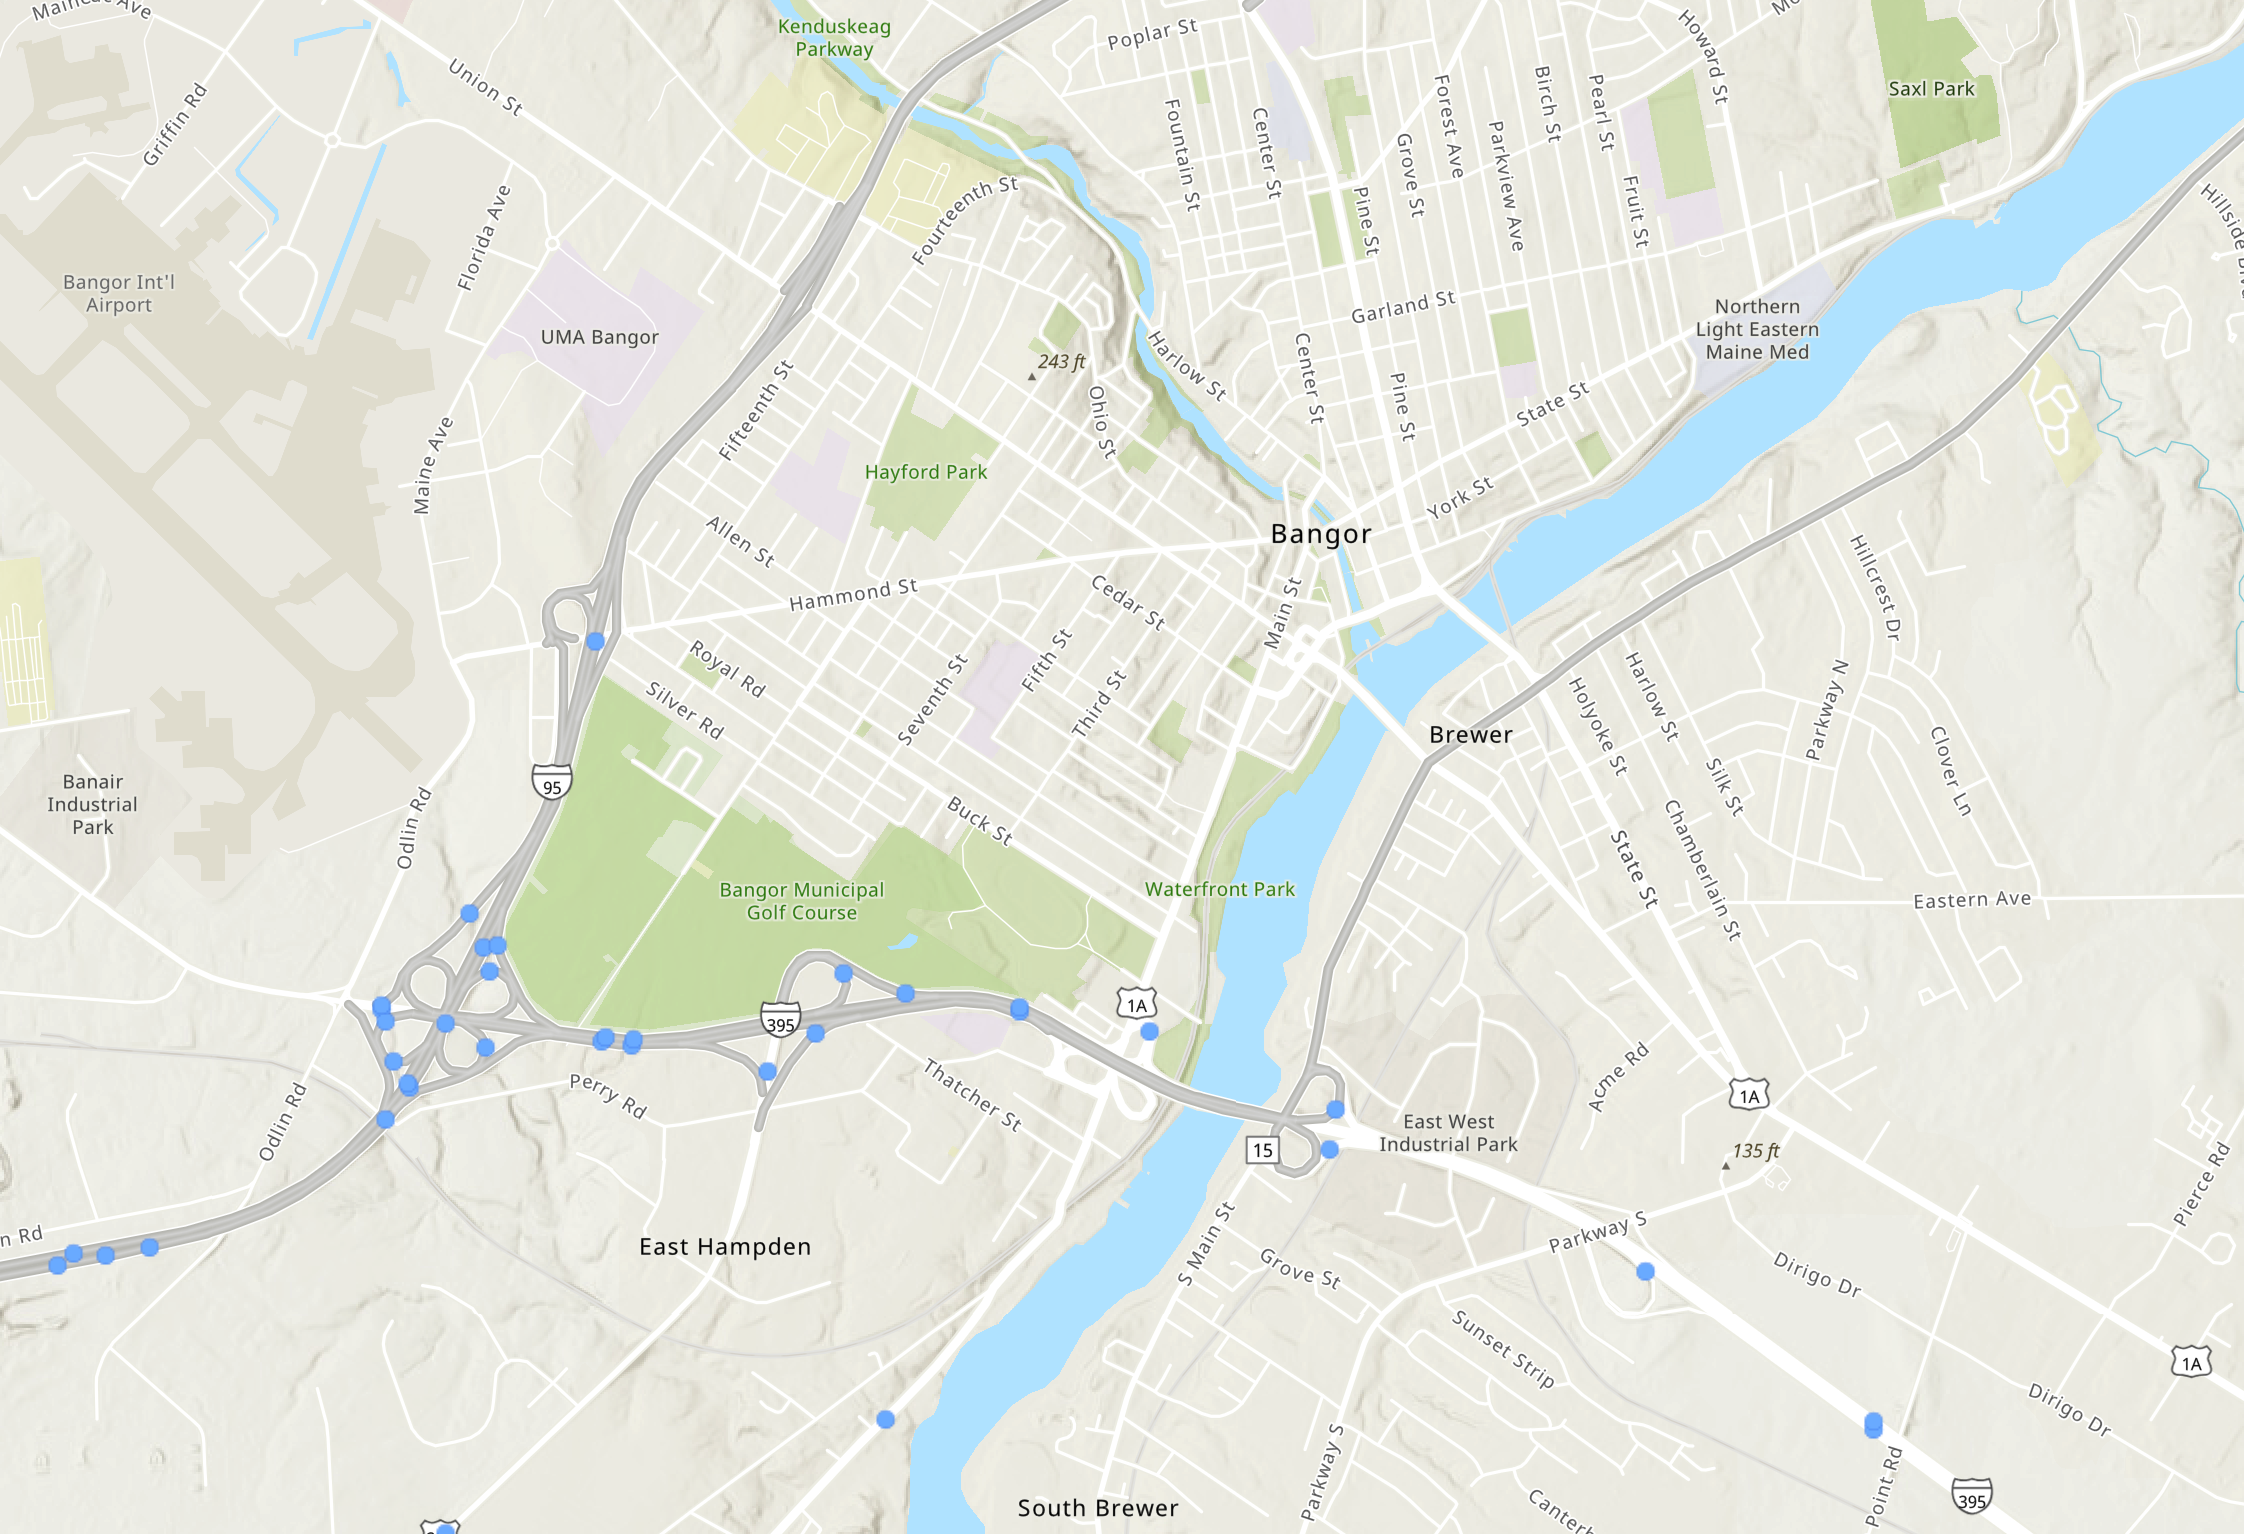
Nearby, in Maine, the state department of transportation (MaineDOT) recently completed and published a survey of undersized culverts in the state. The purpose of this work was to identify locations where flooding on the state roadway network might most likely occur, and, in a granular fashion, identify necessary improvements. On the interactive ArcGIS application, one randomly selected culvert on Interstate 395 in Bangor (Fig. 6), was listed as needing an additional one to ten feet expansion, while another, on a nearby clover leaf, needed none. State agencies in Illinois and Delaware have been compiling similar inventories to those in California and Vermont.
Figure 6. MaineDOT’s Cross Culvert’s GIS layer shows culverts slated for upgrades. Courtesy of MaineDOT
The purpose of such work, in the context of a changing climate, is to understand, on a granular level, the weaknesses and strengths of the state’s system, and then to develop a systematic plan of action. Hawaii, after doing so, found that 58 percent of the state’s highway network was vulnerable to climate-borne stresses. Hawaii’s plan then called for including these considerations in the department’s technical and process guidance, so that, infrastructure could be adapted to face assessed threats in the future.
Mapping Coastal Resilience
In New Jersey, work to expand the NJDOT Flood Risk Visualization Tool is underway. At the 2020 NJDOT Research Showcase, Jon Carnegie, Executive Director of the Alan M. Voorhees Transportation Center at Rutgers University, presented on work from a research team tasked with assisting NJDOT in assessing growing flood risk for the road network by developing the GIS-based Flood Risk Visualization Tool. The first phase of the tool was released in December, 2020, allowing NJDOT to use coastal data from NJFloodMapper and inland flooding data from FEMA to flag areas that may be adversely affected by climate change. The second phase will involve modeling flooding scenarios from specific storm events, thereby enabling NJDOT engineers and planners to effectively assess vulnerability and integrate it into the decision-making process. When finished, this internal tool will allow staff to “zoom-to” particular segments or mile-posts of the state highway network, and view the climate-borne challenges that a particular asset might face.
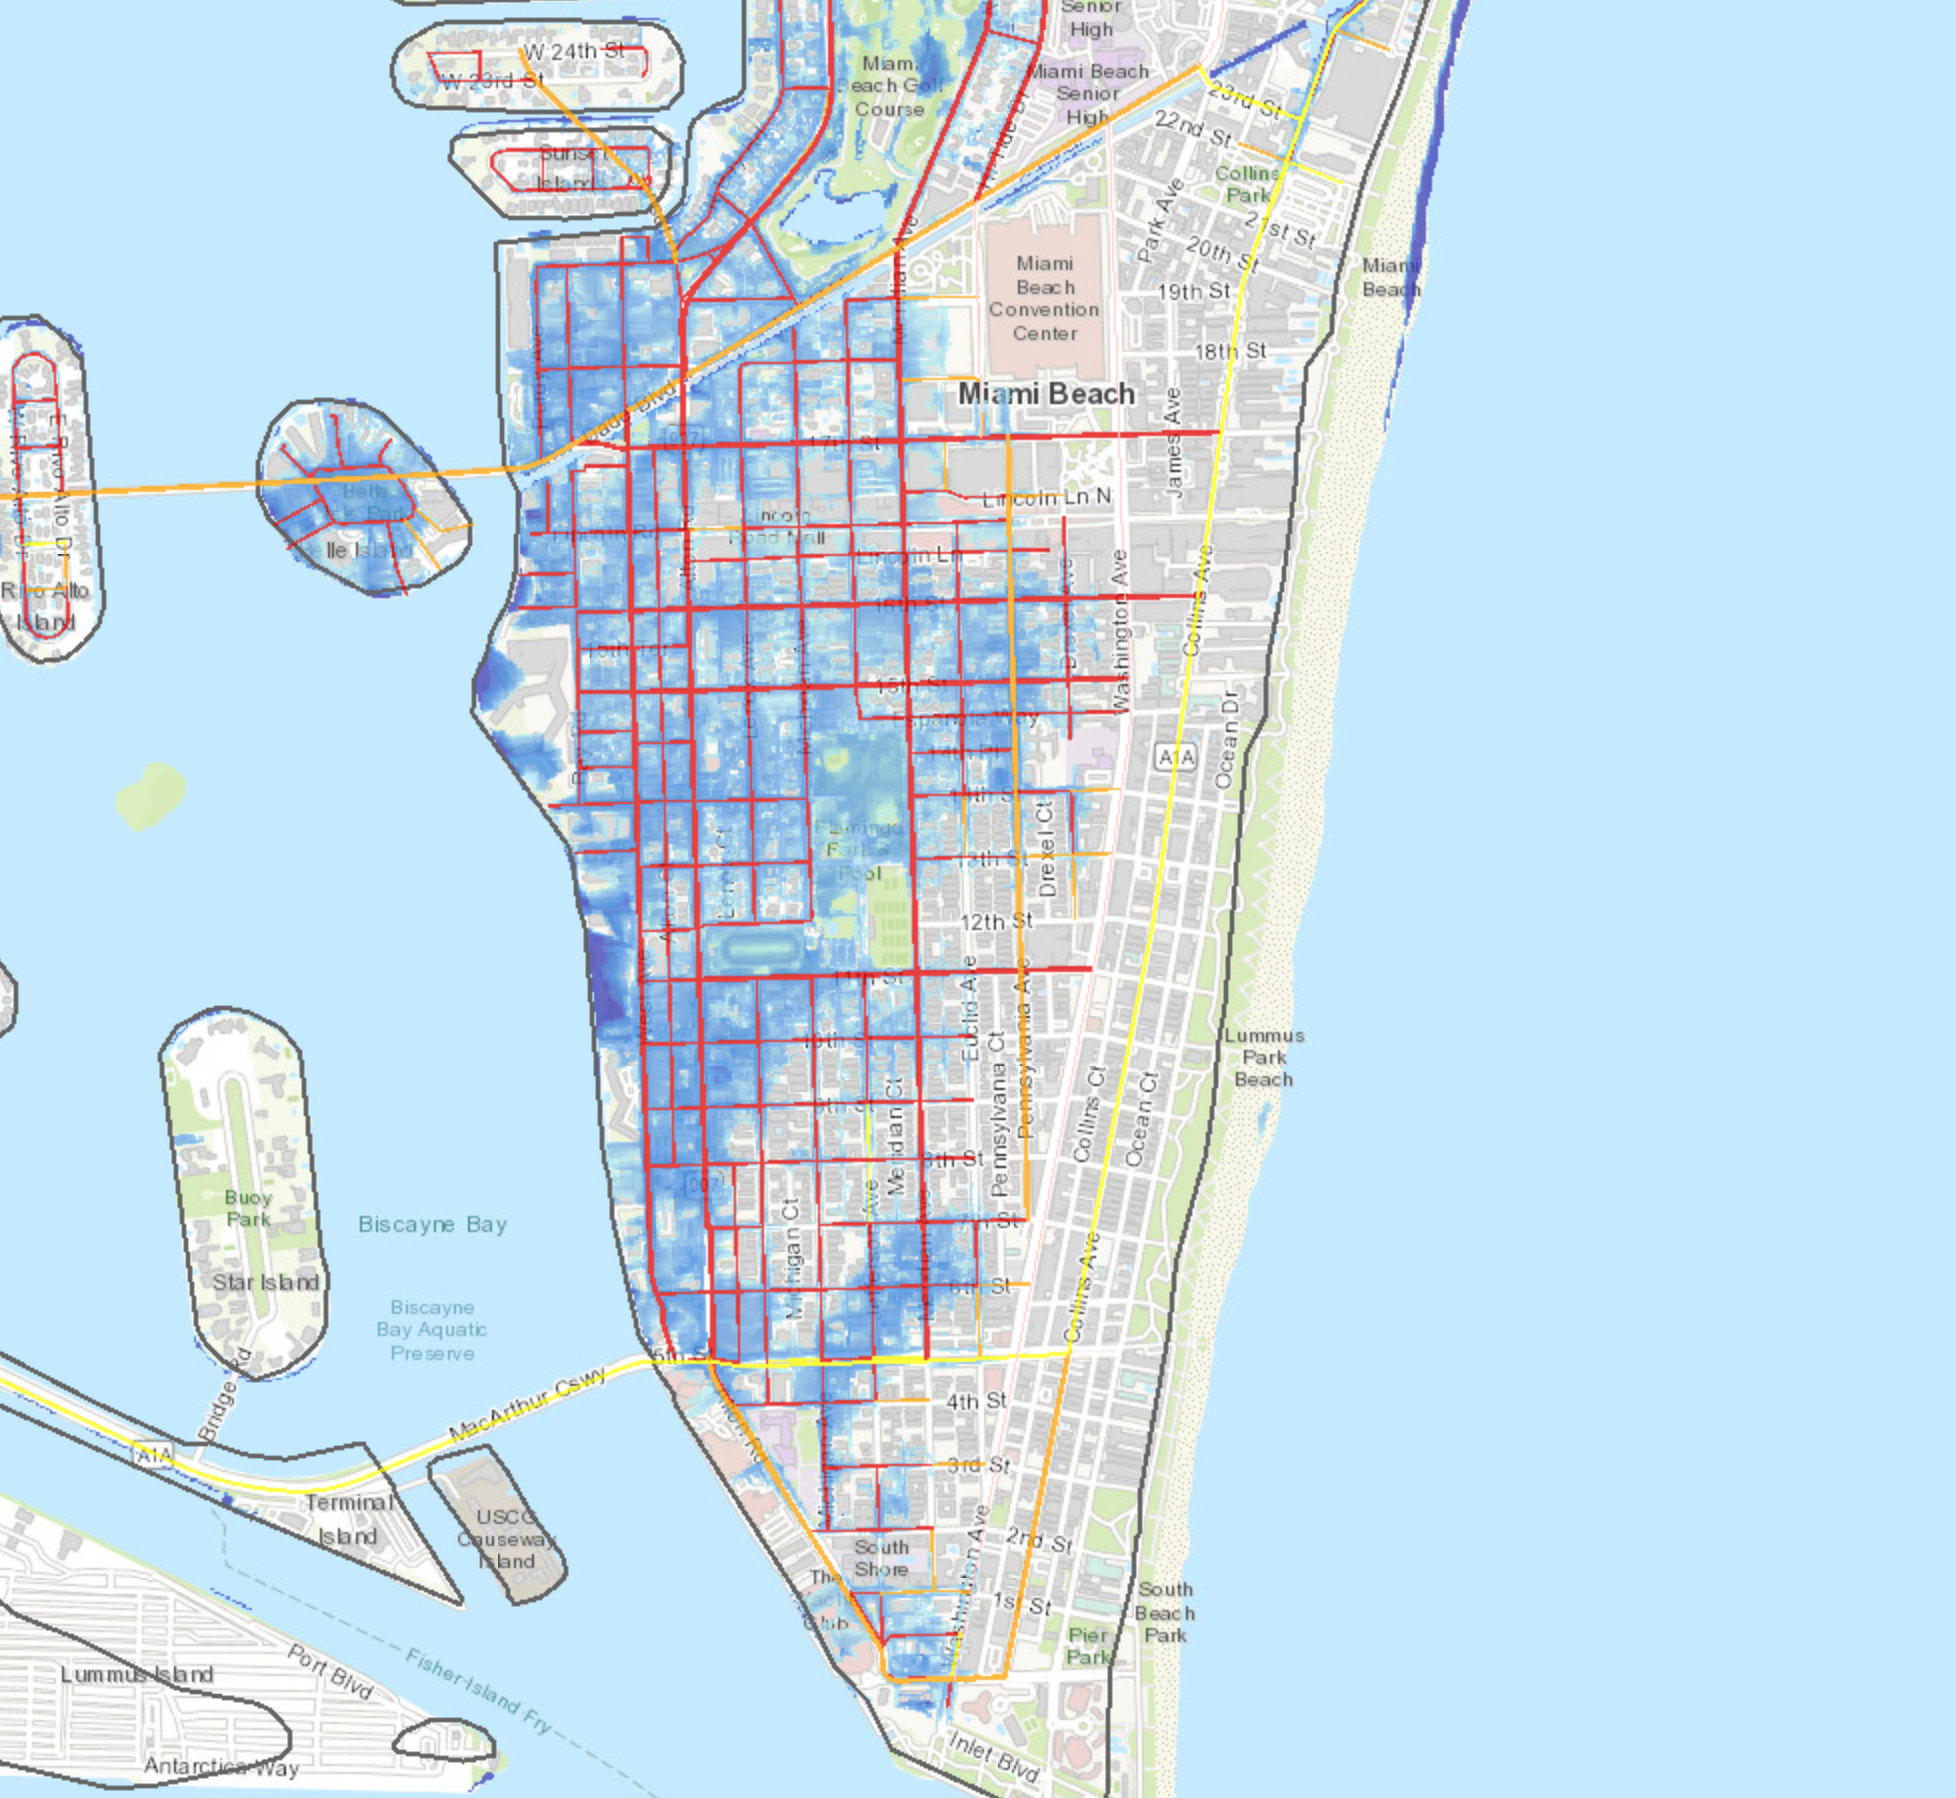
Figure 7. A mapping tool shows sea level rise (SLR) scenarios and affected transportation infrastructure in Miami Beach. Courtesy of University of Florida
For instance, in the event of a 1-ft sea-level rise (which Rutgers scientists predict is likely to occur by 2070), the current mapping application shows the devastating effects of a Category 2 hurricane on Atlantic City, dramatically worsening the storm’s flooding impacts. The Florida Department of Transportation (FDOT), in association with the University of Florida GeoPlan Center, have developed something similar, the Sea Level Scenario Sketch Planning Tool. This application specifically focuses on transportation infrastructure, showing, for example, a 2070 scenario in Miami Beach (Fig. 7) that illustrates sea-level rise (SLR) affecting a majority of roads on the barrier island. The NJFloodMapper also models SLR, with projections for rising seas to begin consuming the Jersey Shore.
Resiliency at NJDOT
Here in New Jersey, NJDOT is currently engaged in an enterprise-wide effort to integrate resiliency into major functions. The department’s intention is to establish resilience as an adoptive policy for the agency, in a manner similar to that of Complete Streets.
Driven by goals set out in the 2021 State of New Jersey Climate Change ResiliencyStrategy, NJDOT and agency partners are collaborating to integrate resiliency in a variety of ways. For example, NJDOT is working with the Department of Environmental Protection (NJDEP) to effectively predict shifting rainfall patterns’ effects on flooding, which will be used to update stormwater management guidance. Another initiative in the strategy calls for coordinated, cross-agency regional sediment management plans, for the purpose of properly re-using dredged material for resiliency improvements, such as elevating marshes or potentially creating new near-shore islands. To mitigate the complex threats of climate change, such multidisciplinary collaboration is required.
Figure 8. NJDOT is looking to integrate resilience into workflows department-wide, and developing new tools to support staff in their efforts. Hydropeek | Wikimedia Commons
At NJDOT, several technical tools are being developed to support these efforts. The Flood Risk Visualization Tool, mentioned above, is one example. Another is a Criticality Tool, which analyzes data on infrastructure assets, and will assist staff in discerning the most essential pieces of the transportation system. The Climate Hazard Visualization Tool will help staff to “red flag” potential points of exposure, particularly regarding storm surge and flooding.
With these tools in place, resiliency will be integrated into workflows, for instance, becoming a component under consideration in the concept development process, impacting the outcome of preliminary engineering or design work.
Assessment-Informed Decisionmaking
The Pennsylvania Climate Action Plan, in its climate adaptation section for built infrastructure, makes the financial case for resilience investments: “for every $1 invested by the public sector in disaster mitigations, $6 is saved in recovery costs.” This figure, culled from a cost-benefit analysis from the National Institute of Building Sciences, makes a powerful argument for making necessary but expensive resilience investments.
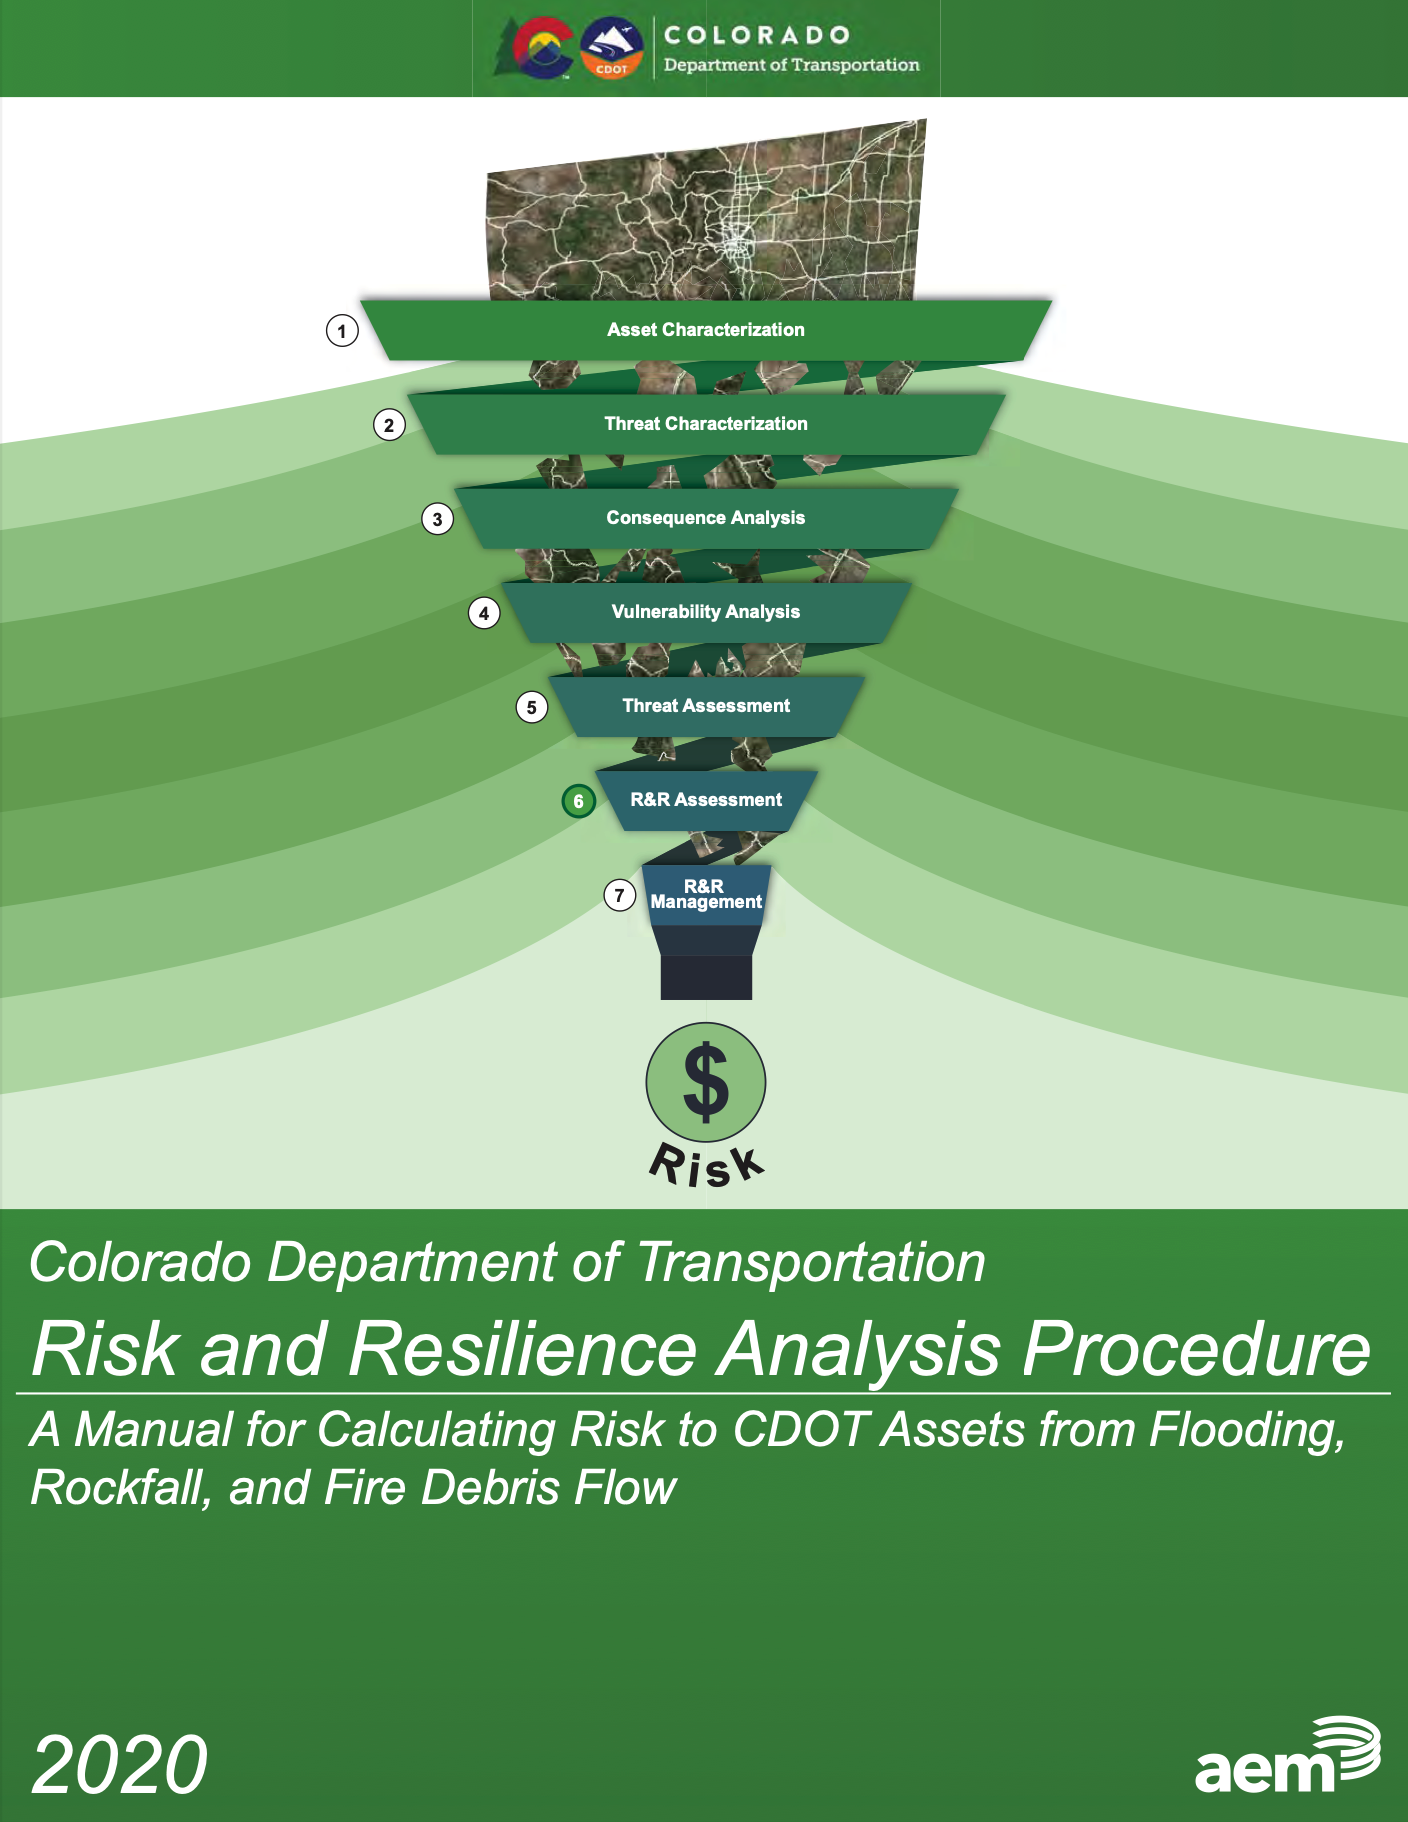
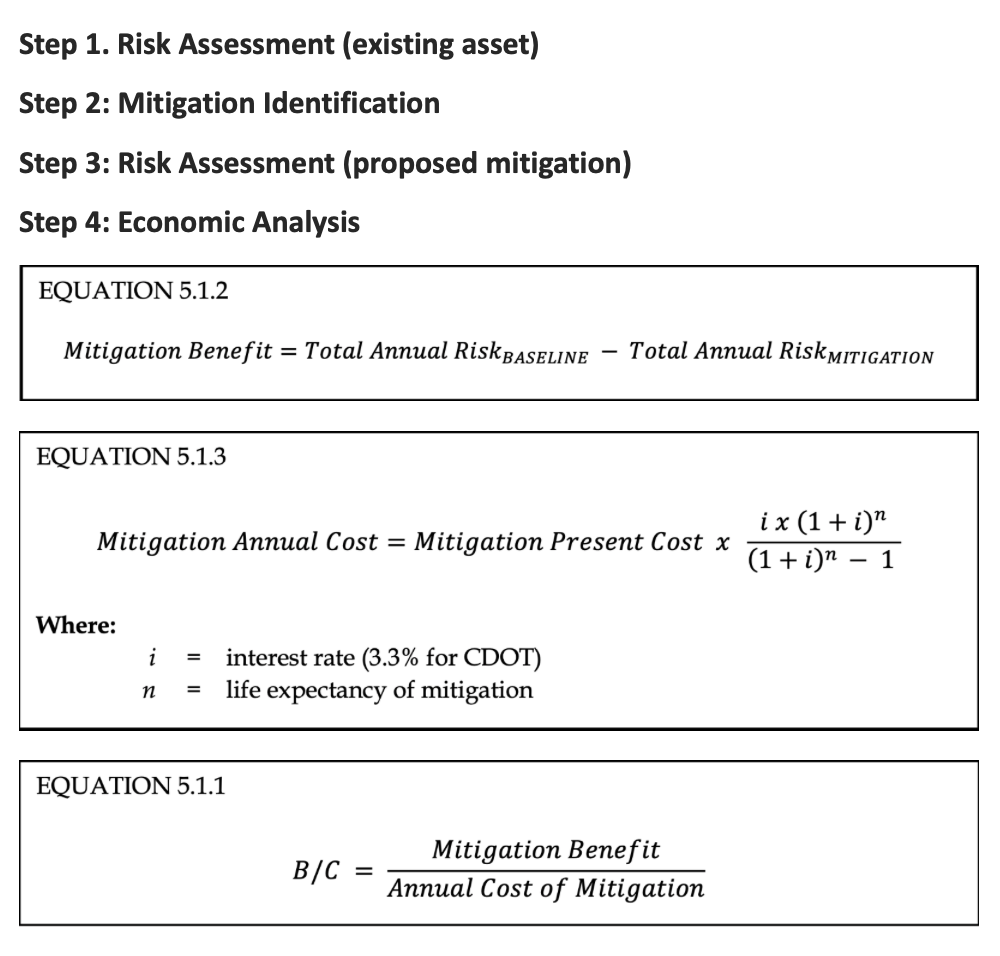
Figure 9. The seven-step Risk and Resilience Analysis Procedure from CDOT guides risk calculation and resilience prioritization. Courtesy of CDOT
CDOT’s Risk and Resilience Analysis Procedure (2020) stands out for the economic considerations and educational tools that the manual provides to build the capabilities of agency staff to conduct analyses and calculate costs. With sample problems, the resource walks through how to conduct such an assessment, including components such as user consequence (such as lost time or damage), and owner risk (such as cleanup and restoration costs), which are summed and presented as an annual figure, in dollars.
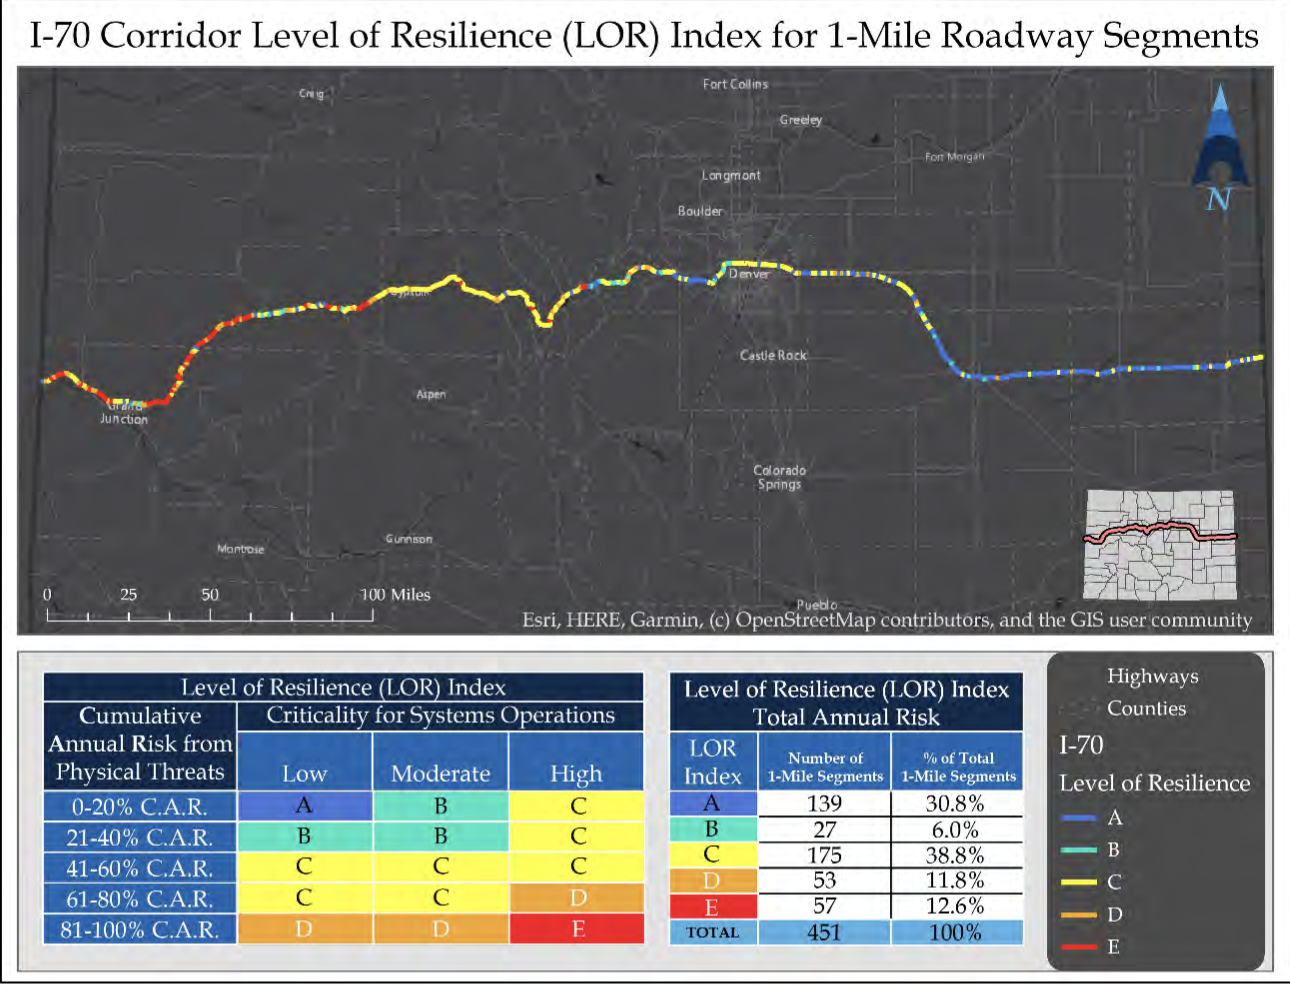
Consultants created a criticality score (including elements such as traffic, freight value, tourism, etc.), to gauge a particular state highway network asset’s importance to the overall vitality of the state’s economy. In the agency’s example, a Level of Resilience (LOR) index was created for 1-mile roadway segments across the I-70 Corridor. The Index takes into account each segment’s criticality for systems operations, as well as cumulative annual risk, and assigns each a letter grade. After sections of a corridor are graded according to the LOR Index, certain segments can be strategically targeted. In these areas, an economic analysis, to study the efficacy of making resilience improvements, is to be performed. The Risk and Resilience Procedure provides sample cases of such analyses.
Figure 10. CDOT’s Level of Resilience (LOR) Index for the I-70 Corridor, identifying critical, vulnerable segments to be studied. Courtesy of CDOT
For example, risk management for a minor culvert is performed as follows: total annual risk, which would continue without a mitigation, is calculated as $260,424. For the next step, a proposed mitigation, in this case replacing the existing culvert with a 72-inch RCP pipe, is said to cost $500,000. Now, a risk assessment is calculated as if the new pipe were in place—total annual risk drops to $51,114. On the fourth and final step, the economic analysis is performed, to see if this intervention is worthwhile. First, the mitigation benefit is calculated as the total annual risk from the mitigation ($51,114) subtracted from the baseline total annual risk ($260,424), leading to a positive mitigation benefit of $209,310. Then, the ultimate Benefit-Cost (BC) ratio is assigned. In this case, the $500,000 pipe mitigation is given a $17,168 annual cost, which serves as the denominator in the ultimate calculation: Annual mitigation benefit divided by annual mitigation cost (B/C), or $209,310 divided by $17,168. Here, B/C = 12.2, well over the value of 1 needed to prove that the mitigation is economically viable. Thus, the new pipe in the culvert will be a worthwhile investment.
Figure 11. A sample framework for performing Economic Analysis for Risk Management, from CDOT’s Risk and Resilience Analysis Procedure. Courtesy of CDOT
Using the formulas and steps laid out in the resource, CDOT staff may calculate the risk of flooding in a major culvert, or a post-fire debris flow in a tunnel, such as what occurred in Glenwood Canyon on I-70 in July 2021. With this framework in place, the agency is able to make informed decisions about how to prioritize resiliency investments, and strategically mitigate future disasters.
In Washington State, a 2015 FHWA-sponsored pilot study looked to transition from risk assessment to developing a scenario-planning and decision-making framework. Creating a Resilient Transportation Network in Skagit County: Using Flood Studies to Inform Transportation Asset Management examines adaptation options for state transportation facilities in the vulnerable Skagit River Basin. The pilot combines information from WSDOT’s previous comprehensive risk assessment with the results of a flood study from the U.S. Army Corps of Engineers. However, had the planners been unaware of a plan to improve and extend levees in the region, their suggested alternatives would have been misinformed, leading to what is termed maladaptation. “There is a synergy that comes from combining our efforts.” the report concludes. “When we work together, we can find solutions that might not be possible, and avoid problems that might occur.”
Conclusion
The methods outlined in this article, while by no means encompassing the scope of resiliency efforts underway at state DOTs in the Unites States, provide a glimpse into how some transportation agencies are approaching the threat of climate change. Broadly speaking, there is a need to comprehensively inventory infrastructure, grading it based on levels of criticality and vulnerability, and then to develop a phased plan detailing how resiliency measures will be taken.
Because there are many DOTs considering this issue, it is beneficial to examine their various approaches, especially in states with weather and infrastructure networks similar to New Jersey’s. While Colorado, with its mountains, wildfires, and mudslides, varies wildly with the East Coast, CDOT can be seen as a leading model for the process of climate resiliency planning. The preponderance of threats motivated the agency to develop a response plan early on, which now provides a toolkit and road map for its statewide resiliency work. The threat of climate change is great, but it brings with it an opportunity to innovate, to develop new processes and technologies that make a stronger, safer network for the traveling public.
National Cooperative Highway Research Program. (2020). Incorporating the Costs and Benefits of Adaptation Measures in Preparation for Extreme Weather Events and Climate Change Guidebook. Transportation Research Board. http://nap.edu/25744
National Cooperative Highway Research Program. (2018). Resilience in Transportation, Planning, Engineering, Management, Policy, and Administration. Transportation Research Board. http://nap.edu/25166
National Cooperative Highway Research Program. (2021). Transportation System Resilience: Research Roadmap and White Papers. Transportation Research Board. http://nap.edu/26160
New York State Department of Transportation. BRIDGE NY. New York State Department of Transportation. https://www.dot.ny.gov/BRIDGENY
State of New Jersey (2021). State of New Jersey Climate Change Resiliency Strategy. State of New Jersey. https://www.nj.gov/dep/climatechange/resilience-strategy.html
Transportation Research Board. (2020, September), Transportation Research Circular: Transportation Resilience 2019: 2nd International Conference on Resilience to Natural Hazards and Extreme Weather Events. Transportation Research Board. http://onlinepubs.trb.org/onlinepubs/circulars/ec265.pdf
Turnbull, Katherine. (2016). Transportation Resilience: Adaptation to Climate Change. National Academies of Sciences, Engineering, and Medicine. http://nap.edu/24648
Yang, David Y., and Frangopol, Dan M. (2019, November). Physics-Based Assessment of Climate Change Impact on Long-Term Regional Bridge Scour Risk Using Hydrologic Modeling: Application to Lehigh River Watershed. Journal of Bridge Engineering. https://ascelibrary.org/doi/10.1061/%28ASCE%29BE.1943-5592.0001462
Every Day Counts (EDC) is the Federal Highway Administration’s (FHWA’s) program to advance a culture of innovation in the transportation community in partnership with public and private stakeholders. Through this State-based effort, FHWA coordinates rapid deployment of proven strategies and technologies to shorten the project delivery process, enhance roadway safety, reduce traffic congestion, and integrate automation.
This report summarizes the June 2021 status of deployment for the seven innovations in the sixth round of EDC. The report is intended to be a resource for transportation stakeholders as they develop their deployment plans and to encourage innovation in managing highway project delivery to better serve the Nation.
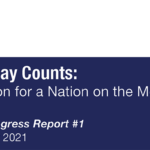
The New Jersey Department of Transportation Bureau of Research convened a Lunchtime Tech Talk! Webinar on What Happens Now? Virtual Public Involvement During and Beyond COVID-19 on October 6, 2021. Amanda Gendek, Manager of the NJDOT Bureau of Research, welcomed everyone to the event which included presentations by five representatives of public sector transportation agencies who discussed the immediate transition and ongoing adaptation to virtual platforms to engage with the public for transportation plans, projects, and other activities, and the benefits and challenges associated with this shift. Of particular emphasis was outreach to underserved and vulnerable populations.
Facilitators for the Tech Talk, Andrea Lubin and Trish Sanchez, from the Rutgers University-Voorhees Transportation Center, Public Outreach and Engagement Team (POET), opened the session with reference to their work on NCHRP Synthesis 538: Practices for Online Public Involvement, and the next phase of work, NCHRP 08-142 Virtual Public Involvement (VPI) – A Manual for Effective, Equitable, and Efficient Practices for Transportation Agencies. During the pandemic, Rutgers POET has conducted public engagement which transitioned to virtual for the South Jersey Transportation Planning Organization, Somerset County, and Middlesex County’s Destination 2040 projects. Ms. Sanchez noted the need to experiment with different engagement practices to find what works for each community, and the benefits of building partnerships with local organizations to reach a broad audience. She also noted challenges with VPI such as the digital divide, internet access, and staffing. Ms. Lubin discussed a 2020 study conducted for the Kessler Foundation and interviews with social service agencies and community organizations that offered lessons learned when conducting virtual outreach with vulnerable populations. Despite challenges, Ms. Lubin emphasized that VPI has expanded engagement opportunities in many instances to those who had previously been unable to participate in-person due to obstacles including transportation and childcare.
Rickie Clark, Transportation Specialist with FHWA, noted that Virtual Public Involvement (VPI) is one of the innovative initiatives supported in the fifth and sixth rounds of the agency’s Every Day Counts Initiative. He reviewed the legislation and regulations that requires early and continuous public involvement in the transportation planning and project development process. To meet those requirements during the COVID-19 pandemic, FHWA issued VPI Temporary Guidance that will remain in effect until the pandemic has ended. Mr. Clark encouraged the use of a wide array of VPI tools that can be customized to the needs of particular projects and audiences. VPI extends outreach to the public and enables the public to engage with transportation officials efficiently and effectively. For those who have limited access to the internet, he emphasized that transportation agencies must provide alternatives to ensure full, fair, and meaningful participation for all. Mr. Clark noted that New Jersey is using many VPI innovations.
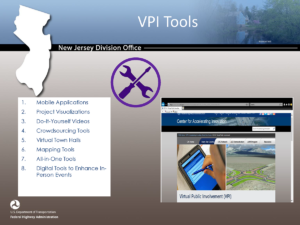
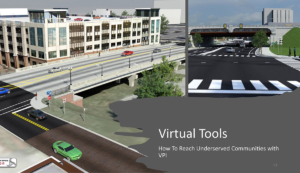
Jamille Robbins, Public Involvement, Community Studies & Visualization Group, Leader, North Carolina DOT, spoke on how his agency has reached underserved communities with VPI. He discussed the importance of pursuing thoughtful marketing to support the success of VPI and other outreach efforts designed to educate and inform the public and other stakeholders in the transportation project development process. He explained that broadening outreach and increasing engagement contributes to transparency and builds trust. He noted that social media is an effective tool for reaching rural, lower-income, Black, Hispanic, and less-educated populations, and that mobile phone friendly communication is essential. However, agencies should not be solely relying upon VPI. Traditional media, webpages, partner agency and organization networks, newsletters, postcards, door hangers and local access television and radio remain effective tools for reaching traditionally underrepresented groups. Similarly, integrating the use of phones to collect public comments can augment traditional methods for collecting input, such as paper surveys. Mr. Robbins shared experiences with utilizing a variety of VPI tools and platforms including public engagement software such as publicinput.com and the social networking service Nextdoor. He also described pre-recorded project information videos as a highly effective tool for controlling messaging and highlighted the agency’s use of online engagement platforms for live meetings, with the recordings placed on the web, so that constituents can access them and provide feedback at any time. Mr. Robbins also promoted the use of project visualizations, including 3D renderings and interactive animation that can be easily dispersed across online communication channels and improve understanding of proposed projects. While sharing many tools creatively being used by NCDOT, Mr. Robbins balanced his remarks with several takeaways and lessons learned observations about the limitations of VPI for reaching underrepresented communities.
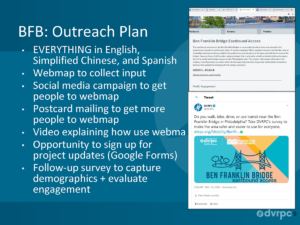
Alison Hastings, Associate Director, Communications, Delaware Valley Regional Plan Commission (DVRPC) spoke about the agency’s use of VPI in the Long Range Plan 2050 Visioning process, and for the Ben Franklin Bridge Eastbound Access project, and the regional MPO’s anticipated integration of VPI for public involvement in the post-pandemic era. When pivoting from in-person public engagement to virtual events, Ms. Hastings listed several themes that required consideration: accessibility and accommodations, recreating the in-person experience, setting ground rules and ensuring security. She also described her team’s considerations in determining the specific staffing roles needed for their virtual events, such as lead facilitator, technical assistance leader, and comment response facilitator, among other roles. She noted identifying these positions has helped to ensure smoother virtual events.
DVRPC has used many VPI platforms and tools, both old and new, such as videos, targeted social media campaigns, live transcription and captioning in meetings, web maps, and postcard mailings and noted that public participation has increased with their VPI efforts. Ms. Hastings discussed the advantages of meeting platforms that run well on browsers and smart phones and enable participation in underserved communities that lack internet access. In the future, DVRPC’s equity checklist will include using American Community Survey data to understand the demographics of the project area, communicating why the meeting is important, using Google forms to build contact lists, preparing the team for the challenges of online meetings, experimenting with different outreach, and evaluating the VPI process. She anticipates that hybrid meetings – in person and virtual – will continue and may require additional staff to run efficiently to achieve desired outcomes.
Vanessa Holman, Deputy Chief of Staff and Megan Fackler, Director of Government and Community Relations at NJDOT explained that their Public Information Centers (PICs) and other outreach must be compliant with Title VI requirements. Due to the pandemic, they needed to find ways to bridge the digital divide which is economic, generational, and geographic. NJDOT has combined established methods of engagement with virtual methods, and in particular, collaborated with stakeholders through social media, websites, and digital news sources. They noted that virtual meetings have helped to remove some barriers to participation, such as the need for transportation and childcare. Ms. Holman shared that they have lost some of the interaction typical of an in-person meeting, and noted the different staff demands of online meetings such as prepared scripts. The Department has also expanded communication in other ways, including through 1-2 page project update memos, written in plain language, for public officials. They now tend to over-communicate and continue to use a range of tools. These efforts are resulting in more public participation and comment in general.
Public involvement tools are available to engage underserved and vulnerable populations and expand outreach so every community member can participate in transportation decision making. Click for Andrea Lubin and Trish Sanchez's presentation
Mr. Clark noted that there is no one-size-fits-all public involvement process and promoted the use of an array of public involvement tools to communicate with the public and receive input. Click for Rickie Clark's presentation
North Carolina DOT uses 3D visualizations and interactive animation, among other tools, to help public involvement participants understand proposed projects and impacts. Click for Jamille Robbins' presentation
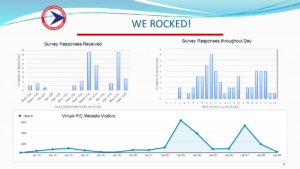
NJDOT was successful with their two-week, on-line PIC for the Rt. 80 and Rt. 15 Interchange project. They received large volumes of survey responses and discovered key times for public participation that will inform future efforts. Click for Vanessa Holman and Megan Fackler's presentation
At the end of the event, the speakers responded to questions posed by attendees through the platform’s chat feature.
Q. How expensive is NextDoor?
Jamille Robbins: I don’t believe there’s a huge cost associated but I would have to check with our social media coordinator.
Q. What program did North Carolina use to do 3D presentations?
Jamille Robbins: We use 3D Studio Max for a lot of the presentations.
Q. How do you provide for two-way communications and conversations in an online environment that would occur at in-person events?
Alison Hastings: The platforms, such as Zoom, help. The chat box becomes a primary source of input since you can save it. Conversations can happen in breakout rooms with small groups and a facilitator sharing a screen while using Google docs to record notes. Platforms push updates that provide these tools to emulate the in-person experience.
Trish Sanchez: Break-out groups allow people to feel more comfortable speaking openly.
Andrea Lubin: Especially if they are intimidated by large groups.
Q. What are typical costs for publicinput.com?
Jamille Robbins: North Carolina uses it on all projects and it is cost-effective, but I do not know specific costs.
Q. For NJDOT: Have you received feedback, either positive or negative, on the VPI process or the platforms used and has that encouraged you to change anything in your VPI strategies?
Megan Fackler: Not thus far. We have received questions on the platform, and requests for technical assistance. It is important to provide a phone number for people to reach out prior to a meeting if they are having difficulties accessing the meeting.
Q. For Rickie Clark: If a municipality requested an in-person event, would FHWA provide guidelines for conducting such a meeting?
Rickie Clark: The possibility for in-person meetings would depend on state and municipal guidance for in-person engagement, as well as the guidance of local health officials. During the pandemic, the VPI Temporary Guidance is in effect.
Q. If you could offer one piece of advice for VPI for underserved or vulnerable populations, what would it be?
Andrea Lubin: What I heard from Jamille was the power of radio advertising to target outreach, based on the number of people who are regular radio listeners.
Rickie Clark: From the federal perspective, agencies must have a public involvement plan in place to begin with. Agencies should evaluate the effectiveness of VPI tools. DOTs have become more nimble in modifying their approach. Imagine a time after COVID-19 when a hybrid model can be used and start planning now. It will be a win-win.
Jamille Robbins: Look at the demographics of the area and population characteristics. If there are EJ or LEP communities, reach out to the local planning office or someone familiar with the area. This is the most effective way to get into those communities.
Q. How do you handle data protection in the VPI process?
Alison Hastings: Don’t ask the question if you can’t protect the information you gather. Also, sunset dates determine how long a survey remains open. Set a date for expunging contact information after gathering that information. Use the same process for focus groups.
Jamille Robbins: We are simplifying the demographic information we are requesting. Asking for a name, email, and address may pass a threshold. Keep in mind that information gathered at a public meeting is a matter of public record.
The NJDOT Knowledge Management Toolbox offers examples of several knowledge sharing practices that have been, or could be, adopted by agency units to retain knowledge in a unit in the face of illness, retirements or transfers to other units at NJDOT.
In early 2020, a survey was distributed to New Jersey Department of Transportation (NJDOT) subject matter experts (SMEs) to identify current technology transfer needs, including potential topics for research. The survey also explored the insights and experience of the SMEs related to the challenges of implementing research findings and addressing knowledge gaps within the organization to advance understanding of job responsibilities, policies and procedures.
Subsequently, we followed up with Keith Daniels, Manager, NJDOT Bureau of Construction Services in the Division of Procurement, and Gary Vetro, a Contract Administrator in that unit, to learn about how the unit uses cross-training in practice.
For both of them, cross-training played a role in their introduction to the unit. Mr. Daniels offered that his earlier experience with cross-training led to his current position as Manager. While working in Equipment Materials and Supplies in Procurement, he had the opportunity to work, and be cross-trained, in several jobs in Construction Services. For several years, and in the absence of a Bureau Manager, he assisted the Director of Procurement in various tasks and functions in the Bureau. Prior to that, he had no experience in the procurement process for construction contracts. The Bureau staff were dedicated to getting the construction contracts out. As a result, he became familiar with every aspect of the unit and learning all the requirements of the Bureau.
Mr. Vetro came to the unit from another area in DOT and was cross-trained to cover for the individual who supervises the contract award process in the event that the individual took an extended leave. He brought his broader experience to the unit.
We interviewed Mr. Daniels and Mr. Vetro to explore any lessons learned, benefits and challenges of cross-training as a knowledge sharing practice.
Q. Can you describe cross-training for us?
Cross-training involves teaching an employee hired for one job responsibility, to perform the functions and skills of other job responsibilities within an organization. Cross-training is not tied to a specific skill set or educational background, but rather requires the desire to learn a new skill and the willingness to participate in new challenges.
Q. What prompted your unit to start cross-training?
There were already some elements of cross-training within the Division of Procurement as the Division Director supported cross-training over the years. Thus, previous experience with this concept has benefited the Division greatly.
In my [Daniels] present role, I inherited an office that formerly had over 25 staff members, and currently has nine (9) individuals, including myself, to perform the same basic functions. We are responsibly for awarding construction contracts for the state at an average of 100 contracts each year totaling $1.0 billion. The awarding of contracts is labor intensive and involves multiple administrative and technical steps. We are also responsible for reviewing and approving the pre-qualification applications of over 300 construction firms applying for renewal or new work type classifications to bid on our construction projects each year.
Although automation has improved the unit’s functioning over time, the staff members are required to learn other jobs and operate out of their sphere in order to provide coverage. This is not mandatory, but a willingness by the staff to engage in “teamwork”. The staff consists of two (2) financial auditors, three (3) engineers, and four (4) administrative personnel. A new hire who has a background in business administration is assisting everyone in the unit and learning all functions in the Bureau.
Because of this willingness by staff to participate as a team, Construction Services has significantly reduced the need for overtime to the Unit.
Q. Do employees cross-train for a number of positions or just one other position? Are all employees cross-trained to other positions? There are limitations when there are highly technical skill sets involved. The unit has engineers, and people with administrative and financial backgrounds. Someone with an engineering background could do some of the financial tasks, but would not be signing off on financial documents. Someone in data entry cannot train to do a job that requires engineering expertise. Still, they are able to learn some aspects of any job to assist when needed.
In small units, teamwork is essential and cross-training is a necessity. At times, everyone in our unit has to pull together to get the job done and staff has almost invariably been required to do work outside of their assigned job responsibilities.
Q. What schedule is followed for cross-training? How do people meet and learn? How much of an investment are they making?
The cross-training has been an informal process in the unit and is conducted as needed. At times, the Manager will introduce the idea, but also some staff members will initiate the training. We work as a team to get a big job done and everyone is contributing where they can.
Most training occurs during downtimes for the unit in July and December. Almost every unit has a seasonal cycle, so there is some downtime or slow times available for cross-training. Training involves a combination of direct instruction by the person who does the job, review of written procedures, and perhaps a practice exercise.
The time it takes for training is dependent on the employee, their abilities, how quickly they learn, and the task to be learned. The individual may learn the role in a couple of hours, a couple of days, or it may take longer. In one case, an employee was cross-training for data entry. The person whose position he was to train for was out so he was given the materials and he wrote the outline of job responsibilities and protocols so he can fill in if necessary. One is not training to be a master, just enough to get the job done while someone is out. Refresher training may take a couple of days. We might use a contract that has been completed and have the person training do it again as if they were responsible for it.
Frequency of retraining should be based on how often a backup might need to perform the function and the employee’s long term memory skills. If a person trained as a backup does not have to perform that function more than once or twice in a year, retraining will be more important than for a backup function performed once or twice a month.
Q. How do you prioritize roles for cross-training?
In our unit, every function should have some back-up. In general, you would look at which functions have time constraints or are important for other functions. These functions should be the first on the list for cross-training. You should have enough back-up personnel to keep the function running properly in case of unexpected staff shortfalls.
Consider which functions have only one person designated to perform them. Even if these are not primary functions, they may become a problem if the sole employee is out for an extended time.
Q. How has cross-training been valuable to the unit?
We are a small unit. It is critical for us to be able to continue work when staff is out of work, and especially during prolonged absences. As an example, we must ensure that there is adequate coverage for the contract award process, which accounts for 60 percent of our work. We must ensure that there is adequate coverage to meet the contract schedules and adhere to state and federal regulations regarding the Department’s contracts.
Furthermore, most of the Bureau staff, both professional and administrative/technical, work out of title just to get the job done. As a result, they have become proficient in other skills, engineering, financial, etc. that could mean job opportunities in other areas of the Department.
Cross-training can improve morale, increase productivity, and may lead to promotional opportunities. Sharing knowledge of other functions can help staff with attempts to advance and will lead to a greater willingness to cross-train. If someone can cross-train in another role, they may be able to apply for a higher position as they will have more knowledge and could possibly score higher on Civil Service Exams. As long as there are possibilities, and opportunities for advancement, employees will find cross-training attractive.
It is essential that employees get the necessary tools to go beyond what they do on a day-to-day basis.
Q. What have been some of the challenges to implementing cross-training?
Employees may feel that they are being asked to do extra work without compensation, and some, particularly those coming from the private sector, may believe that they are training their replacement. There needs to be communication to all employees about the benefits of cross-training to the unit, and the need to have someone who can fill in to meet the work requirements of the Unit.
Employees must be assured that the training is used only to cover for temporary staff shortages. Staff will be more likely to accept the idea of cross-training if they can trust that their participation will not increase their workload. There may be some people who have a “not my job” attitude and might introduce Civil Service and union constraints. The nature of this program is to have individuals perform tasks beyond their usual work on a temporary basis which should not raise concerns. A more formalized program could address these issues.
Q. Do you think this strategy would be valuable to other units?
Yes. In the case of smaller units, there may be only one person (or if you are lucky, two persons) who know and can perform their job, so cross-training is essential. If the unit is large enough, there may be multiple people doing the same job. However, cross-training would still be of value to improve morale and increase possible promotional opportunities.
Q. Any other observations that you can offer?
Certainly, specific and detailed training procedures must be developed to encourage knowledge sharing within individual units so jobs can be performed successfully when there are worker shortages. Each bureau or unit’s approach will be different; there is no “one-size-fits-all” way for getting cross-training done.
We recommend some best practices when using cross-training:
Ensure an employee’s regular job function is protected in some form
Provide clear communication about cross-training opportunities
Create a feedback mechanism to let employees know where they stand, obtain employee buy-in, and promote a willingness to participate.
Make clear that cross-training is voluntary
Work with what may be a select group of those employees willing to learn other tasks
Ensure that employee skill sets are commensurate with required skills
Establish a performance mechanism. This should be tied to the feedback procedure.
Ensure that cross-training is appropriate for the individual’s personal abilities.
Incorporate some aspect of mentoring, not necessarily formalized
If possible, ensure that whatever the employee is doing, they can do it in another unit. Promotional opportunities may lie elsewhere, so acquired skills should be generalized.
We are required to abide by specific state and federal regulations. We also have a fiduciary responsibility to ensure the health and safety of the public on the state’s roadways. The unit’s relationship with construction firms and awarding and executing contracts is critical to fulfilling that responsibility. We need to ensure that we are doing our job and cross-training has helped us with that mission.
The NJ State Transportation Innovation Council (NJ STIC) 3rd Quarter Meeting, held on September 15, 2021, featured presentations about the NJDOT Safety Voyager Tool and the NJ STIC Communications Plan, among other topics. The STIC Meeting Agenda had been distributed to the invitees prior to the meeting. Participants were invited to use the chat feature to offer comments or ask questions of the speakers during the online meeting.
Amanda Gendek, Manager of the NJDOT Bureau of Research greeted the meeting participants, followed by Asst. Commissioner Michael Russo who provided the Welcome and Opening Remarks.
FHWA EDC Innovation. Helene Roberts, Innovation Coordinator and Performance Manager for the FHWA NJ Office, noted that the first six-month progress report for the EDC initiatives and STIC incentive grant update reports were submitted, indicating few changes in the stage of implementation except for E-Ticketing and Digital As Builts. She shared a graphic of the EDC-6 deployment stage for each initiative illustrating the baseline assessment and goals for the two year period.
Ms. Roberts reported that NJDOT will pilot FHWA’s Let’s Go! Workshop which is designed to help in the formation of cohesive teams and plans to advance the EDC innovative initiatives. The workshops are scheduled for September 21st and 28th with a focus on the Strategic Workforce Development team, and the E-Construction team that will address Digital As-Builts and 3D Project Delivery. FHWA resource specialists for these subject areas will be present to assist in instruction and coaching for the pilot workshop(s).
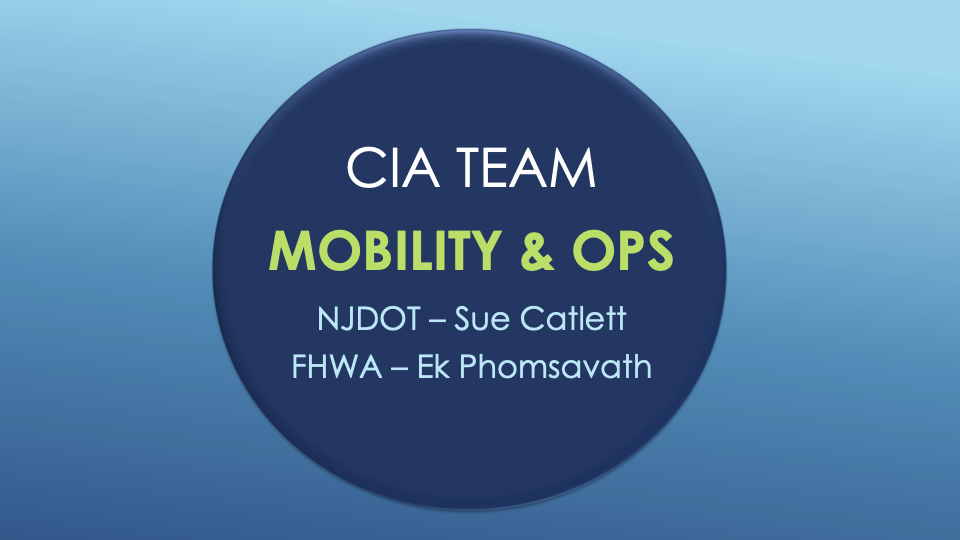
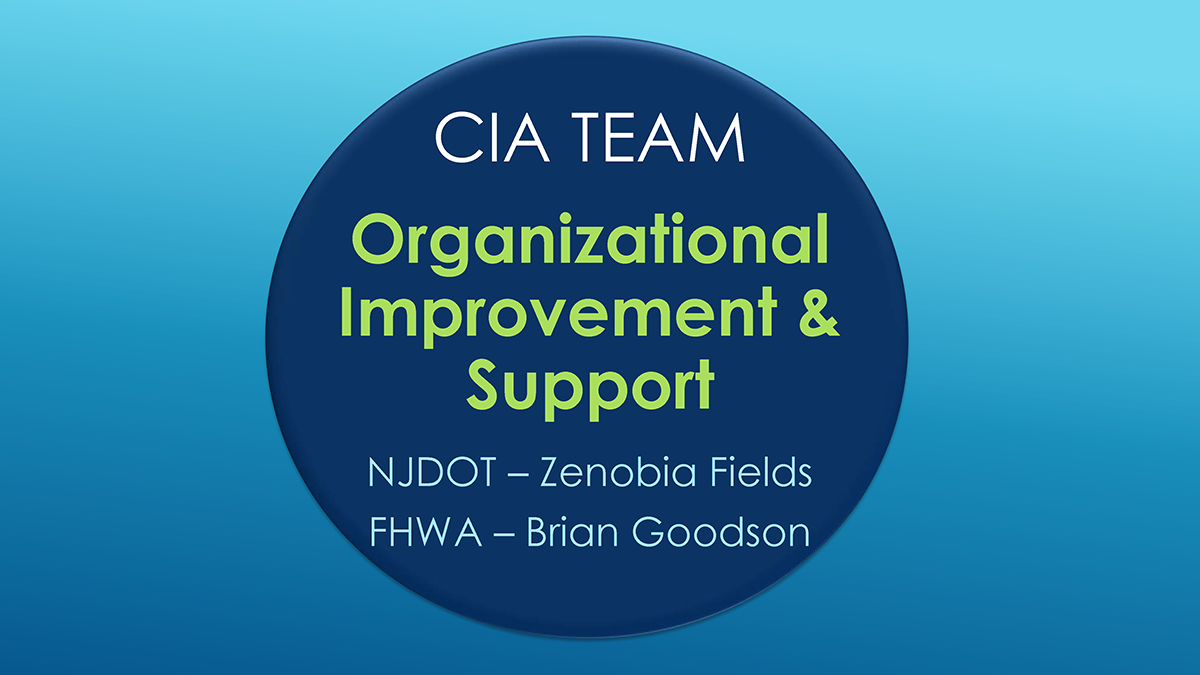
Core Innovation Area (CIA) Updates. The meeting continued with presentations from Core Innovative Area (CIA) leaders who provided updates of the status of EDC initiatives on the topics of Safety, Infrastructure Preservation, Mobility and Operations, and Organizational Improvement and Support
Featured Presentations.
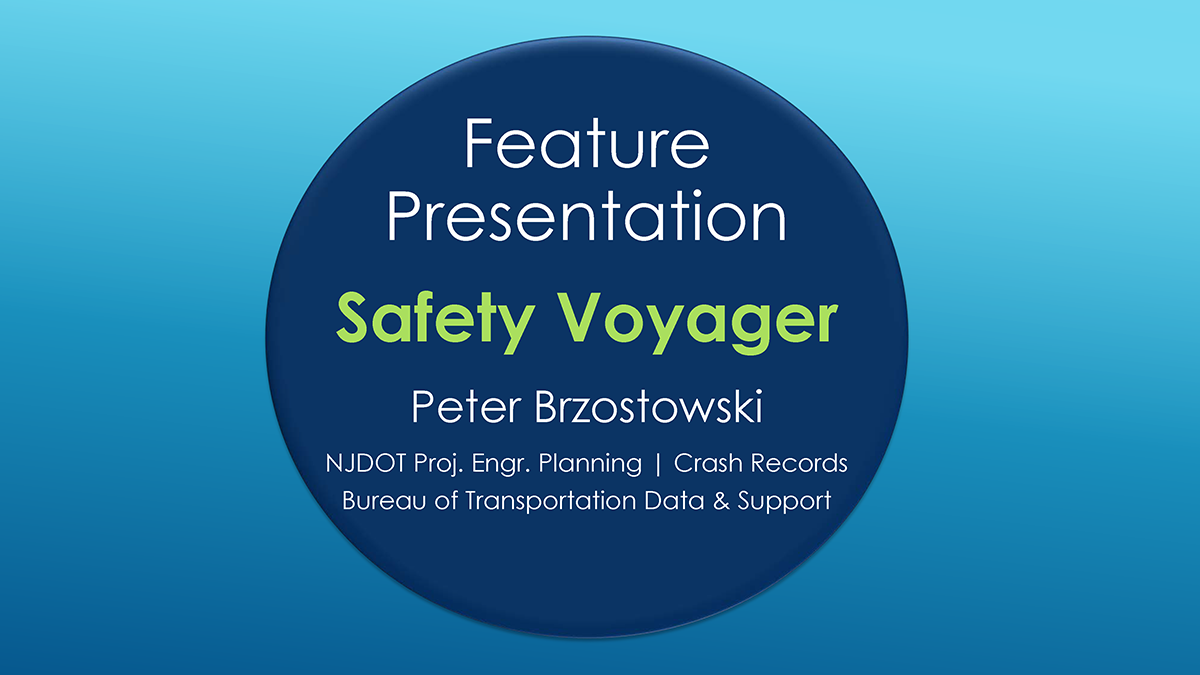
Peter Brzostowski, NJDOT Bureau of Transportation Data & Support shared an instructive video presentation that demonstrated several major features of the Safety Voyager tool which was followed by a questions and answer session. Safety Voyager is based on the NJTR-1 traffic enforcement crash reports. The tool provides information on crash incidents at specific intersections and corridors. Mr. Brzostowski walked through several scenarios to explore the various queries that can be made, for example, by weather-related events, years, type of crashes, and location, among others, and the use of modules that explore topics such as sun glare, weather, and crashes involving pedestrians and bicyclists. The tool includes an equity layer based on census data.
In response to a question, Mr. Brzostowski noted that employees of state government agencies, MPOs, and anyone working on a government project at any level can request access to Safety Voyager. Mike Russo added that the team had received input and feedback from various sources, and have been able to customize the tool to respond to primary customer needs. Expansion of the tool’s functionality continues.
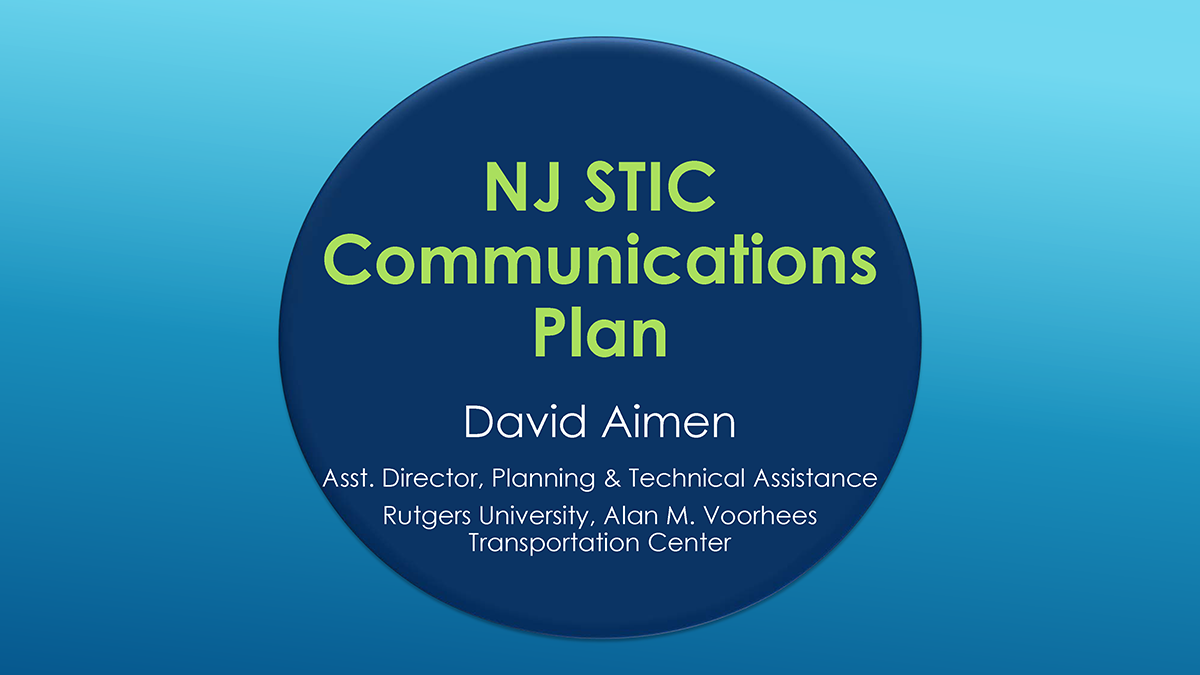
David Aimen, Rutgers-Voorhees Transportation Center, presented on the NJ STIC Communications Plan, noting that the development of the Plan was funded in part by a STIC incentive grant and prepared on behalf of the NJDOT Bureau of Research – the administrative lead for the management of NJ STIC. The Plan seeks to improve the NJ STIC’s effectiveness through continuing communications and engagement with STIC stakeholders. The Plan increases awareness of the FHWA Every Day Counts Program and NJ STIC by identifying a toolbox of communication tools, methods and strategies that will be used to document performance, capture and share information on innovative initiatives, and promote implementation of these initiatives throughout the State. The Plan is posted on the NJ STIC section of the Technology Transfer website here.
Following the presentation, Amanda Gendek and Helene Roberts conducted an interactive exercise with attendees to help identify innovative practices that could be featured at future NJ STIC meetings, in future communications and/or other technology transfer activities. The interactive polling exercise solicited suggestions from attendees on innovations that have been advanced by organizations and provide useful lessons learned for others, innovations that should be more widely shared with the STIC and others, and topics for innovative case study videos. The exercise also solicited feedback on continuing training needs for specific EDC-6 initiatives.
Reminders and Updates.
Amanda Gendek closed the meeting with reminders about several resources that highlight the NJ STIC and other innovation topics funded through research and technology transfer activities, including:
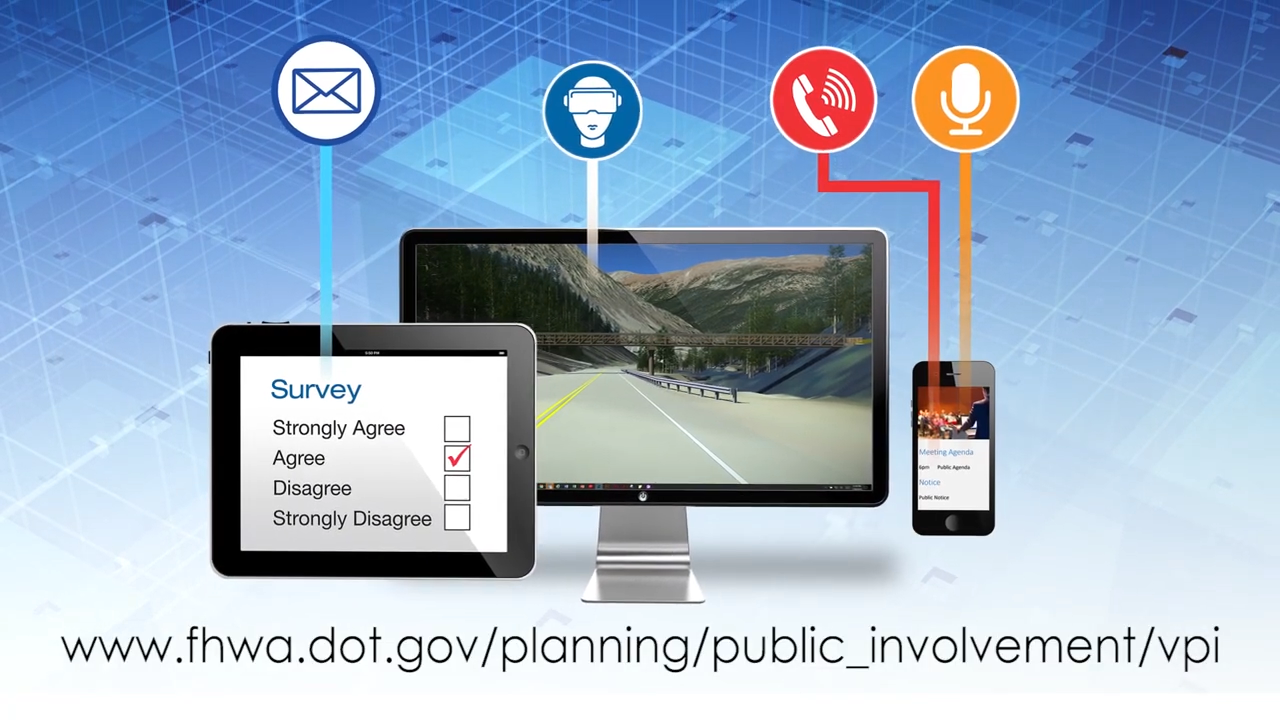
Virtual Public Involvement presents an opportunity to expand the community engagement process. An FHWA Every Day Counts Round 6 initiative (EDC-6), Virtual Public Involvement (VPI) gives participants an opportunity to engage, other than through a traditional, physical meeting, which can require more time and resources to attend. The use of virtual engagement technologies can boost public participation in the comment process, and provide new avenues for collecting data and disseminating information on potential infrastructure investments and other projects. By increasing opportunities for public communication and engagement, VPI can serve to ensure that the needs of the public are fully considered in transportation project planning and development decisions.
At NJDOT, the COVID-19 pandemic presented new challenges and opportunities for the agency’s public engagement efforts. The necessity of social distancing motivated the Department to conduct meetings and outreach virtually, transforming the outreach process. To learn more about the lessons learned in making this transition, three NJDOT staff members were interviewed: Vanessa Holman, the Deputy Chief of Staff, serves as NJDOT’s legislative liaison and oversees the Department’s Office of Government and Community Relations; Megan Fackler, Director of the Office of Government and Community Relations (OCR), oversees public engagement and handles responses to DOT-related issues and concerns raised by the public, elected officials, and others; and Zenobia Fields, Senior Policy and Program Advisor, is responsible for policy related to planning and programming, including statewide plans and safety initiatives, and engaging with national organizations (AASHTO, TRB). Their observations are summarized below.
What was VPI like at NJDOT before the pandemic?
NJDOT has always strived to employ tools and mediums that will help achieve positive outcomes, working to ensure that the public is treated as valued customers.
Prior to the COVID-19 pandemic, the agency was not especially “tech-forward” with public engagement, and instead utilized more traditional, in-person engagement strategies. However, NJDOT staff who regularly engaged with stakeholders and attended external meetings were issued tablets to help facilitate in-person interactions. Staff had access to Microsoft Teams and preliminary training in using that platform. So, at the onset of the pandemic, the OCR and other staff were equipped with the technological capabilities to transition to virtual engagement.
How did the pandemic affect NJDOT’s public engagement efforts?
Beginning the third week of March 2020, NJDOT pivoted to a VPI style of engagement. With the assistance of IT staff, OCR held a large legislative summit for an NJDOT project, and began virtually conducting project-specific local official briefings, public information sessions, and public hearings. This outreach occurs during every phase of major projects from concept development through construction. Public Information Centers (PICs) are similar to an open house event, where the public is invited to attend and review at their own pace project drawings and plans, ask questions, and provide feedback. During the pandemic, NJDOT established project-specific PIC websites with multi-lingual content available. Links to certain PIC virtual meeting videos created by consultants were also made available for a certain period of time (e.g., 14 days), which has increased the number of persons accessing those meetings.
For certain projects, OCR sends hard copy letters to stakeholders who live within a certain distance to the project location informing them of the project and advising them to contact NJDOT if they need technical or other assistance to engage.
With the onset of Covid-19, NJDOT and its staff pivoted to a VPI style of engagement.
Several other units, such as traffic engineering, also began using virtual engagement technologies, including pre-construction meetings. The NJDOT Permitting unit has engaged applicants virtually to walk through documents, including technical project plans. Using the screen-share function, presenters can show and discuss complex technical materials, including maps and jurisdictional documents.
What platforms does the Department use?
NJDOT utilizes Microsoft Teams for most VPI for both internal and external outreach. The Department initially used Cisco WebEx and GoToMeeting, but determined that Microsoft Teams was the most optimal platform for internal meetings along with Cisco WebEx for public meetings. While the agency does not have a Zoom account, consultants often use Zoom for public and stakeholder engagement.
Consultants are encouraged to use a variety of online engagement tools for public and stakeholder feedback such as crowdsourcing, wiki maps, mobile apps, videos, etc. NJDOT has used crowdsourcing to identify potholes, locations for bike share stations and other information.
How has the Department implemented VPI as a practice?
VPI has been embraced at the Department, necessitated by the pandemic, however standardized VPI as an implemented practice is still a work-in-progress. Some staff have received training in VPI and attended webinars on the topic from AASHTO and FHWA through its EDC-6 program, but the training has not extended beyond these collaborations. The expansion of VPI training for staff could be valuable to embed best practices about what works, and what doesn’t.
What are some of the benefits that have come with implementing VPI?
Overall, stakeholder meetings have experienced higher attendance and participation, such as the Strategic Highway Safety Plan meetings, because people do not have to travel, and can also avoid parking, traffic, scheduling conflicts, etc.
VPI tools are being using by transportation agencies to enable the public to access user-friendly features to receive information and provide input.
Also, employing VPI for PICs has afforded participants with more time to access project information at a time that is convenient to them and to formulate thoughtful comments and questions on the specific project. VPI has also helped NJDOT to more formally capture and respond to comments and inquiries via electronic tracking, as compared to in-person comment collection. Many NJDOT project websites include a hyperlink to make accessing them easier for the public, enabling them to “click” on the link to access project-related information and provide feedback. And, interested parties can opt to receive text or email alerts from the Department on certain projects (e.g., Route 495 project e-alert; I-295 project).
An in-person open house event or PIC gives participants approximately three hours to review materials and provide feedback, however a virtual event can be made available for a longer period via a hyperlink. Attendees of a virtual event do not have to travel and wait in line to ask questions or to share comments, which can be very time consuming at a highly attended PIC; instead, they can post feedback on chat or via a Q&A function, or ask questions via telephone. Virtual engagement also enables participants to view documents and materials at their own pace, allowing them to return multiple times if needed over a period of days or weeks.
Over the past 18 months, implementing VPI has also become easier for NJDOT staff because their familiarity with VPI platforms and tools has increased. VPI makes certain tasks simpler as well. For example, while the services of a translator would need to be secured for an in-person event, translation is undertaken automatically with certain VPI platforms (e.g., Google translate).
What are some of the challenges of implementing VPI?
Learning how to successfully employ VPI has involved a great deal of trial and error. It was helpful to use consultant services for some of the Department’s initial VPI events. There are always challenges when implementing virtual mediums, with technology, security, and establishing best practices. For example, early in the pandemic, a Zoom “bomber” hacked into one of the Commissioner’s virtual meetings, which necessitated a temporary meeting shut-down. Other common technology challenges encountered included difficult connections for participants, and issues with microphone and camera functionality.
The FHWA maintains a VPI webpage that is a store-house of case studies, webinars and peer changes on model practices.
Another concern regards ensuring full participation, as attendance does not necessarily mean engagement. Participants are encouraged to turn on their video cameras to minimize their multi-tasking during VPI – something that is not really an obstacle during in-person meetings. Using break out rooms, chat and the “raising hand” online platform features have been helpful to encourage engagement. Online polls have also been a successful VPI tool including Zoom polls, Mentimeter, and Poll Everywhere to encourage engagement.
Some people are quiet and may not be as open on VPI as they would be when talking one-on-one with a person, so there needs to be a balance of VPI engagement and effort made to ensure all of these virtual conversations are happening as they would if they were convened in person.
Receiving state approval to secure licensing for new platforms can be a lengthy process due to security reasons, as can be securing departmental acceptance and adoption of new technologies. Moving forward, the Department is open to learning and trying new virtual platforms and technologies to achieve goals, but at this time there is not a specific VPI need not being met.
What equity concerns have you observed with VPI?
NJDOT remains compliant with federal civil rights and non-discrimination requirements, with a Public Involvement Plan, and the Civil Rights group and Title VI Liaisons involved in each project. An initial challenge at the start of the pandemic was ensuring NJDOT’s VPI complied with NEPA and Title VI regulations. The Civil Rights unit was very helpful in navigating these regulations and ensuring OCR performed their due diligence in this regard.
Another challenge was ensuring that NJDOT was engaging with all, including those who are underserved, under-represented and do not have access to virtual platforms. Projects must be compliant and also must ensure engagement opportunities are accessible and folks have the technology needed for virtual access (e.g., smartphone, landline) and that computers are not needed in order to participate.
It is important to review and measure how many are participating and the quality of feedback obtained. Some low-income or non-tech savvy members of the public may not have the technology or computer literacy to participate in VPI. In order to address this “digital divide,” focus has been given to expanding broadband connectivity options, such as creating mobile hotspots in areas close to project sites where residents without Wi-Fi or broadband might be able to connect to the internet, making NJDOT interactive tablets available, and connecting through their smartphone or landlines to enable folks to meaningfully participate in the engagement process. If access to any technology is still a barrier for participation, another solution is to provide the opportunity to simply place hand-written suggestions in a physical comment box placed within the geographic limits of the particular project so it is easily accessible to local stakeholders.
What best practices have been developed with VPI?
A key best practice for staff working with VPI is to prepare a script and talking points ahead of time, and to practice with the team prior to the event to ensure familiarity and troubleshoot any identified technological issues. This pre-event planning process helps to ensure a smooth flow during the meeting.
Based on our COVID-19 experiences of the past eighteen months, NJDOT has learned more about the pros and cons of various platforms depending on the target audience, meeting topics, and goals. For example, MS-Teams has been best for internal meetings, or small meetings with elected and local officials, while Zoom’s webinar platform has been ideal for larger meetings and broader, more active public engagement. The use of a consultant to moderate public engagement has been beneficial, such as with enforcing time limits during comment sessions and assisting with technology issues. Over time, implementing VPI has become easier as familiarity with the platforms and technologies has increased among both NJDOT staff and the public.
How does the Department use social media in the public involvement process?
NJDOT has been using Facebook and Twitter, as well as YouTube to communicate longer video content. The Department uses social media to alert members of the public about upcoming PICs.
The primary social media platforms NJDOT uses are Facebook and Twitter, as well as YouTube to communicate longer video content. The Department uses social media to alert members of the public about upcoming PICs, offering the link to virtual PICs via Facebook posts. Facebook has been helpful for event pre-planning, and Twitter and the 511 website – a traffic condition platform – are effective when there is an immediate need to communicate to the public. The public uses social media to post comments and inquiries. Typically, the public feedback communicated through social media is brief, but sometimes commenters provide thoughtful, in-depth remarks from which NJDOT’s OCR can respond.
The Department also uses social media and other outreach tools to inform the public about NJDOT services and role in the community, emphasizing its customer focus. For example, the NJDOT Commissioner drafts an external e-newsletter called “Commitment to Communities” or C2C, that is distributed four-six times annually. Often the content focuses on “Did you know” types of facts related to NJDOT’s role and services. Approximately 6,000 persons subscribe to the newsletter. The online Local Aid Resource Center also uses various social media platforms to communicate primarily to existing and interested grantees.
NJDOT’s social media policy was established prior to the current administration, and primarily focused on employee practices and appropriate behavior as representatives of the Department. NJDOT is working on developing a new social media policy that will address how to monitor and manage the Department’s social media accounts, including how comments should be responded to and handled. The Department has recently hired a social media coordinator, as well as an in-house videographer. The social media coordinator has increased the Department’s Facebook following to 11,000 persons, which is a significant achievement, especially because the Department does not have an advertising budget for social media. The Department is considering trying new social media platforms, such as Instagram, and continually engages with other state department social media coordinators to learn from their work.
How will VPI be used moving forward?
Overall, both the quantity and quality of NJDOT public engagement increased with VPI implementation during the pandemic and VPI will continue post pandemic. Moving forward, the Department is open to learning and trying new virtual platforms and technologies to achieve goals, which will continue to be evaluated.
While VPI is more economical, in-person engagement remains relevant. NJDOT plans to utilize a hybrid engagement approach, with a mix of VPI and face-to-face engagement. Additionally, the Department must continue to work with community partners as trusted advocates to attract and encourage participation from a diverse set of constituents. The Department will further explore the expanded use of crowdsourcing tools, and the development of an online application for the public to use to contact NJDOT, in addition to using the Department’s central dispatch number.
A Pedestrian Hybrid Beacon (PHB) is a signalized, pedestrian-activated device designed to increase crossing safety. A recent study conducted by the New Jersey Bicycle and Pedestrian Resource Center (BPRC), funded by NJDOT, examined the efficacy and public awareness of PHBs in New Jersey. The authors, researchers from Rowan and Rutgers universities, found a persistent need to better educate motorists and pedestrians in New Jersey on the PHB and its phases.
The five phases Pedestrian Hybrid Beacon’s (PHB) operations
Pedestrian Hybrid Beacons are one of FHWA’s seven Safe Transportation for Every Pedestrian (STEP) countermeasures, proven methods of reducing pedestrian collisions. STEP was promoted through multiple rounds of the FHWA’s Every Day Counts (EDC) Program. A PHB is typically placed to improve pedestrian safety at uncontrolled and mid-block crossings, in locations with high pedestrian demand and wide roadways. The treatment consists of two signal arms on each side, with pedestrian “push buttons” and a crosswalk. The PHB operates in five phases. In the first, the PHB’s signal is off. The second phase begins when a pedestrian activates it by pressing a button, prompting the signal to flash a yellow light. Then, for the third phase, the flashing transitions to a solid yellow light, communicating to drivers that they should prepare to stop. Then the light turns red, and, in the fourth phase, the pedestrian signal changes to “Walk.” After an interval, the fifth phase begins: the pedestrian signal displays a countdown timer, and the traffic signal flashes alternating red lights, telling drivers to stop and that they may proceed if the crosswalk is clear.
The study’s literature review found multiple examples of prior research demonstrating the efficacy of PHBs. In the case of Tucson, Arizona, where one of the first PHBs was deployed in the United States, one study found a 69 percent decrease in pedestrian-related crashes in the signal area. Another analysis in Tucson found a 97 percent yielding rate from drivers at PHB-equipped crossings. One of the chief findings from the literature review was that PHB signal evaluations were lacking in New Jersey. Thus, researchers aimed to more systematically analyze PHBs in the state.
The authors found ten implemented examples of PHBs throughout the state, from Bergen County to Atlantic County. For more in-depth research, they selected signals in three different community types (urban, suburban, and campus area), in Morristown, Medford, and New Brunswick, New Jersey, to undergo video analysis.
The five phases Pedestrian Hybrid Beacon’s (PHB) operations
One commonality observed in all three locations was an apparent confusion for motorists concerning the fifth phase, in which the signal flashes red, indicating that drivers should stop and then proceed with caution. In New Brunswick, 100 percent of observed motorists remained stopped, even after the intersection had been cleared. In Morristown, the vast majority of pedestrians (91.3%) failed to use the PHB during the morning period, and also failed to do so in the evening (83%). The authors attribute such behavior to the PHB timing being linked to two nearby traffic signals, contributing to extra delay after the crossing button has been pressed. When inconvenient, it seems, pedestrians may opt to cross on their own.
To better understand the familiarity of pedestrians and motorists in New Jersey with PHBs, the researchers designed an online survey that was sent to 79,567 randomly selected email addresses from 30 communities across the state. While respondents indicated some confusion as to how PHBs functioned, a plurality indicated that they would be very likely or somewhat likely to support implementation in their own community. A majority of respondents (85.9%) reported that they had never heard of PHBs, and later indicated that completing the short survey had increased their knowledge of the safety treatment, showing the potential benefit of more public education about their functionality.
The report concludes by stating that while PHBs are proven to be effective at increasing pedestrian crossing safety, a lack of public awareness on the part of both drivers and pedestrians currently limits the effectiveness of these devices. The researchers suggest updating the New Jersey Motor Vehicle Commission’s Driver’s Handbook to include the PHB, and to differentiate the flashing red signals at a PHB where the driver must yield and then proceed if the crosswalk is clear, from the flashing red signals at railroad crossings where the driver is required to stop and remain stopped. This addition could be complemented with a public education campaign to teach pedestrians and drivers about the intricacies of Pedestrian Hybrid Beacons.
The New Jersey Bicycle and Pedestrian Resource Center (BPRC) works to promote a safer and more accessible walking and bicycling environment in the state. The Center, located at the Alan M. Voorhees Transportation Center at Rutgers, is supported by NJDOT through funding from FHWA. Further information technical assistance, resources for Complete Streets, and current research is available on the BPRC’s website.
The Federal Highway Administration (FHWA) has announced the FY 2021 Accelerated Innovation Deployment (AID) Demonstration Program and will make up to $10 million in grants will through Notice of Funding Opportunity (NOFO) 693JJ321NF-AIDDP (link). The AID Demonstration program provides funding as an incentive to accelerate the implementation and adoption of innovation in highway transportation. Eligible activities may involve any phase of a highway transportation project between project planning and project delivery, including planning, financing, operation, structures, materials, pavements, environment, and construction. The FHWA will provide AID Demonstration grants to eligible State DOTs, Federal Land Management Agencies, and tribal governments.
Key NOFO Dates
Notice of Intent to Apply Deadline: August 3, 2021: 11:59 pm Eastern Time.
Application Submission Deadline: September 28, 2021; 11:59 pm Eastern Time.
The FHWA will host an AID Demonstration Information Session to provide an overview of the FY 2021 program. Participation is not mandatory in order to submit an application under NOFO 693JJ321NF-AIDDP. However, potential applicants are encouraged to participate. Please join us on July 27, 2021 at 1:00 pm (Eastern Time). There is no registration required to attend the Information Session. To join, simply CLICK HERE to be taken directly to the virtual meeting space. This will be a MS Teams Live Event and will be recorded.