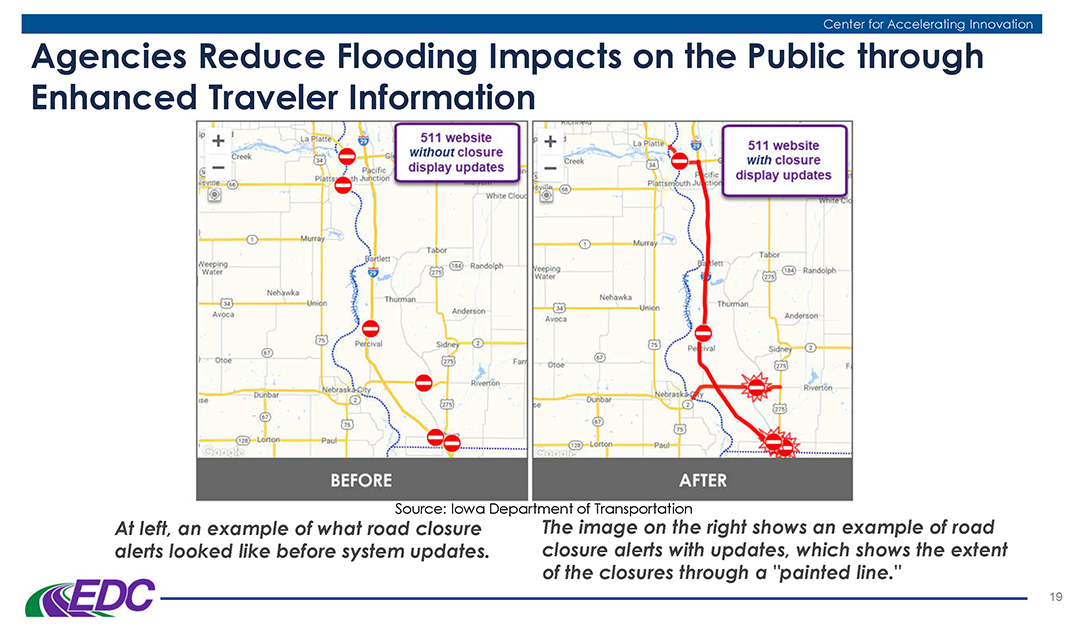
The Federal Highway Administration is encouraging State Departments of Transportation to utilize A-GaME, one of the agency’s Every Day Counts (EDC-5) innovations, to mitigate risks and improve reliability of geotechnical site characterization with proven, effective exploration methods and practices.
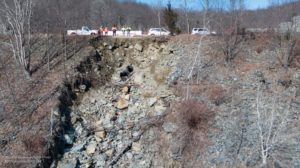
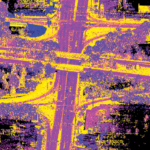
NJDOT used a drone to safely photograph the full extent of the soil erosion
This article is a summary of an interview with New Jersey Department of Transportation (NJDOT) employees with expertise in engineering and geology from Geotechnical Engineering and Engineering Geology. The interview was held with Kim Sharp (Supervising Engineer, Geotechnical Engineering), John Jamerson (Project Engineer, Engineering Geology), and Amanda McElwain (Principal Engineer, Engineering Geology) to discuss how NJDOT utilizes A-GaME methods for its projects and the benefits these methods provide.
Q: What is A-GaME?
A-GaME is an acronym for “Advanced Geotechnical Methods of Exploration” that encompasses a relatively new set of techniques for subsurface exploration that provides a more complete understanding of an area’s geotechnical and geological properties. In short, these techniques allow engineers to “see” what’s underground during a project’s design phase.
A-GaME techniques include the following processes:
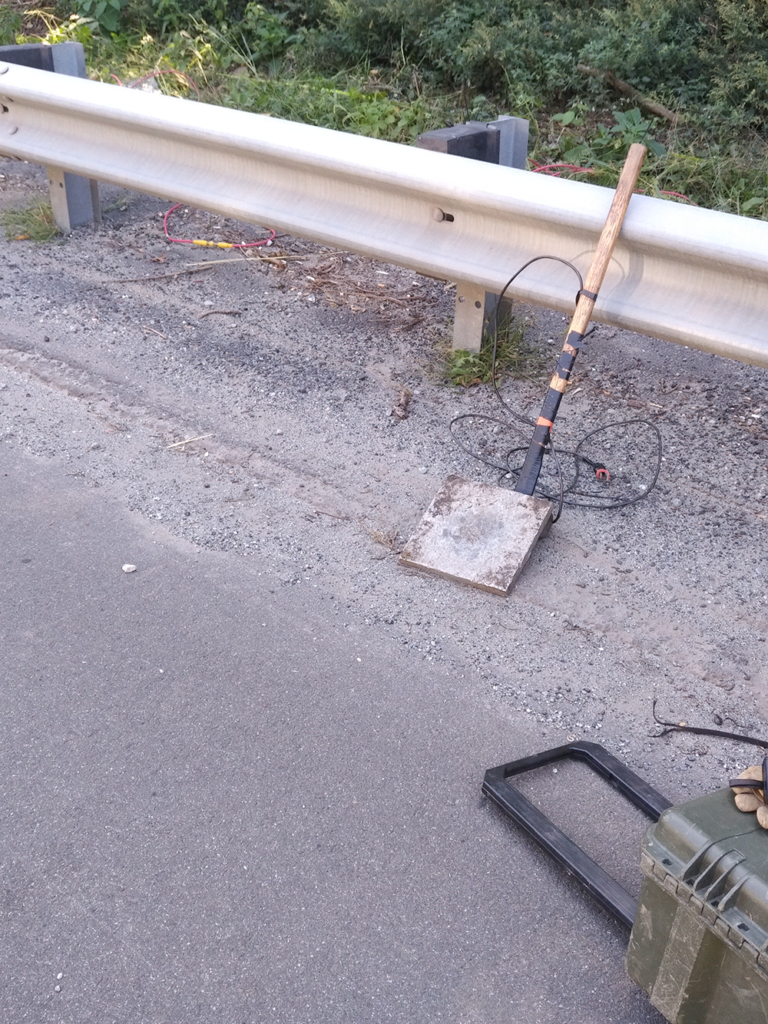
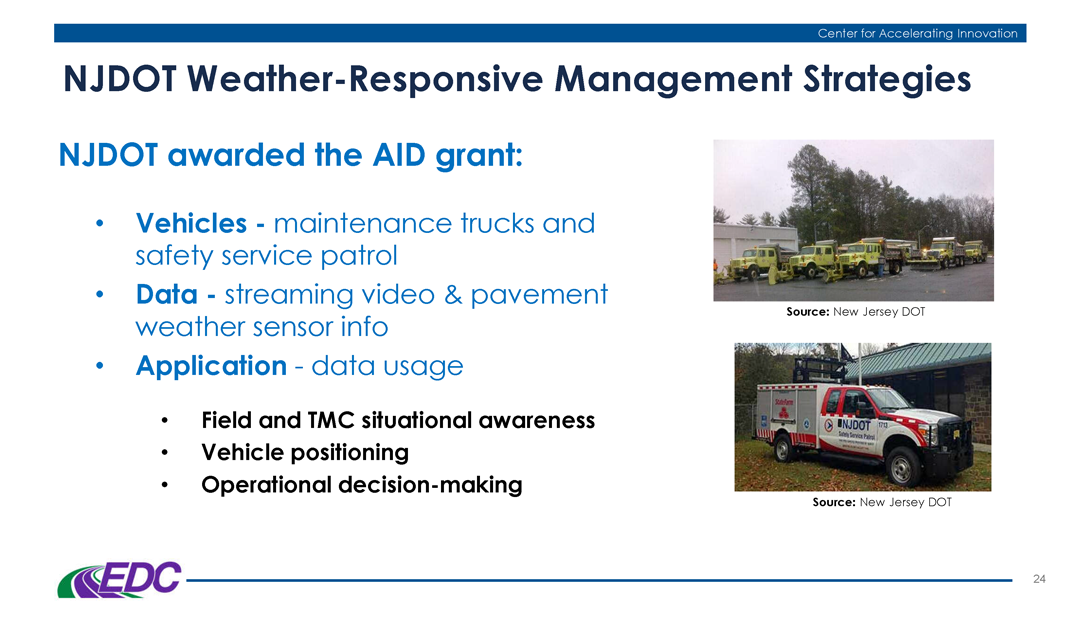
Tools of the trade: sledgehammer, striking plate, and sensors are used to measure seismic vibrations through soil
Transportation projects typically use soil borings to collect soil samples, which are then tested in labs to determine the soil properties (e.g., water content, water depth, soil type, etc.) that will inform project design and construction. A-GaME techniques supplement soil borings and can more accurately identify obstructions, bedrock, and other soil conditions that could cause construction delays. They can also detect more subtle changes in soil conditions than conventional bore holes or penetration tests.
Q: Which of these methods has NJDOT used? Have they been successful?
Each A-GaME method yields benefits. The key is to find the right method for each project. NJDOT has utilized A-GaME methods in the preliminary design and design phases of several projects. In these projects, the results of the exploration have benefited project design and construction. Some of the more prominent examples of NJDOT’s use of A-GaME include:
- Seismic Piezocone and P-S seismic logging techniques for the Pulaski Skyway seismic retrofitting of foundations. Consultants used these techniques in their site-specific seismic response analyses to derive shear wave velocity correlations and discover the various layers and depths of fill, organics, sands, clays, glacial till, and bedrock composition. This information allowed the engineers to determine how to retrofit each foundation to withstand a seismic event.
- Mapping talus deposits – that is, collected rockfall piles – over bedrock on Route 80.
- Microgravity surveys have been used in mine investigations. Northern New Jersey has several abandoned mines, and these surveys have provided safer and more complete methods to map and assess the structural integrity of these mines and inform remedial strategies.
- Seismic methods were also used on another project near the Delaware Water Basin to measure the depth of talus deposits. Seismic activity was monitored from the road vibrations and the waves were measured at various points around the deposit to determine the locations of voids and the pile’s overall depth.
- Mapping of rock joints for bridge foundation design along Route 4. Mapping the locations of the fractures in the rock allowed the design team to place the bridge foundations in structurally sound locations based on the competency of the rock mass. The process assisted in determining the long-term stability of the rock mass, the rippability (ease of excavation) and constructability of the mass, possible excavation angles, and the potential need for additional support.
- Bathymetry Survey has been used in waterways upstream and downstream of structures on navigable waterways to provide river bottom elevation cross sections. This technique was used on the Pulaski Skyway project to reveal images of debris that had fallen off ships into the Hackensack River and could present issues during construction of the proposed foundation seismic retrofitting. The information saves time and money in the construction phase by alerting contractors to obstructions that will need to be removed.
- Geophysical explorations have been used for finding shallow surface and river bottom debris, utility installations, and mapping existing bridge footing configurations underwater.
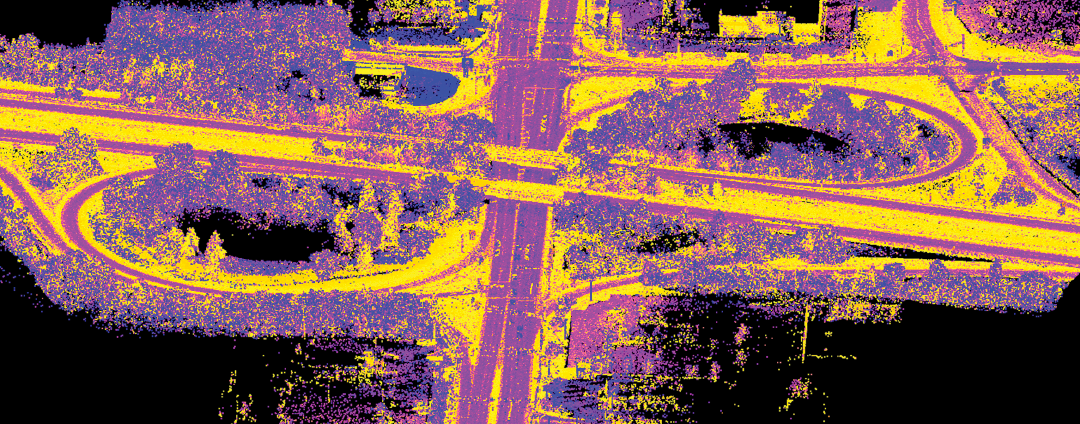
- LiDAR survey has been used for site investigation on rock faces on a few projects during design.
- Optical and acoustic tele-viewers have been used some down hole in soil borings to characterization of rock and any open voids.
- Single Station Passive Seismic Survey (SSPSS) has been used to differentiate weathered rock from bedrock using ambient vibrations. Determining the interface between weathered rock and competent bedrock is essential, whether it is for rock slope stability, excavation concerns (mechanical or blasting), or foundations. SSPSS helped determine if the top layer was comprised of weathered rock, or if the top layer was comprised of loose boulders with lots of air-space in between.
- Drones have been used in emergency situations to investigate large slope failures and to inform design on rockfall mitigation projects. On I-287, a drone equipped with a high-resolution camera was able to take photographs and videos revealing a broken drainage pipe that was contributing to erosion that required immediate remediation. This was safer and more cost effective than utilizing a team of workers to investigate. On I-280 and I-287, drones have also been used for rockface mapping and early site characterization as a design tool.
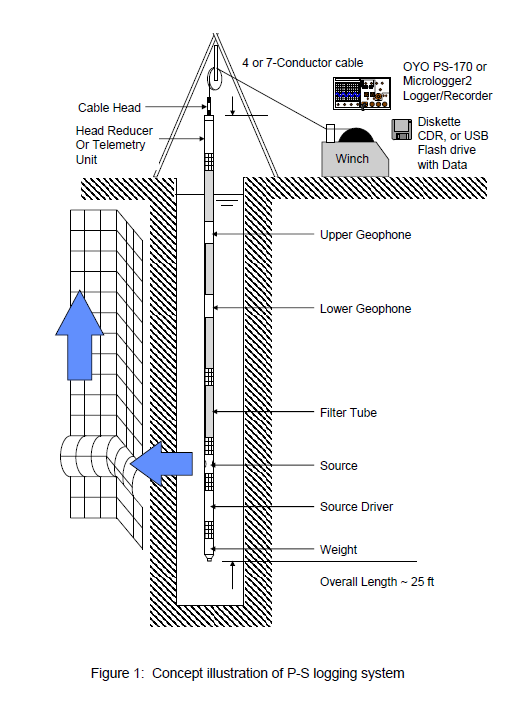
The source driver impacts the source, like a hammer striking a nail, and generates a wave. The pressure waves and seismic waves are recorded by the geophones as they travel through the fluid and soil walls.
Q: Who determines which method to use, and who does the exploration?
Our office, in collaboration with design consulting firms, determines the most appropriate new technology methods for each project. The right method is largely determined by the type of project and its location. For example, projects that cross rivers may rely on sonar, LiDAR, or tomography to assess the conditions under the water and on the river’s slopes. On the other hand, a project in the mountains may require seismic methods of subsurface exploration because the steep slopes and rocky terrain make conventional testing impossible.
NJDOT often utilizes these methods during a project’s design phase to be proactive in reducing the risks and costs associated with underground soil conditions during construction. Some of these methods are also useful in emergency situations.
NJDOT sources A-GaME work to a small group of contractors that have knowledge on how to use the highly specialized and expensive equipment required to perform the tests, and the skilled, specialty trained personnel to conduct the tests and interpret the data. NJDOT and local governments rely upon private industry contractors to perform these specialized services; in fact, the geophysical firms themselves may not own the specialty equipment (e.g., seismographs, etc.), but will rent it out as needed due to the high costs of ownership. When we develop the boring program, the prime design consultant firm will often contract with a specialty geophysical firm. Sometimes the geophysical firm will be hired by the drilling contractor.
Q: You just said that these methods can be expensive, but isn’t an important benefit of these methods to save money?
A-GaME techniques tend to have a higher up-front cost, but these methods save money over the life of a project through risk reduction. When designers, DOTs, and contractors have a better understanding of the issues that could arise due to subterranean conditions (e.g., bedrock, air voids, old storage containers, abandoned mines), the project can account for these conditions rather than discovering them during the construction phase.
In the design phase, A-GaME methods can provide information to ensure that foundations are not overdesigned, or are appropriate for rocky terrain, and can improve constructability over the life of the project – which can deliver cost savings. Overall, these techniques reduce costs associated with construction delays, change orders, and litigation.
In some environments, projects on mountainous terrain for example, the cost of soil borings can be very high to mobilize equipment, so supplementing borings with geophysical techniques brings the project cost down.

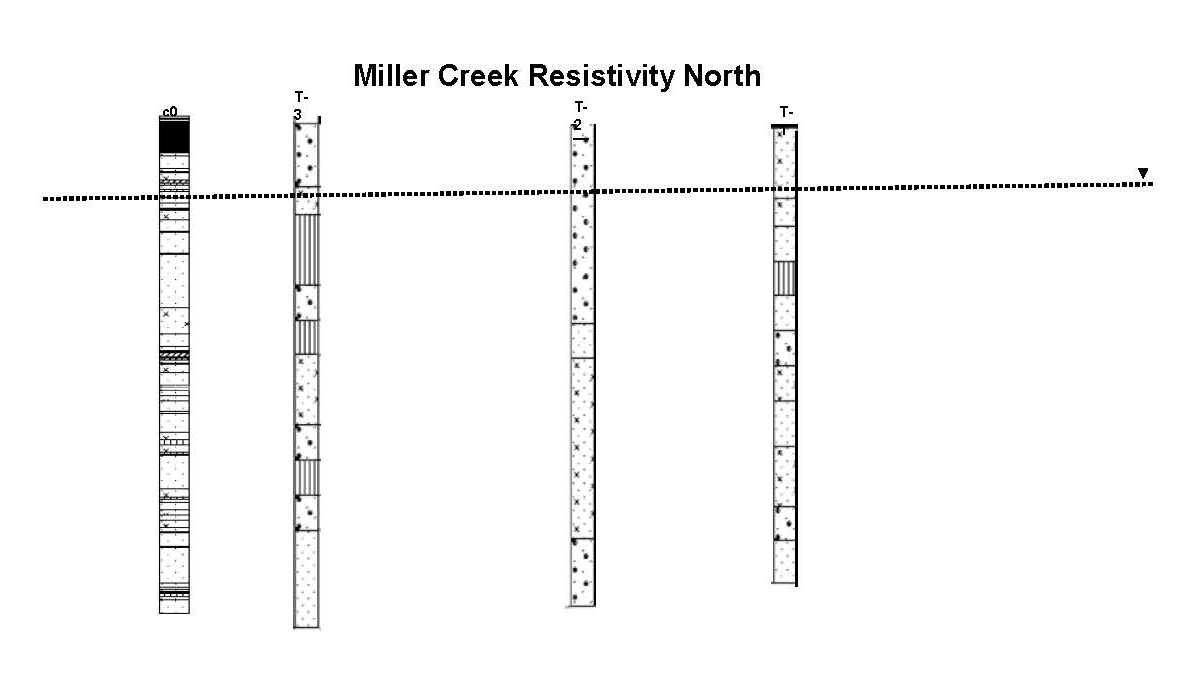
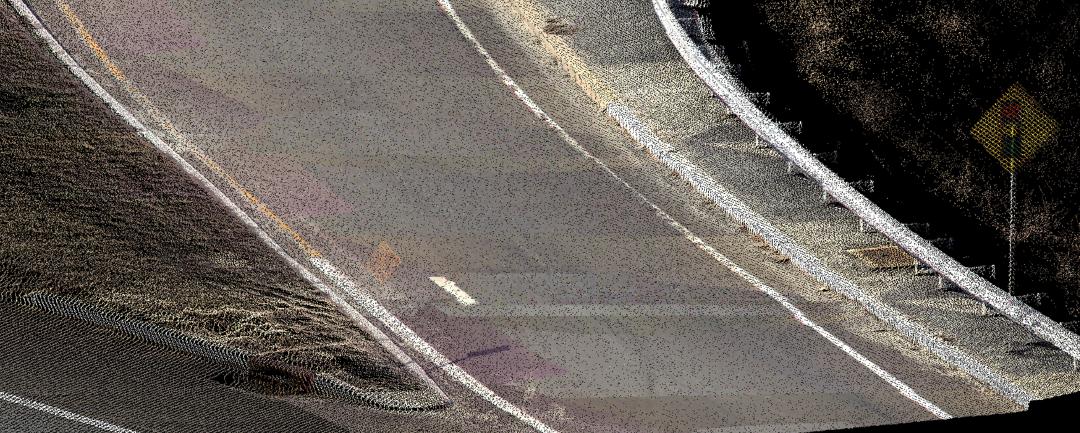
The information about soil known by traditional boring methods. Source: Minnesota DOT
Q: What knowledge, skills, and abilities are needed to advance the use of A-GaME at NJDOT?
Delivering the specialized equipment, skills, and education needed for A-GaME are currently outside the capabilities and day-to-day responsibilities of NJDOT’s Geotechnical Engineering Department. Testing methods are complicated, and the resulting data often require the analyst to have a PhD in Geology. The degree of specialization warrants the need for outsourcing the work to specialty contractors who would regularly perform these functions and hone their expertise. Engineers entering the profession would not necessarily have had sufficient exposure to these techniques at the undergraduate level.
However, NJDOT staff have been going on-site when the specialty contractors perform work on NJDOT projects to learn more about these methods and climb the learning curve. When DOT staff have more knowledge about the methods, the odds of advancing their use in future projects increases.
Q: What are some challenges to A-GaME’s deployment?
From an engineering perspective, all of the design firms need to become aware that there are lots of methodologies available to analyze and obtain soil and rock properties for better, and sometimes more efficient and cost-effective, designs of our foundations and rock slopes. We work with firms of varying capacities including some less experienced firms with little awareness of the methods. There are also some firms that would be interested in implementing these services on select projects, but until recently were not sure that NJDOT was open to their use, such as for rock work.

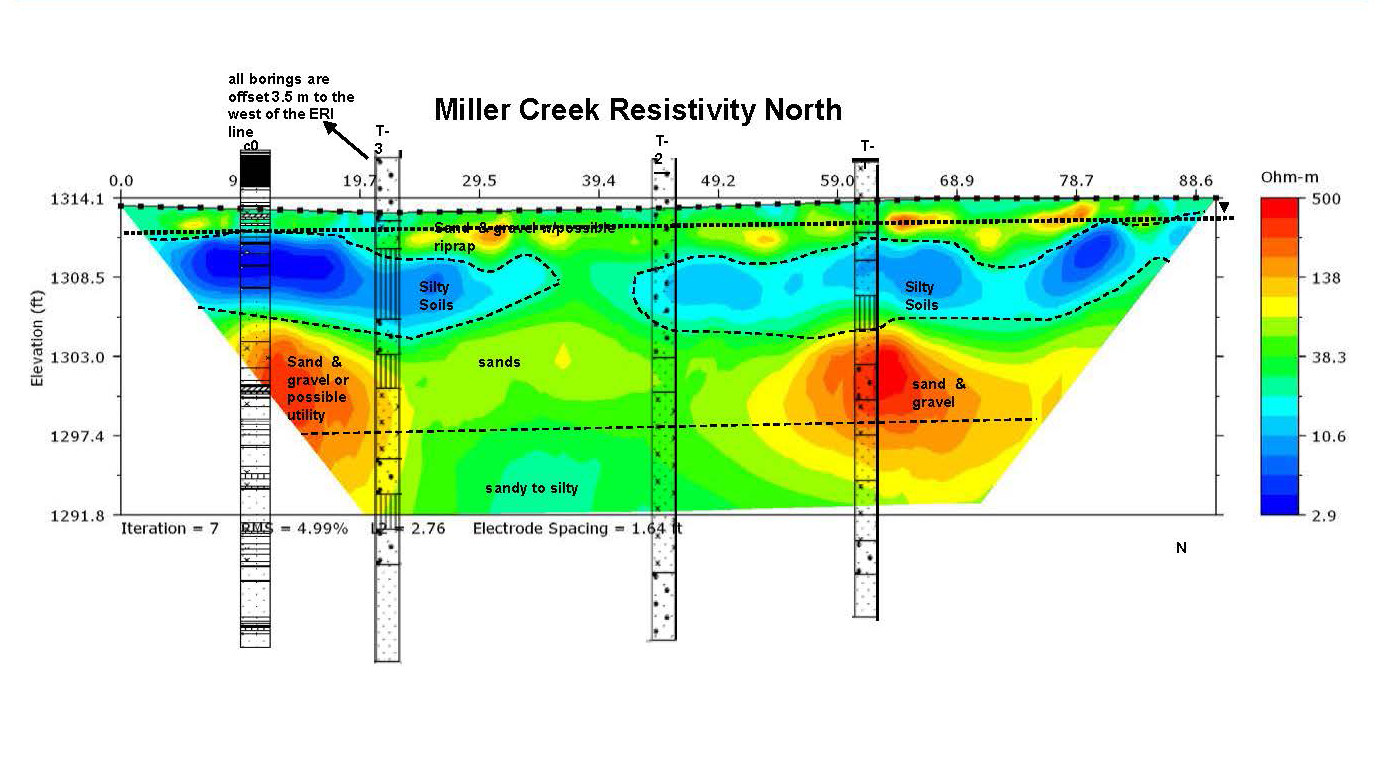
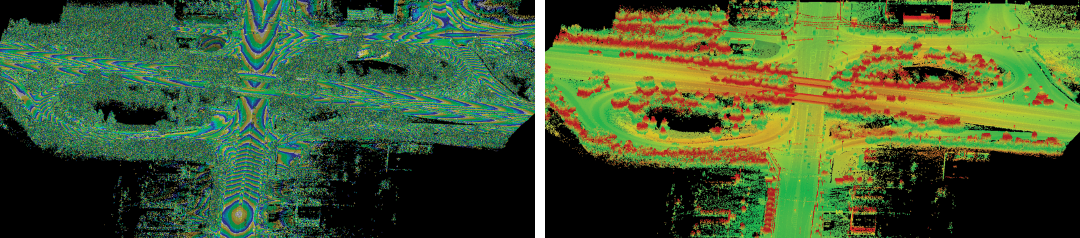
Information provided by ERI imaging is much more thorough. Source: Minnesota DOT
NJDOT project management teams also can be resistant to spending the extra up-front money for this type of testing and analysis. Soil boring drilling contractors do not want to work in tandem with geophysical firms because they have to wait for the firms to get out there and complete their work; for example, there are peripheral costs and scheduling uncertainties related to use of optical or acoustical televiewer work. The drilling contractors do not want to be idle while the geophysical work is being performed. They want reliability as to when work will be completed so they can quickly move on to the next job. So, we have found that fewer drilling contractors may actually bid on the job if they have to work in tandem or accommodate the geophysical firm services. This can drive the bid costs up.
Q: What are the next steps for A-GaME?
NJDOT and most other DOTs are still learning about A-GaME methods and their applications. The next step for NJDOT’s adoption of A-GaME is to continue to spread knowledge of these methods and encourage their use to supplement traditional boring techniques.
NJDOT’s Bridges and Structures Design Manual is being updated and, as part of the revision process, Geophysical Testing has been added to the new Sections 25 and 26. While FHWA still must review these and other revisions to the Manual before it is made available to the public, the inclusion of A-GaME in the manual should eventually increase the awareness and use of these innovative methods among consultants. New innovative techniques are being added in the subsurface contract language as well.

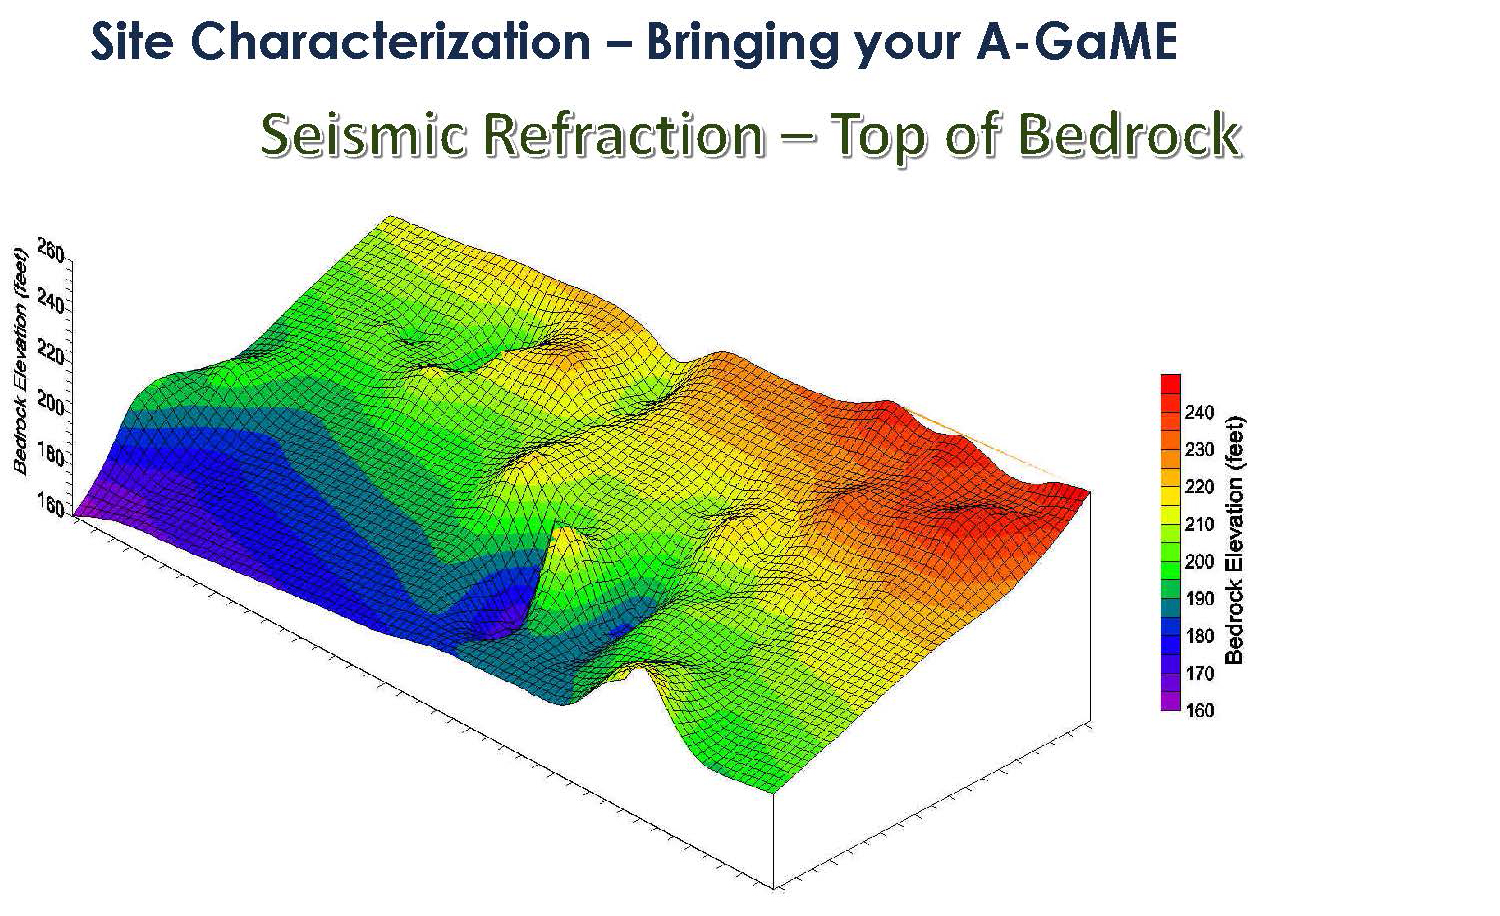
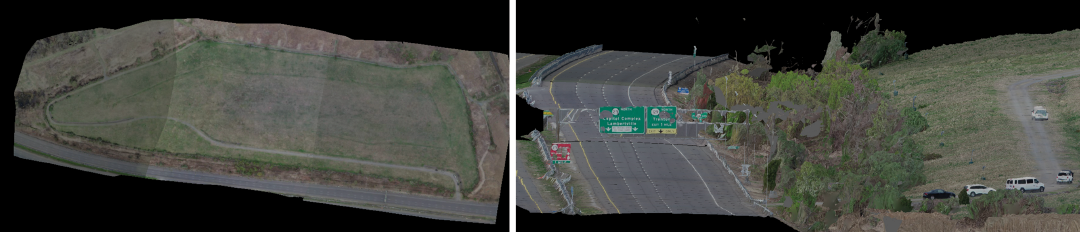
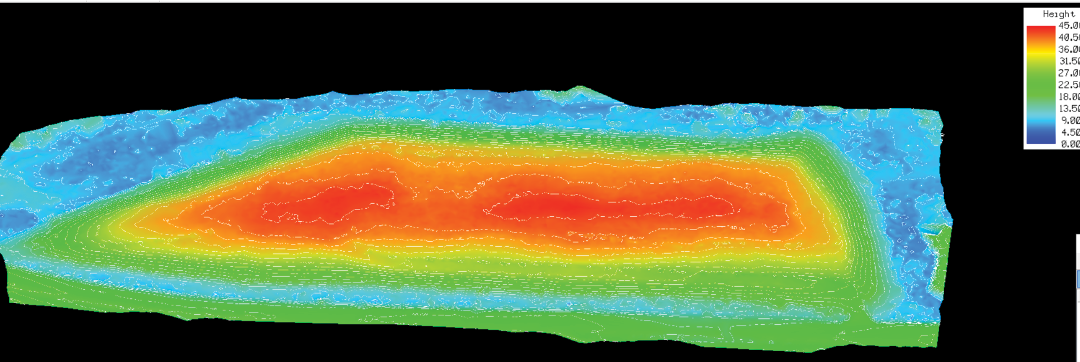
Knowing where you will encounter bedrock is very helpful for excavation or drilling. You cannot get a complete picture such as this from bore samples. Courtesy of Jeff Reid, Hager-Richter Geoscience, Inc.
NJDOT is encouraging designers to learn more about these methods and to seek approval for their use when designing NJDOT projects. NJDOT’s geotechnical team anticipates that, with familiarity, project managers will support additional funding for A-GaME during the design phase and use within the industry will grow.
Q: Is there any other information you would like us to know about implementing the A-GaME?
These methodologies provide a wealth of information regarding soil and rock that soil borings and visual observations alone cannot provide us. These methodologies better assist NJDOT in subsurface exploration for our highway structures and rockfall mitigation projects, as well as aid in determining pre-construction constructability issues on our heavily traveled waterways.
Resources
FHWA. (n.d.) Advanced Geotechnical Methods in Exploration (A-GaME). Retrieved from: https://www.fhwa.dot.gov/innovation/everydaycounts/edc_5/geotech_methods.cfm
Kelley V.C. (1987) Joints and fractures. In: Structural Geology and Tectonics. Encyclopedia of Earth Science. Springer, Berlin, Heidelberg. Retrieved from: https://doi.org/10.1007/3-540-31080-0_56
NJDOT (n.d.). Innovative Initiative: What are Advanced Geotechnical Methods in Exploration? Retrieved from: https://www.njdottechtransfer.net/advanced-geotechnical-exploration-methods/
Palmström A. (2001). Measurement and Characterization of Rock Mass Jointing, Chapter 2, In-Situ Characterization of Rocks. Editors: V.M. Sharma and K.R. Saxen. Retrieved from: http://rockmass.net/ap/69_Palmstrom_on_Jointing_measurements.pdf
United States Geological Survey (n.d.) Geologic Units Containing Talus. Retrieved from: https://mrdata.usgs.gov/geology/state/sgmc-lith.php?code=1.5.5