The Federal Highway Administration has encouraged State Departments of Transportation to utilize Unmanned Aerial Systems (UAS), sometimes known as “drones”, to improve operations, construction, inspection, and safety by collecting data needed to design, build, and operate the highway system.
The NJDOT UAS Program has been a leader among state DOT UAS programs. Several articles and a video have already featured the program origins, equipment and training needed to build capacity, and establish “use cases” for the integration of UAS technology within various NJDOT operations. Glenn Stott, Program Manager, NJDOT Aeronautics & UAS, has been instrumental in standing up the UAS Program. In this interview, we asked Glenn to provide an update on how the UAS Program has been deployed on recent projects. Below is an edited summary of our interview and follow-up discussion.
How has the UAS Program been using its recent STIC incentive funding?
The UAS program really benefited from STIC funding at its start. The funding paid for the equipment to fly the missions and deliver regulation and procedures training to staff. Two phases of training were devoted to legal and regulatory issues, and hands-on training, common to all state agencies. The third phase was mission-specific, exploring how drones could be used for infrastructure inspections and mapping projects. The training helped us build our agency’s capacity to work with UAS, strengthen our working relationships with other state agencies, and raise our awareness of regulatory compliance issues.
We received a second round of STIC funding to pay for equipment, but the Buy America program requirements have been a challenge to procuring equipment. When we were defining our specifications for the new equipment, we were looking at technical capabilities, not national origin. We have also tried to stay with software similar to what we already have used for training and standardization purposes.
Can you tell us how the UAS Program has functioned on NJDOT projects?
At NJDOT, our divisions are new to UAS and have their own methodologies that have been successful for decades. We have to find ways to merge our methodologies with theirs and assure them of a high level of success before they will agree to employ UAS.
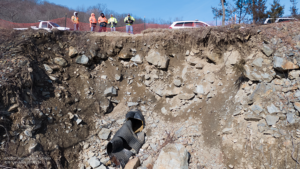
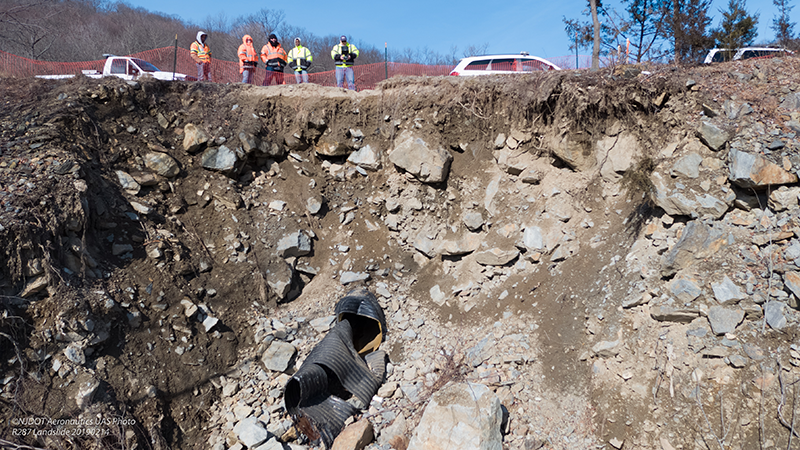
UAS Team in the field exploring the damage from rockfall along I-287
UAS has played an in-house consultant role on many projects, including several rockfall projects. There are 400 rockfall areas along NJ roadways. NJDOT’s Geology and Capital Program Management (CPM) have been working diligently to analyze the areas and come up with viable solutions and prevent incidents. We flew 49 different sites along Route 15 to gather rockfall data and supported several projects along I-80.
I think we were particularly effective on the I-80 project in the vicinity of the Delaware Water Gap, a national park. Outside consultants were unfamiliar with federal regulations, and the National Park Service (NPS) representatives were concerned about the use of drones on park property. We are not able to fly a drone from national park property. In this case, the drone was taking off from, and landing on, state property next to the highway. Although the NPS had no formal authority over airspace in this case, we wanted to be good neighbors and address any concerns they might have, particularly related to wildlife areas, and elicit their help in developing the mission profile. With our regulatory experience and knowledge of aviation laws, we developed a mission profile that complied with regulations and was acceptable to all parties. A consultant flew the mission and we were onsite.
Along I-80, we had particularly challenging conditions in which to work. In this case, the road has three lanes in each direction with a concrete median, no ditch and no right of way, and rock walls on both sides of the road. We do not fly over active roadways. We had to shut down the left lane in one direction and fly from the left lane. We knew this work had the potential to create road congestion and a distraction for drivers. We coordinated with our NJDOT Bureau of Safety to come up with a flight plan, a take-off and landing area, position of staging vehicles, and plan for support of safety vehicles. These types of projects take a lot of coordination. A consultant flew the mission but NJDOT UAS staff were on site. Although we want to be in the forefront of UAS development, we do not want to risk safety. The Department needs to be comfortable with the comprehensive process of developing the mission profile.
For NJDOT Multimodal, we have assisted with a number of rail projects funded through our rail freight assistance grants program. We fly our own UAS for project management to document existing conditions pre-construction, monitor during construction, and document post-construction to show how taxpayer money has been used. One project, about six months ago, was an NJDOT grant to work with Conrail on the Waverly Loop rail construction project. The Waverly Loop is intended to allow trains to reverse direction by following a teardrop track.
Conrail could not find a consultant to fly the project. The location is challenging as it lies across the NJ Turnpike from Newark Airport and was in the front yard of the state prison, and involves several environmental, wind, and traffic concerns. We needed to coordinate with the FAA [Federal Aviation Administration], but we are familiar with their concerns and have operated in Newark Class B airspace many times. The agency has a Certificate of Authorization (COA) with all controlled airports in the state as well as with the Philadelphia International Airport. In this case, we also needed to coordinate with the NJ Department of Corrections. We need to know the players and the regulations. On this project, NJDOT was the consultant and our UAS staff flew the project. We had to ensure that the mission profile and plan met regulatory requirements, the restrictions of the COA, Conrail and Multimodal objectives, and kept all the parties satisfied and informed. We are just one piece of making the project come together.
We have done a lot of work with the NJDOT Office of Maritime Resources, for pre-, during, and post-construction on dredging and other projects. Recently, we flew drones to make sure pipelines were not disturbed during construction in the marshlands near Atlantic City. We also had to prove compliance with NJDEP wetland restrictions when electrical poles were placed by helicopter in this area because dozers and heavy equipment cannot be used.
How has UAS been used for transportation planning and environmental projects?
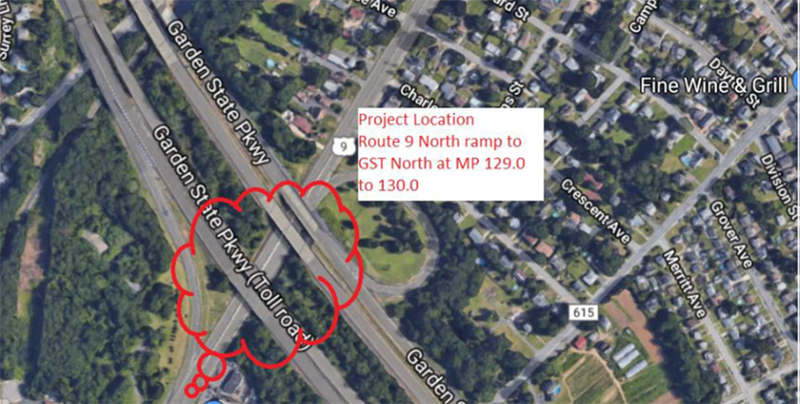
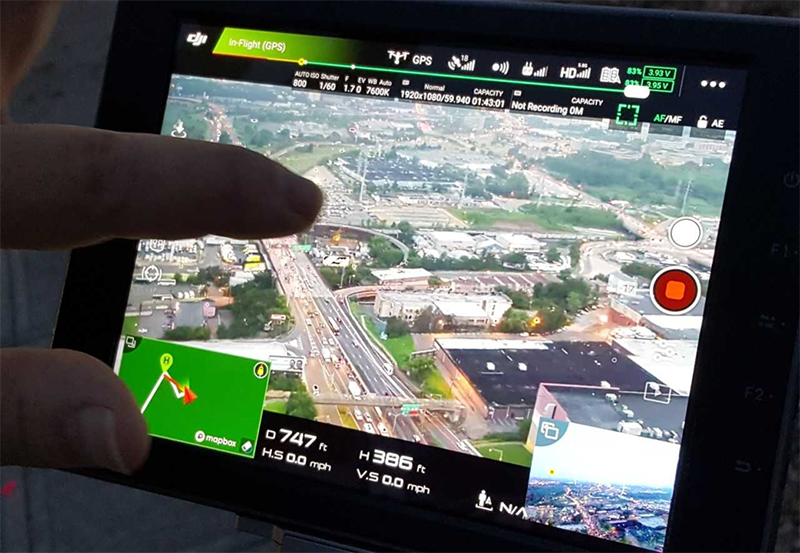
Drones were used to inform a Concept Development Study of traffic congestion on Route 9 Northbound at the ramp to the Garden State Parkway
Two years ago, we worked with construction project management to help them address congestion along Route 9 at the entrance to the Garden State Parkway North to address commuter complaints. Usually, a crew would go out to the site to monitor traffic flow over a period of time. We scouted locations for take-off and landing and suitable vantage points to capture images of the entire road segment. We sent two drones up to take video footage. Reviewing the video, the project management team could quickly determine the source of the congestion. The project manager appreciated that the “eye in the sky” saved a lot of time in determining the problem, and the video helped to explain the issue to contractors and NJDOT supervisors.
We still need the right equipment to demonstrate how drones can support bat counts under bridges. There are nine species of bats in the state that are either federally-protected or state-protected. DEP regulations state that we cannot interfere with them during certain life stages such as migration and hibernation. Coordination with US Department of Fish and Wildlife and NJ Division of Environmental Protection was needed to address concerns about the potential negative effect of drones on the bats. We had to take a course with NJDEP and US Fish and Wildlife before participating in this use case. Bats wedge themselves deep within the cracks under the bridge. Our current drones could not get close due to proximity sensors, and illumination was insufficient. Cameras need to get relatively close to the bats and have good illumination to get quality photography. We have held two field trips to determine if the noise of the drone rotors would bother the bats and see what kind of photos we could get. We discovered that the rotor noise was nothing compared to traffic noise. With the second STIC grant we hope to purchase equipment to improve illumination and image resolution, and allow us to get closer to the bats.
How many NJDOT staff from other divisions have been trained?
Ten staff members have been trained, and one of those has left. Only UAS program staff actively fly the missions, but trained staff members from other units have flown missions with UAS staff. Although they do not fly frequently enough to be current and proficient, their knowledge of the UAS program helps their divisions with use case development – for example, in Traffic Management, CPM, and Multimodal. The intent of the STIC-funded training was to leverage our knowledge into the divisions. For example, when we confront a traffic issue for a project, I draw on the trained personnel in the traffic division to bring their colleagues into the conversation. They are our champions for the integration of UAS technology.
With our COAs, we are required to have night training. With the regulations and procedures grant, we developed a NJDOT night-training video. We developed a PowerPoint training presentation with audio presented in a video format to be delivered to NJDOT UAS pilots. Not only initial training, but recurrent training is needed to renew certification and keep current. We have no active night missions with NJDOT at the moment but would like to do training missions in order to be prepared for an emergency response.
In our trainings and interactions with the divisions, we stress the importance of pre-flight preparation and coordination. A violation of regulations or inadequate coordination could set the program back years and other state DOT programs as well.
Have there been challenges to aspects of the program due to COVID-19?
Aeronautics is currently understaffed with one of three inspector positions filled. I am the Program Manager for both Aeronautics and the UAS program so I am busy. The pandemic has affected our operations. In particular, coordination is more difficult without face to face meetings.
To what do you ascribe the success of the program?
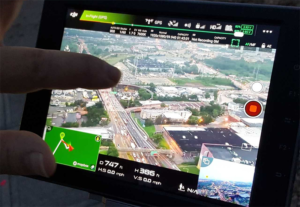
For the I-495 project, live stream videos from drones were shared with traffic operations and command posts to assess traffic congestion during construction
Lots of other state DOTs have UAS programs with more funding, resources, and staff but NJDOT’s program has been more successful because of our drive, determination, our champions, and relationships. The champions in NJDOT divisions have worked hard to successfully integrate UAS into their programs.
We have the confidence and experience to collaborate with federal agencies and other state agencies including FAA, airports, Secret Service, Homeland Security, NJ Department of Corrections, and state parks. During the Route 495 project, we had to deal with presidential temporary flight restrictions in Class B airspace. We had the confidence and the relationships with agencies, including Secret Service, to get through roadblocks. Homeland Security loaned us a staff person and a vehicle for several weeks to help support the Route 495 project. It is a collaborative effort; they bounce ideas off of us and we off of them.
Other state UAS programs have not pursued the relationships with these agencies or with divisions within their agencies. We coordinate with NJDEP, for instance, for filming the NJDOT Winter Road-E-O which is held in a state park. We cannot take off and land in state parks but we can work with the state park to align our objectives with their requirements and regulations. Maritime missions in state parks are difficult to coordinate. However, with our contacts and our awareness of their concerns, we can streamline some of the approvals and fly the missions within the timelines we are given. The relationships are intangibles but a big part of the success of the NJDOT UAS program.
Resources
Drone Technology at NJDOT (Video resource)
Drone Program Takes Off in Bureau of Aeronautics
Drone Program Reaches New Heights, Seeks to Go Higher
EDC-5 Initiative: Unmanned Aerial Systems
NJ STIC Mobility & Operations: Unmanned Aerial Systems (UAS) Fact Sheet
FHWA EDC-5 Innovative Initiative: Unmanned Aerial Systems (UAS)
Unmanned Aerial Vehicle (UAV) Peer Exchange at NJDOT
Spotlight on Innovation: Unmanned Aerial Systems (UAS) High Mast Light Pole Inspections Comparative Analysis (Infographic)