Communicating Transportation Findings and Plans: Charts, Renderings, and Interactive Visualizations

In November 2018, the NJDOT Bureau of Research hosted a half-day Tech Talk event, Data Visualization in Transportation, that highlighted recent research and examples of innovative data visualization methods used by state DOTs and MPOs.
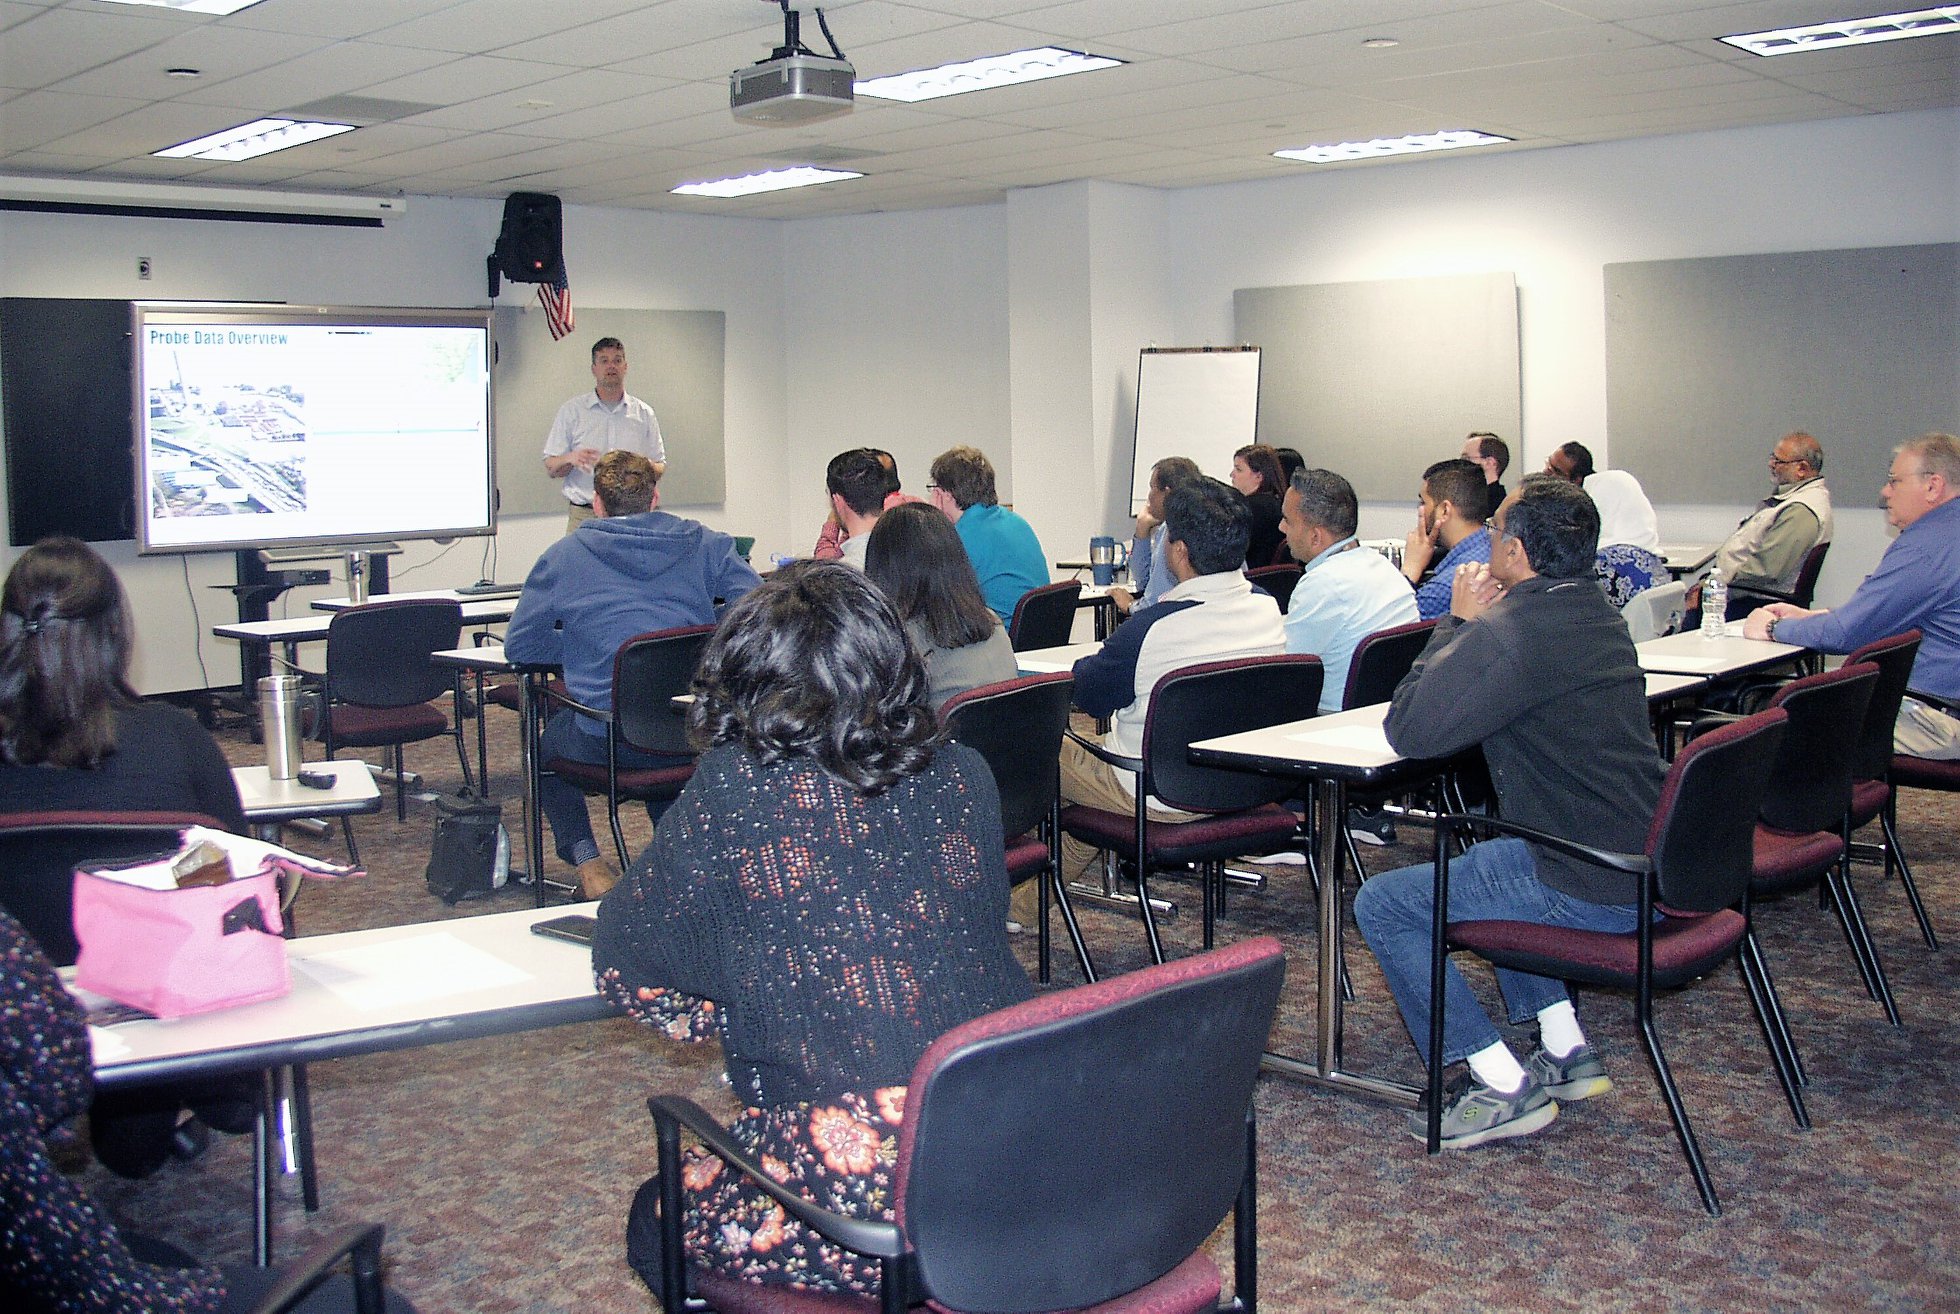
The NJDOT Bureau of Research hosted a half-day Tech Talk event that highlighted research and featured innovative examples of data visualization methods in use by transportation agencies. Five speakers discussed tools and resources that they use to create visualizations to connect with target audiences, and to provide information to their constituencies. Select visualization tools in use by New Jersey's MPOs and innovative best practices being deployed at other State DOTs were featured. Registration was full for the event which was held in the NJDOT Multipurpose Room on November 29, 2018.
Data visualization includes such applications as modeling, animation, simulation, and virtual reality. In 2006, through draft guidance for implementing provisions in the Safe, Accountable, Flexible, Efficient Transportation Equity Act: a Legacy for Users (SAFETY-LU), FHWA required states and Metropolitan Planning Organizations (MPOs) to use visualization techniques in the development of transportation plans and programs to promote improved understanding on the part of the public, elected and appointed officials, and other stakeholders. Visualization applications allow planners, designers and engineers to communicate complex multidimensional information in a way that is comprehensible to a general audience in order to facilitate collaboration, resulting in more informed decisions, fewer delays, and more buy-in at each step of the design and project implementation processes. Visualizations can also improve understanding of the project among planners, designers, and engineers, improving cost effectiveness.
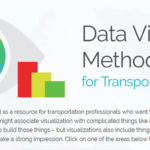
The first speaker, Nathan Higgins, is the author of Data Visualization Methods for Transportation Agencies, the summary document from his research conducted for the National Cooperative Highway Research Program (NCHRP). Mr. Higgins’ presentation, “Data Visualization in Transportation: NJDOT,” discussed that written report and the associated website that provides guidance for the visualization process. He navigated the website to show examples of visualizations for transportation applications, chart types and software tools available, and data and style resources. He emphasized the importance of each visualization as a critical opportunity to communicate information, and noted that, although intensive work with data requires a specific skill set, visualizations are possible to create without elaborate tools and software.
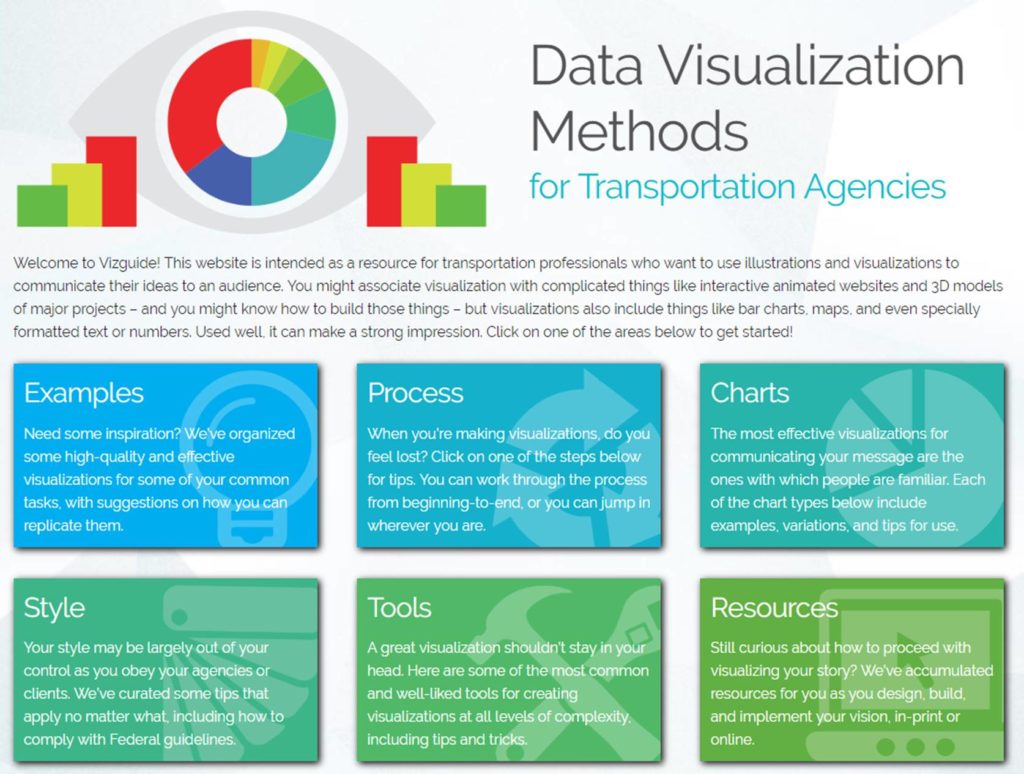
Nathan Higgins, author of the NCHRP Report, Data Visualization Methods for Transportation Agencies, shared examples of effective visualizations used by state DOTs and other transportation agencies. The project website is an informative resource for transportation professionals interested in honing their skills in communicating ideas to an audience through illustrations and visualizations.
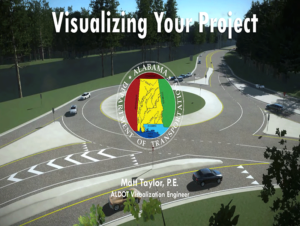
Attendees learned how such tools and best practices can be used to foster more effective involvement with the public and an agency's various customers. In his presentation, “Visualizing Your Project,” Matt Taylor, PE, Alabama DOT described various visualization methods, with an emphasis on reality mesh, renderings, photomatching, and animation to create 3D environments that bring transportation projects to life. He noted that 80 percent of Alabama DOT’s data visualizations are used at public hearings to help stakeholders understand projects and how they will fit into the community. He provided several examples, including one of a Divergent Diamond Interchange which creates a traffic pattern that is unfamiliar to most drivers. He developed a visualization that helped to explain the new traffic flow. He noted that visualizations can provide models for contractors to use in planning, and can be useful for catching design problems. In response to a question, he noted that there are often multiple conceptualizations over the design life of a project, for example, to present all the alternatives for a transportation project, and the details needed to support a preferred alternative, or to model the construction stages.
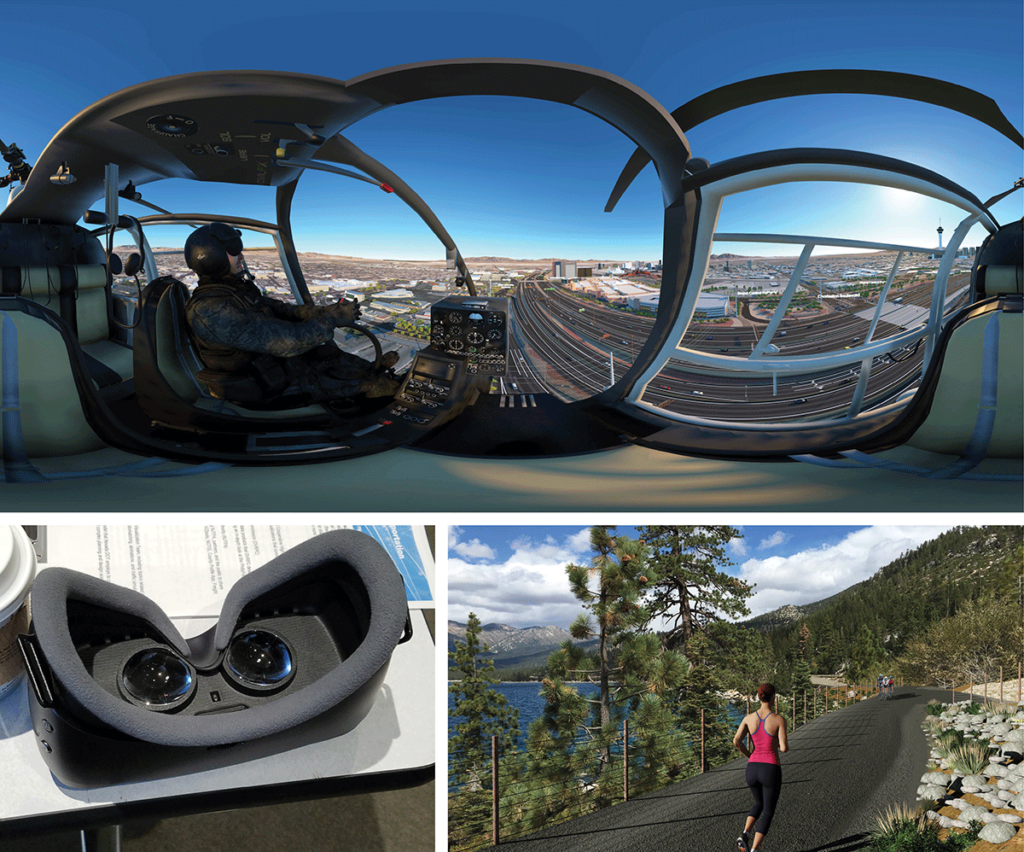
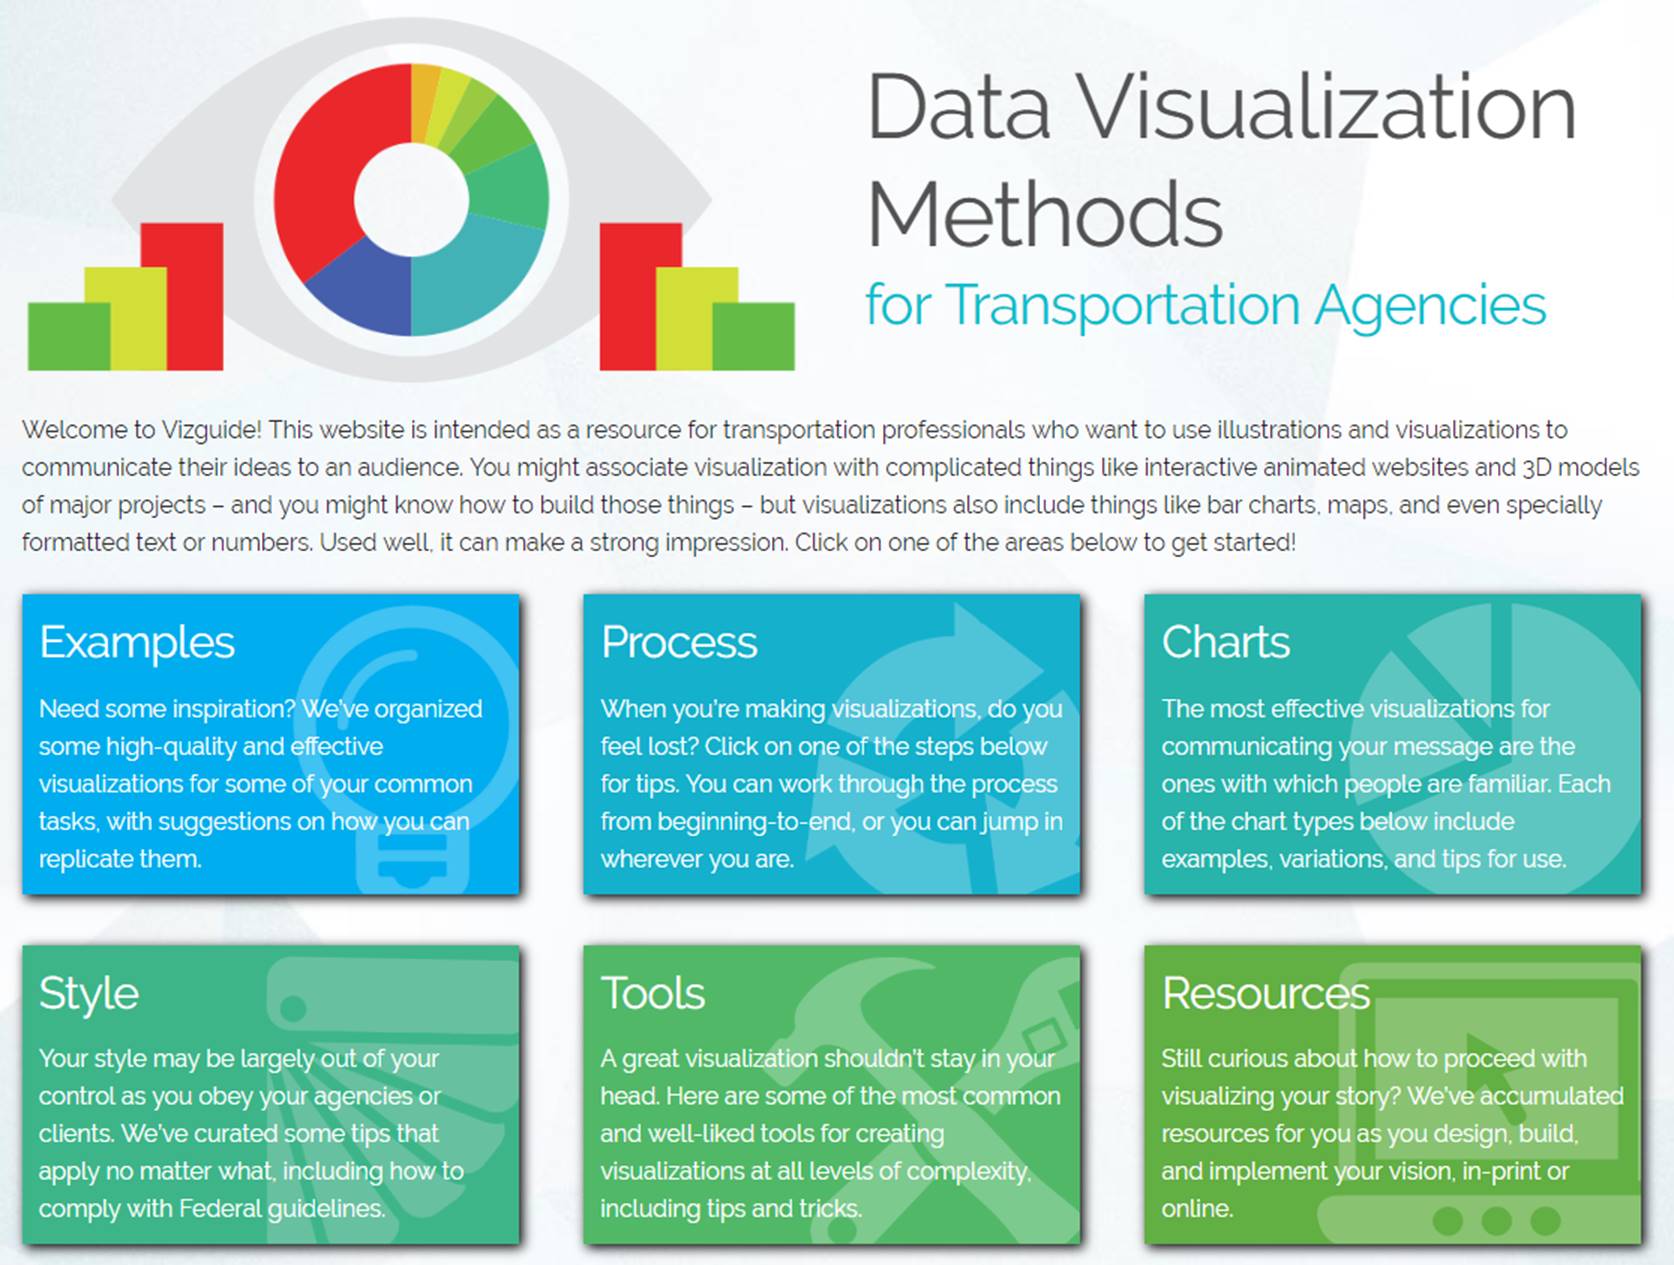
Nicholas Johnson from Nevada DOT explained how visualizations, including virtual reality simulations, are being used to build awareness and foster support by illustrating how completed projects may function and be experienced by affected communities.
Nick Johnson, PE, PMP, CPM, Nevada DOT presented on “Interactive Visualization,” which he described as an emerging, virtual-reality-based mode for visualizing transportation projects. The Interactive Visualization innovation is a peer-selected focus innovation for the AASHTO Innovation Initiative, which seeks out proven advancements in transportation technology to accelerate adoption by agencies nationwide. Mr. Johnson discussed the value of this technology for assisting interested parties in understanding a transportation project during the public engagement process. His agency’s outreach events have featured simulations and virtual reality. Mr. Johnson gave an example of a Native American community that was concerned that a noise wall would block the rising sun from their view, preventing them from knowing the time for worship. The visualization alleviated the community’s objections by demonstrating that the sunrise would not be blocked by the wall. He emphasized the importance of visual communication to Millennials and GenXers.
In response to questions about the cost of creating visualizations, the speakers responded that cost depends on the project location, complexity, and the detail required to communicate needed information to the target audience. Speakers noted that their agencies have two to three full-time employees to work intensively with data to create databases and visualizations. A small Complete Streets project that is not very complex may take two weeks to finish and larger transportation projects may require multiple visualizations over the course of the planning and construction stages. Mr. Johnson’s public involvement events have offered an opportunity to use a driving simulator and Virtual Reality goggles, available through a contractor, to help immerse stakeholders in the experience of a proposed project.
Representatives from two of New Jersey’s Metropolitan Planning Organizations spoke about the data visualization tools that they have created and made available to local agencies to assist in planning. In his presentation “Web Maps, Open Data, and more!,” Christopher Pollard, Delaware Valley Regional Planning Council, described the data that the MPO has compiled for use in making regional planning decisions. He underscored the importance of accurate and reliable geospatial data as the basis for visualizations, and the MPO’s use of ESRI GIS mapping software to communicate this data. He discussed the datasets and interactive maps available to all the agency’s constituents, and provided detail on Travel Monitoring and Philly Freight Finder. He mentioned that the initial development of the data required a significant investment of time in order to make the data accessible. He added that the MPO will take on a limited number of data visualization projects needed by their constituents.
Gabrielle Fausel, North Jersey Transportation Planning Authority presented on “Data Visualization in Transportation: GIS and Planning Tools at NJTPA,” and discussed NJTPA’s use of five visualization tools: ViZtools illustrates the various factors that support the Regional Transportation Plan; NOTIS shows how state and federal tax dollars are being invested in the transportation system in the NJTPA region; Freight Activity Locator provides an overview of goods movement activity in the region; County Profile Application, a mapping tool, provides county-level demographic data for the region; and Open Data Portal, which supplies publically available geospatial data. Ms. Fausel emphasized that the MPO made use of ESRI software that they had already purchased for other applications.
These speakers noted that they are always working to make the visualization process more efficient and enjoyable for the user. In response to an audience member’s question about how they deal with a tool that has incomplete or fuzzy data, they noted the need to: constantly update the data to look for the most complete information and to identify gaps; assess the data for reasonableness; request user feedback and provide references and disclaimers; and create visualizations of uncertainty in data. Before a tool is released to the public, there is internal testing, and a pilot test with a small external group. This is an iterative process, with trying and testing to develop useful tools.
Please see below for the presentations, as well as several simulation videos and links to data products that were presented during the event.
Resources
AASHTO Innovation Initiative, Interactive Visualization.
Alabama Department of Transportation Visualization Group.
Cambridge Systematics, Inc. Data Visualization Methods for Transportation Agencies.
Presentations

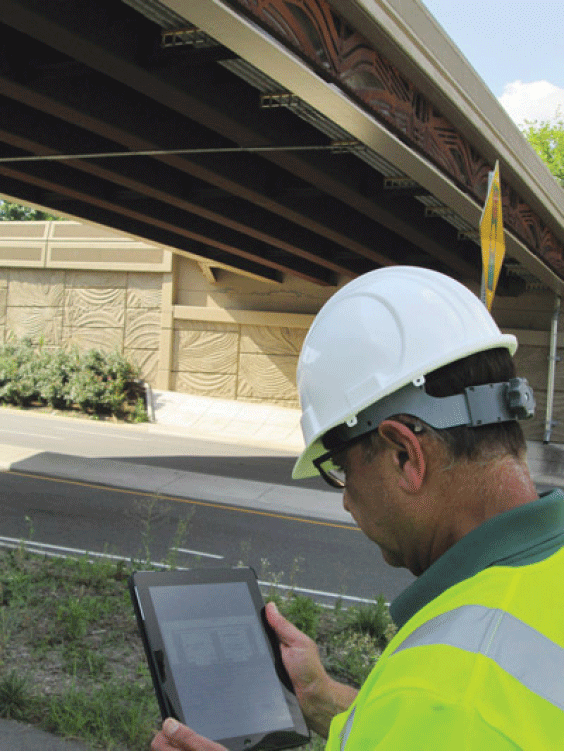 In FY2017, the NJ STIC recommended that a STIC Incentive Funding grant be used for the purchase and the piloting of the use of the tablets for construction and work zone inspections.