Make Your Mark

Safety Voyager

Project Screening

Data-Driven Safety Analysis

Pavement Friction Surface Treatments

A Municipal Perspective


NJDOT is investigating a powerful set of tools to more effectively manage New Jersey’s roads and highways. The agency has been piloting a study of Safety Analyst, a software package used by state and local highway agencies to identify highway safety improvement needs and projects for funding. The New Jersey State Transportation Innovation Council (STIC) applied Federal Highway Administration’s STIC Incentive Program funding to purchase the Safety Analyst license and service units from AASHTOWare. Following the kickoff and first year, NJDOT has continued to fund the project through FHWA’s Highway Safety Improvement Program (HSIP).
![]() According to AASHTOWare, Safety Analyst helps agencies “proactively determine which sites have the highest potential for safety improvement, as opposed to reactive safety assessment done conventionally” (SafetyAnalyst.org). The software automates procedures and assists agencies to implement the six main steps of the highway safety management (HSM) process—network screening, diagnosis, countermeasure selection, economic appraisal, priority ranking, and countermeasure evaluation. Safety Analyst features four tool modules to perform the six HSM steps:
According to AASHTOWare, Safety Analyst helps agencies “proactively determine which sites have the highest potential for safety improvement, as opposed to reactive safety assessment done conventionally” (SafetyAnalyst.org). The software automates procedures and assists agencies to implement the six main steps of the highway safety management (HSM) process—network screening, diagnosis, countermeasure selection, economic appraisal, priority ranking, and countermeasure evaluation. Safety Analyst features four tool modules to perform the six HSM steps:
A detailed explanation of the benefits and capabilities of these four modules can be found in a series of white papers available from AASHTOWare.
![]() After receiving funds for Safety Analyst, NJDOT began a pilot study in Burlington County using the software. The objective of this study is to determine a methodology for meeting statewide goals. Items under review include implementation methodology (i.e., the manner and locations of data collection) and the resource requirements (i.e., the time, effort, and cost of implementing the software). NJDOT plans to use the software to more efficiently allocate its resources, time, and funds to improve the state’s roadways. Previously, NJDOT screened roads by identifying equivalent property damage, based on average frequency and severity of crashes and, depending on the project list, other factors such as annual average daily traffic and bicycle/pedestrian generators. Using Safety Analyst, NJDOT anticipates identifying needed road improvement more comprehensively using additional variables, such as roadway volume and characteristics, driveway density, and lane widths.
After receiving funds for Safety Analyst, NJDOT began a pilot study in Burlington County using the software. The objective of this study is to determine a methodology for meeting statewide goals. Items under review include implementation methodology (i.e., the manner and locations of data collection) and the resource requirements (i.e., the time, effort, and cost of implementing the software). NJDOT plans to use the software to more efficiently allocate its resources, time, and funds to improve the state’s roadways. Previously, NJDOT screened roads by identifying equivalent property damage, based on average frequency and severity of crashes and, depending on the project list, other factors such as annual average daily traffic and bicycle/pedestrian generators. Using Safety Analyst, NJDOT anticipates identifying needed road improvement more comprehensively using additional variables, such as roadway volume and characteristics, driveway density, and lane widths.
According to NJDOT Bureau of Transportation Data and Support’s Peter Brzostowski, who is working with the Bureau of Data and Safety, the agency is exploring other innovative ways to gather data for Safety Analyst. Leading ideas include:

State transportation departments and partner educational institutions can use Safety Analyst. At least eleven U.S. states have Safety Analyst licenses—Arizona, Illinois, Kansas, Kentucky, Michigan, Missouri, Nevada, New Hampshire, Ohio, Pennsylvania, and Washington, as well as Ontario, Canada. Some examples of its use include:
The Safety Analyst software tool requires access to a minimum set of data elements including roadway segment characteristics, intersection characteristics, ramp characteristics, and crash data. Agencies or institutions that do not have the ability to collect the minimum data will not be able to utilize Safety Analyst.
According to AASTHOWare’s project manager, Vicki Schofield, the states that have been part of the Highway Safety Improvement System, a multi-state database that contains crash, roadway inventory, and traffic volume, typically have sufficient data resources to utilize the Safety Analyst software. She noted, however, that “all states should be using Safety Analyst or something as robust and researched.” She offered that Safety Analyst is an ideal tool to begin to evaluate the data, even if a state has not completely collected the system data.
Ms. Schofield explained that to implement Safety Analyst effectively, states should work in partnership with other state and federal agencies to assign roles and responsibilities and leverage expertise and capacity. For example, the state transportation planning office can be used to collect roadway and attribute data; the state enforcement office (i.e., Division of Highway Traffic Safety in New Jersey) to compile crash data; the state IT office to manage secure access to databases; and the FHWA division office to connect the state agencies with other resources.
With the Safety Analyst tool, a state will be able to efficiently perform highway safety management—a data-intensive and statistically complex process—to better predict long-term levels of safety at various locations. The tool supports more effective decision-making and provides justification for expenditures of Highway Safety Improvement Program funds, resulting in greater benefits for New Jersey residents and drivers from every dollar invested.
According to Ms. Schofield, the cost for purchasing the software is relatively minor and the primary barrier to implementing Safety Analyst is the time it takes to ready the data-intensive tool for use. Regional or local universities may be able to help expedite implementation by performing tasks that a transportation agency cannot and to help ensure integrity of the tool.
The NJDOT Bureau of Transportation and Support reports that work on the Safety Analyst Pilot Study is almost complete. The Pilot Study is expected to provide information on areas that need to be addressed when developing a full scale contract for the implementation and development of Safety Analyst on a statewide level. The goal will be to maximize the benefit of Safety Analyst to NJDOT and to provide the necessary structure for a sustainable future for the program.
AASHTOWare. 2010. SafetyAnalyst: Software Tools for Safety Management of Specific Highway Sites:
Brzostowski, P. 2017. AASHTOWare Safety Analyst. Presentation to the New Jersey State Transportation Innovation Council. Winter Meeting.
Harwood, D. W., Torbic, D. J., Richard, K. R., & Meyer, M. M. 2010. SafetyAnalystTM: Software Tools for Safety Management of Specific Highway Sites. FHWA-HRT-10-063. Turner-Fairbank Highway Research Center.
LiSanti, D., and C. Trueman. 2018. CIA Safety Team. Presentation to New Jersey State Transportation Innovation Council. Summer Meeting.
LiSanti, D., and K. Skilton. 2018. CIA Safety Team. Presentation to New Jersey State Transportation Innovation Council. Fall Meeting.


Across the country and in some New Jersey municipalities (at least 50 in the last six years), road diets have been implemented as a low-cost safety countermeasure for motorists and non-motorists alike by reducing travel lanes, vehicle speeds and freeing up space for bicycles and pedestrians. Road diets are recognized by the Federal Highway Administration (FHWA) as one of twenty “Proven Safety Countermeasures” to reduce serious injuries and fatalities on American highways and roads.
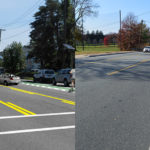
According to the FHWA, a road diet most commonly involves converting an existing four-lane undivided roadway to a three-lane roadway consisting of two through lanes and a center two-way left-turn lane.
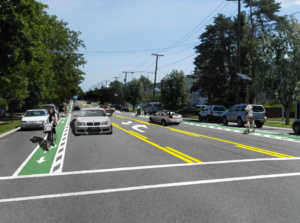
Digitally-enhanced photo shows potential changes for Livingston Avenue in New Brunswick. From Costs and Benefits of a Road Diet Conversion, 2015.
Implemented across the US for at least two decades, road diets have become standard practice and increasingly widespread as their benefits, including economic development, have become popularized. Studies indicate a 19-47% reduction in overall crashes when a road diet is installed on a four-lane undivided facility. For some roadways, these improvements have reduced crashes by up to 70% (See Reston, Virginia case study).
In New Brunswick, a partial road diet has been installed on Livingston Avenue, prompted by concerns expressed by many residents in 2014 when three children in a crosswalk were struck by a vehicle. There are plans for a complete road diet in the future. According to the Middlesex County Engineer’s Office, the project is currently obtaining federal aid and state approval to begin work. This road diet was supported by a cost-benefit evaluation that found the benefits of safety improvements would overwhelmingly exceed the costs over a 20 year period.
In Burlington City, NJDOT implemented a road diet on Route 130 to create a buffer for vehicles and pedestrians after many years of work with local officials. For six consecutive years, the Tri-State Transportation Campaign named Route 130 as the state’s most dangerous road for walking with 11 pedestrians killed by vehicles between 2012 and 2014. These hazardous conditions particularly affected students, who had to cross the divided highway to get to Burlington High School. The death of 17-year old Antwan Timbers, a sophomore at the school, inspired classmates to fight for safer streets around their school and state with the “25 Saves Lives” campaign, which advocated for legislation to reduce speed limits to 25mph near school zones along Route 130. The road diet reduced the roadway from six lanes to four lanes. Large “School Speed Limit 25mph” signs and “No Turn On Red” signs were also installed at busy intersections. Additional improvements are planned for the spring of 2018.
Passaic County’s road diet in Wayne has resulted in reduced dangerous crashes.
In Woodbury, NJDOT converted Route 45, a multi-lane roadway into a road with one travel lane in each direction, a left turn lane and bicycle lanes. According to the FHWA, the roadway was plagued with excessive speeding, improper lane changes, parking difficulties, and safety concerns. The road diet succeeded in reducing crashes and vehicle speeds while helping pedestrians feel safer. The improvements had no negative effect on emergency vehicle response times, which had been an initial concern of the Woodbury Police.
Passaic County has been active in installing road diets on several of their oversized suburban throughways. In 2016, case study research examined more closely the approaches that the County had taken and explored the lessons that they learned and some outcomes of implementing successful road diet projects. For 2018, the County is working with the North Jersey Transportation Planning Authority to bring road diets to three additional corridors – including narrowing a roundabout.
In Ewing, NJDOT and Mercer County and other local partners are conducting a study to identify and recommend improvements to make Parkway Avenue, near NJDOT headquarters, a safer corridor. Parkway Avenue was one of two corridors (out of 99 potential locations) identified as a feasible, suitable and beneficial location to implement a road diet in NJDOT’s 2015 Road Diet Pilot Program. The public may keep up to date and share input on the Parkway Avenue Safety website.
See more information on how road diets work, the benefits they provide, and New Jersey case studies: