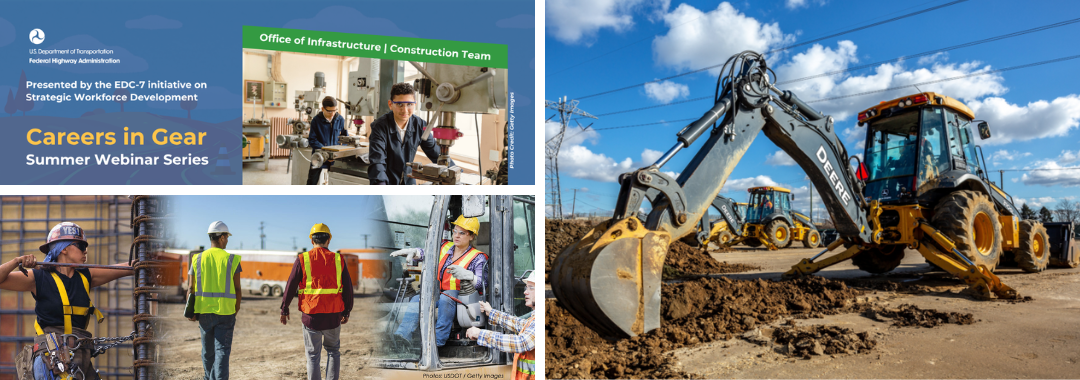
WEBINAR: 2023 Build a Better Mousetrap Competition National Winners

The Federal Highway Administration’s Local Aid Support team in the Office of Transportation Innovation and Workforce Solutions will be holding a national webinar on October 19, 2023 for those interested in learning more about this year’s winning entries in the 2023 Build a Better Mousetrap National Recognition Program for Transportation Innovation.

Winners were announced at the National Local and Tribal Technical Assistance Program Association’s Annual Meeting in Columbus, Ohio this summer. New Jersey’s “Route 71 Over Shark River Road Diet” was this year’s Bold Steps Award Winner in the national competition.

Build a Better Mousetrap celebrates innovative solutions for challenges that local and tribal transportation workers encounter. These innovations can range from the development of tools and equipment modifications to the implementation of new processes that increase safety, reduce cost, and improve efficiency of our transportation system.

Gerald Oliveto, P.E., from the New Jersey Department of Transportation will give a presentation about the Route 71 bridge rehabilitation and road diet project. More information about this award-winning project, recipient of this year’s “Bold Steps” Award, can be found here and here.

Mr. Oliveto will be among the presenters during the national webinar. Below is a full list of the 2023 BABM Award recipients during the webinar.

Innovative Project Award“The Mobile Unit Sensing Traffic (MUST) Device” – a device specifically designed to monitor traffic, detect dangerous events, and provide real-time warning messages to users along rural roads. Presenter: HollyAnna Littlebull, formerly Confederated Tribes and Bands of the Yakama Nation. Associate Director of the Northwest Tribal Technical Assistance Program (TTAP) Center, University of Washington.

Bold Steps Award – “Route 71 Over Shark River Road Diet” – a road diet project that preserves an old historic bridge while improving safety and saving money. Presenter: Gerald Oliveto, New Jersey Department of Transportation

Smart Transformation Award – “Solar-powered Remote Cameras” – providing more accurate and immediate information on road conditions that assists with emergency response while requiring less maintenance. Presenter: Matthew Beyer, St. Louis County, Minnesota, Public Works Department

Pioneer Award – “Safe Sightings of Signs and Signals (SSOSS) Software” – an automated process for identifying and addressing obstructed traffic signals saving time and money while increasing data accuracy. Presenter: Matthew Redmond, City of Walnut Creek, California

Registration – The national webinar is scheduled for Thursday, October 19, 2023, 2.00 PM and 4.00 PM Eastern. The FHWA has provided this link to learn more about the BABM Award winners event and receive a Zoom Government Meeting link to access the event.

WEBINAR: Traveler Information and Traffic Incident Management: Crowdsourcing Course

Since 2019, the FHWA Every Day Counts (EDC) Innovation, Crowdsourcing for Advancing Operations, has been supporting the adoption of crowdsourced data and tools to advance transportation operations across 35+ States and their local agencies to improve traffic incident, road weather, work zone, traffic signal, traveler information, and emergency management, along with a host of other ITS and TSMO practices.

The Crowdsourcing Innovation Team in collaboration with the ITS Joint Program Office (JPO) Professional Capacity Building (PCB) Program delivered this introductory Crowdsourcing course, one in series of webinars, featuring State and local practitioner perspectives.

On July 18, 2023, Sal Cowan, NJDOT’s Senior Director of Mobility served as one of the course instructors for Traveler Information and Traffic Incident Management, the third session in a webinar series targeted to transportation professionals with an interest in or responsibility for the management and operations of roadway systems. Mr. Cowan delivered instruction on how crowdsourcing can be used to enhance traveler information. He shared examples of how some leading state transportation agencies (e.g., Virginia, Arizona, Kentucky, Pennsylvania) are using various crowdsourcing platforms for communicating traveler information. Mr. Cowan then spoke at greater length about New Jersey’s Travel Information Systems, highlighting the state’s initiatives for Commercial Vehicle Notifications, 511 Platforms and Voice Assistant Systems, and Crowdsourced Data, among other topics.

Mr. Cowan was joined by two other featured speakers and the event’s host, Ralph Volpe, EDC-6 Crowdsourcing Program Co-Lead, who moderated the capacity-building webinar.

Vaishali Shah, AEM Corporation, Support Lead for the FHWA EDC-5/6 Crowdsourcing Innovation, gave an introduction to the Traffic Incident Management topic and described the components and challenges of State and local TIM systems. She shared several examples of how crowdsourced data is being used to enhance Traffic Incident Management (TIM) around the U.S..

Mr. Cowan explained the rationale for crowdsourcing to improve traveler information and shared examples of how its being used in select states, including New Jersey.
Ms. Shah explained how crowdsourcing applications were being used to enhance TIM and shared some examples of innovative state and local deployments nationally.

John Parker, Pennsylvania Turnpike Commission (PTC), Senior Traffic Operations Project Manager, then described the PTC’s Traffic Incident Management and Traveler Information initiatives. In his talk, he described various examples of data-sharing providers and partnerships, touching upon technology platforms, dashboard features, operating challenges, and new partnering opportunities being considered by the PTC and the state of Pennsylvania to enhance crowdsourcing for TIM and Traveler Information.

More information on this webinar training event can be found here, including a recording of the webinar, the presentation, transcript, and the question and answers that closed out the training event.

AASHTO Technical Service Program Transportation Curriculum Coordination Council (TC3) Trainings

The Transportation Curriculum Coordination Council (TC3)'s mission is to develop and maintain a quality training curriculum to enhance the competency of the nation's transportation Construction, Maintenance, and Materials technical workforce. TC3 is a state-based initiative adopted as a Technical Service Program within AASHTO.

The TC3 Online Video Library contains playlists of instructive videos on Construction, Maintenance, Materials and Traffic and Safety. TC3 has a library of more than 250 online training modules covering a variety of topics in the three primary disciplines.

TC3 helps states, local government, and industry save money at a critical time of infrastructure investment through course development, web-based trainings, information, and resource sharing that is available at substantially reduced cost. The TC3's website has additional resources available here about AASHTO's Techical Services Program.


Lunchtime Tech Talk! Webinar: Advanced Reinforced Concrete Materials for Transportation Infrastructure

On July 10th, the NJDOT Bureau of Research hosted a Lunchtime Tech Talk! webinar, “Advanced Reinforced Concrete Materials for Transportation Infrastructure.” Welcoming remarks were given by Mansi Shah, Manager of the Bureau of Research, who turned over the session to its moderator, Omid Sarmad, a member of the NJDOT Technology Transfer Project Team. The presentation was conducted jointly by the Co-Directors of New Jersey Institute of Technology’s Materials and Structures Laboratory (MATSLAB), Dr. Matthew Bandelt, and Dr. Matthew Adams.

Researchers described the durability issues for concrete including corrosion, shrinkage, salt scaling, and freeze-thaw cycles.

Transportation infrastructure systems must resist conditioning from the natural environment and physical demands from service loading to meet the needs of users across the state. Deterioration leads to costly and timely durability and maintenance challenges. This presentation provided a background on the state-of-the-art of advanced reinforced concrete materials that are being investigated to improve reinforced concrete transportation infrastructure. The duo, both Associate Professors at the New Jersey Institute of Technology, spoke about the team’s research conducted to assess the mechanical properties and long-term durability of these systems.

Dr. Bandelt opened the presentation with an overview of the MATSLAB where the work was conducted, and the motivation which led to the project. The demand for the research was initiated by the various durability issues that exist in concrete, in particular corrosion, shrinkage, salt scaling, and freeze-thaw cycles. These issues are exacerbated in New Jersey due to the climate and the large-scale adoption of concrete throughout the state. A variety of different concretes were evaluated in the project, such as Ultra-High Performance Concrete (UHPC), Engineered Cementitious Composite (ECC) and a Hybrid Fiber Reinforced Concrete (HyFRC), each having its own unique mechanical properties.

Researchers described a multi-physics time-dependent modeling framework that considers the structural response, materials ingress and electrochemical reactions.

The experimental testing program involved mechanical testing, corrosion testing, testing in freezing environments, and shrinkage testing. Corrosion testing of ductile and normal concrete systems used a chloride ponding test method with exposure to an aggressive environment for over one year. Various steel reinforcing bars were studied, and systems were tested in uncracked and pre-cracked conditions. Freeze-thaw and salt-scaling experimental activities were conducted, using mixes that were commonly used by NJDOT. Drying shrinkage behavior of the ductile and normal concrete systems was also investigated. Dr. Bandelt and Adams developed a numerical modeling approach to simulate the corrosion behavior of ductile concrete systems to understand the long-term performance. The results of the durability testing showed that UHPC had the best performance across the board, and that ductile concrete systems had improved durability.

The professors then described their life-cycle cost modeling methodology, which was completed to assess the costs of a representative bridge-deck made with normal reinforced concrete. There are primarily two ways to evaluate service life; experimental evaluation which describes the physical testing of materials is accurate and intuitive, while numerical evaluation is more cost efficient, time efficient, and more easily extrapolated to various scenarios. There are gaps however in numerical modeling, mainly the lack of inclusion of cracks, corrosion behavior, and boundary conditions. The team sought to develop a framework to simulate the long-term durability of a select group of materials under the combined effects of mechanical loading and environmental conditioning.

The research showed that their framework was effective in service life evaluation, and that most importantly, UHPC bridge deck experienced slower deterioration under the same traffic load and environmental conditions. The reinforced UHPC beams and reinforced UHPC bridge decks exhibited excellent resistance to chloride penetration and corrosion propagation according to the modeling results. The structural deteriorations of the reinforced UHPC systems were also significantly slower compared to that of reinforced normal strength concrete systems. The study also showed that chloride induced corrosion performance is affected by the initial damage pattern, which depends on the structure and loading conditions. This means that it becomes important to consider the structural configuration, traffic loading conditions, and climate characteristics to assess the long-term durability of an advanced reinforced concrete system.

Afterwards, Dr. Bandelt and Adams both participated in a Q&A with the audience.

Q. UHPC seems to be advancing in the bridge industry. What are the biggest challenges looking forward on the rehabilitation of bridge decks?

A. Yes, it’s advancing quite rapidly. The FHWA has a website where you can see all the projects where UHPC was deployed, and if you plot the number of projects over time, you’ll see nearly an exponential growth. Part of that is due to the fact that there is a lot of research going on, and a lot new standards coming out. Organizations like AASHTO and ACI have released a lot of design guidance that has helped spur adaptation.

Still, the biggest challenge is getting new people used to using these design methods. As we move past some of that, I think we’ll see adoption continue to increase. UHPC may not be the right solution for every project, but there are many beneficial uses for which it will be the most appropriate tool to achieve long lasting sustainability.

Q. Regarding the resilience of concrete: Are advanced reinforced concretes better able to handle the freeze/thaw cycles that could be outcomes of climate change? If so, do you have any modeling projection to show how it fairs in comparison to regular concrete?

A. We haven’t done any specific modeling in comparison to traditional concrete in relation to climate change, but in general these systems are more resilient. They simply perform better; as you saw in our research, after 300 cycles we saw virtually no damage from freeze/thaw cycles in the system. When you see that level of performance in these accelerated tests which are quite aggressive, you can extrapolate that these advanced reinforced concretes will simply perform better.

Q. Why did the HyFRC showed much higher free shrinkage than HPC? Is the HyFRC mix design different from HPC other than fibers?

A. The mix design of the HyFRC is a bit different. One thing in particular is that even though it has those blended fibers, it has a significantly higher water to cement ratio. So because it has more water, it is a bit more prone to drying shrinkage. With UHPC that turns out to be less of a concern because it’s much stronger and is not as susceptible.

Q. Could your modeling adjust relative humidity to a more wet and hot climate in the future?

A. Yes, absolutely. The case study we looked up was in New Jersey, but we can modify that to be in any setting so you can see where it would be geographically advantageous to use certain systems.

Q. Can you explain more about the deterioration we saw in slide 66?

Video Recording of Lunchtime Tech Talk!,
Advanced Reinforced Concrete Materials for Transportation.

A. Basically what we did was look at tensile strains throughout a bridge area. The colors coincide with different levels of tensile strain. We counted up areas that were in different sections, and based on the percent area that we saw that was damaged, and we would use a multiplier to create a rating system.

To view a copy of the presentation, please click here.


Resources

Bandelt, M., Adams, M., Wang, H., Najm, H., and Bechtel A., Shirkorshidi, S., Jin, F. (2023). Advanced Reinforced Concrete Materials for Transportation Infrastructure [Final Report]. Retrieved from: https://www.njdottechtransfer.net/wp-content/uploads/2023/05/FHWA-NJ-2023-003.pdf

Bandelt, M., Adams, M., Wang, H., Najm, H., and Bechtel A., Shirkorshidi, S., Jin, F. (2023). Advanced Reinforced Concrete Materials for Transportation Infrastructure [Technical Brief]. Retrieved from: https://www.njdottechtransfer.net/wp-content/uploads/2023/05/FHWA-NJ-2023-003-TBFINAL.pdf

NJDOT Tech Talk! Webinar – Research Showcase: Lunchtime Edition 2023

On April 26, 2023, the NJDOT Bureau of Research hosted a Lunchtime Tech Talk! webinar, “Research Showcase: Lunchtime Edition!”. The event featured three important research studies that NJDOT was not able to include in the NJDOT Research Showcase virtual event held last October. The Showcase serves as an opportunity for the New Jersey transportation community to learn about the broad scope of academic research initiatives underway in New Jersey.

Video Recording: 2023 Research Showcase Lunchtime Edition

The three research studies explored issues at the intersection of transportation and the environment and the advancement of sustainable transportation infrastructure. The presenters, in turn, shared their research on the design and performance evaluation results of harvesting energy through transportation infrastructure; the properties of various materials used in roadway design treatments to effectively quantify and mitigate stormwater impacts of roadway projects; and analytical considerations inherent in estimating road surface temperatures to inform the development of a winter weather road management tool for NJDOT. After each presentation, webinar participants had an opportunity to pose questions of the presenter.


Presentation #1 – New Design and Performance Evaluation of Energy Harvesting from Bridge Vibration by Hao Wang, Associate Professor, Civil and Environmental Engineering, Rutgers Center for Advanced Infrastructure and Transportation (CAIT)

Dr. Wang noted that energy harvesting converts waste energy into usable energy that is clean and renewable for various transportation applications. Energy harvesting projects can be large scale (solar or wind energy solutions) or micro-scale (providing power for lighting, self-powered sensor devices, and wireless data transfer).

In this project, the large scale application considered the use of photovoltaic noise barriers (PVNBs) which integrate solar panels with noise barriers to harvest solar energy. His research developed energy estimation models at the project- and state-level for a prototypical design installation of noise barriers.

In his presentation, Dr. Wang focused on the micro-scale application that employed piezoelectric sensors on bridge structures. He noted that piezoelectric energy harvesting can be achieved by compression or vibration. He explained that traffic and winds cause roadway bridges to vibrate. This movement subjects the piezoelectric sensors to mechanical stresses or changes in geometric dimensions which create an electric charge.

Piezoelectric energy harvesting is affected by the material, geometry design of the transducer, and external loading. Instead of embedding sensors in pavements, the researchers sought to attach the sensors to the bridge structure imposing less impact on the host structure and increasing the ease of installation. They developed and evaluated new designs of piezoelectric cantilevers to create a range of resonant frequency to match with bridge vibration modes.

Multiple degree-of-freedom (DOF) cantilever designs were tested in the laboratory, and in full-scale tests. The goal was to customize the design to maximize power outputs resulting from bridge vibrations. Multiple cantilever design options were examined with adjustable masses. Simulation models were developed for estimating energy harvesting performance and to facilitate the optimization of mass combinations through quantitative models.

The researchers used finite element models to simulate the effect, and assessed the model in the laboratory to manage the voltage output of various designs. Bridges have multiple vibration frequencies under different vibration modes, on the bridge structure and the span. A full-scale bridge test was conducted using the Rutgers-CAIT Bridge Evaluation and Accelerated Structural Testing lab (BEAST) to give sample voltage outputs from cantilevers.

Future research will be needed to explore the effect of loading speed that takes into consideration the variable speeds on a bridge something that was not captured in the laboratory testing.

Findings of the research included: multiple degree of freedom (DOF) cantilevers can generate considerable energy when resonant frequencies match vibrational frequencies of the bridge structure; finite element modeling can predict resonant frequencies of multiple-DOF cantilevers as validated by experiments and ensures that numerical models can be used to explain the relationship between resonant frequency and mass combination for optimized design; and the proposed cantilever designs and optimization approach can be used for piezoelectric energy harvesting considering a variety of vibration features from bridges under different external conditions.

Dr. Wang responded to questions following his presentation:

Q. How far below the asphalt are the sensors placed and how often do they need to be replaced?
A. For this project, the installation in this phase used a magnetic fixture to attach the cantilever to the girder.  The installation procedure was easy for this phase.  For a field installation, we will need to consider more thoroughly the mount and durability but did not need to address this during this phase and we do not have real-world data now to share about that.

Q. Would the vibrations be amplified with the cables?
A. The cables on the real bridge – if we attached to the cable the vibrations would be less, which is why we attached them to the girder.


Presentation #2 – Impacts of Vegetation, Porous Hot Mix Asphalt, Gravel and Bare Soil Treatments on Stormwater Runoff from Roadway Projects by Qizhong (George) Guo, Professor, Civil and Environmental Engineering, Rutgers Center for Advanced Infrastructure and Transportation

Click for PDF

Dr. Guo described the effect of increased impervious coverage in urban locations that leads to increased surface water runoff. Transportation agencies are required to assess and mitigate the stormwater runoff impacts of roadway projects. The project explored the effect on runoff of use of gravel, vegetation, porous Hot Mix Asphalt (HMA), and bare soil. Areas where these materials would be used include the roadway right-of-way, medians, and beneath guiderails.

Variables explored in lab testing included subsoil hydraulic conductivity, rainfall intensity and rainfall duration. The researchers used the Curve Number (CN) method for estimating direct runoff from rainstorms. Lab testing involved a column of soil with little lateral flow and limited depth to the level representing the water table. To apply lab findings to field conditions, the regression equation of Curve Number versus the infiltration rate obtained from the laboratory measurements can be applied after replacing the laboratory-measured infiltration rate with the field-measured subsoil hydraulic conductivity or assigned hydrologic soil groups.

This research resulted in Curve Numbers for bare soil and vegetation similar to the established CNs for dirt (including right-of-way) and open space (lawns, fair condition). The estimated CNs for gravel were significantly smaller than the established CNs for gravel (including right-of-way). The research resulted in CNs for porous HMA but no comparison can be made as there is no established CN for this material. The project could help NJDOT in seeking approval of the Curve Numbers for gravel and porous HMA from regulatory agencies. In addition, the study affirmed the use of pervious surfaces and the effectiveness of stormwater runoff reduction to restore natural hydrology.

Following the presentation, Dr. Guo responded to questions asked through the chat feature:

Q. What are preventative measures to avoid porous HMA clogging?
A. Sediment source control is needed to prevent dirt and dust from entering the porous HMA. If the area around the pavement is subject to erosion, runoff carries this dirt or sand into the material. If the material becomes clogged, a vacuum is needed to clean it.

Q. Can we disperse runoff in roadway drainage systems as opposed to collection?
A. There are several ways to disperse runoff, such as by the use of rain gardens, a horizontal spreader, or use of a stone/gravel strip to spread the runoff.

Some questions were submitted in the Chat and, due to time constraints, were answered by Dr. Guo after the Tech Talk.

Q. We recently had a project meeting during concept development where we suggested porous asphalt for guide rail base. Another team mentioned they would prefer we not use PHMA due to it clogging over time and basically becoming HMA. What research has been done on PHMA effectiveness over time, and what can be done to remedy reduced flow (if it does occur)?
A: The clogging of porous hot mix asphalt (PHMA) and other porous pavement varieties is undeniably a significant and pressing issue. Our study for NJDOT did not tackle the problem of clogging, but other researchers have conducted relevant investigations, and more targeted research is anticipated. The most effective method to reduce clogging is by preventing excessive coarse sediment from entering PHMA and other porous pavements. Special care should be taken to maintain the surrounding landscape in order to mitigate soil erosion, and not to apply sand to any of the road surfaces for snow abatement. Alternatively, sediment in the runoff can be captured or filtered using a swale or gravel strip before it enters the PHMA or other porous pavement areas. Implementing a proactive inspection and monitoring system for clogging is also essential.

In cases where PHMA or other porous pavements become clogged, a vacuum street sweeper or regenerative air sweeper can be employed to dislodge and remove the solid materials. However, traditional mechanical sweepers should be avoided, as they may cause the solids to break down or force particulates deeper into the porous spaces, exacerbating the clogging issue in porous pavements.

Q. Did you use the same course stone mix in the NJDOT specs for the course stone non-vegetative surface. I assume you are calling this gravel.
A: Yes, the NJDOT construction specifications were adhered to in the design of the laboratory setup for all four land treatment types: gravel, porous hot mix asphalt, vegetation, and bare soil. These specifications can be found in the “Roadway Design Manual (2015)”, “Standard Construction Details (2016)”, and “Standard Specifications for Road and Bridge Constructions (2019)”. Comprehensive details are provided in Table 13 in Appendix A of our Final Report for the research project (FHWA-NJ-2023-004).

Q. What compaction did you use for the porous HMA?  We usually use only a small portable tamper machine in the field with about 2 passes.
A. In our laboratory, a gyratory compactor was employed for the compaction of the porous HMA samples tested. Two relevant sentences in our Final Report for the research project (FHWA-NJ-2023-004) state: “For the porous asphalt land treatment, cylindrical porous Hot Mix Asphalt (HMA) gyratory samples with a diameter of 6 in and a depth of 4 in were manufactured at Rutgers CAIT Asphalt Pavement Lab. The mix design utilized to manufacture the HMA met the requirements of the Open-graded Friction Course in the Updated Standard Specifications for Road and Bridge Construction (2007).”

Q: Can this report be used to get acceptance of porous HMA by DEP?
A: Yes, although further dialogue with NJDEP, NRCS, and other relevant agencies or organizations may be necessary for the ultimate acceptance.

Q: NJDOT Materials lab did a study of various ages of porous HMA in the field and found out that it did not clog over an 8 year period.  It appeared to be self-cleaning.
A: I appreciate the information you provided. The likelihood of porous HMA clogging is closely related to the volume and size of solids, sediment, or particulates entering it. A minimal amount of fine particulates is unlikely to cause serious or rapid clogging issues in porous HMA. To my knowledge, there is no “self-cleaning” mechanism inherent in porous HMA.

Q: What about the contamination in runoff water which will penetrate in subsoil?
A: Contaminants in runoff water should not be allowed to infiltrate the subsoil. Highly contaminated runoff must not directly enter land treatments (LTs), green stormwater infrastructure (GSI), stormwater Best Management Practices (BMPs), or stormwater control measures (SCMs). Instead, these systems will treat mildly contaminated runoff as it passes through them. Consequently, the runoff water will achieve a relatively high level of purity before it infiltrates the subsoil.


Presentation #3 – Practical Considerations of Geospatial Interpolation of Road Surface Temperature for Winter Weather Road Management by Branislav Dimitrijevic, Assistant Professor, Civil and Environmental Engineering, New Jersey Institute of Technology (NJIT) and Luis Rivera, Analyst Trainee, NJDOT Transportation Mobility, Transportation Operations Systems & Support

Click for PDF

Mr. Rivera provided background on NJDOT’s Weather Savvy Road System that addresses the need for proactive winter road maintenance and the wide variation in road conditions throughout the state. There are only 48 stationary Road Weather Information Systems (RWIS) stations across the state in areas that are deemed essential. They provide information on road conditions (wet or dry), and road temperature. The Weather Savvy Road System integrates stationary RWIS and mobile RWIS (MRWIS) to track road conditions in real time, provide data visualization to operators to inform decision-making, and assist in planning road management.

In 2017, NJDOT received a USDOT Accelerated Innovation Deployment grant for implementation of FHWA’s Every Day Counts Round 4 Weather Savvy Roads Integrating Mobile Observations (IMO) innovation. The agency deployed Internet of Things (IoT) and Connected Vehicle technology to improve road weather management. NJDOT installed sensors and dash cameras on 24 fleet vehicles to pick up air temperatures, road temperatures, surface condition, and road grip, and portable PC equipment to analyze and report this information to improve safety for the traveling public and inform decision-making. Road surface temperature is the most indicative measure of road condition.

Dr. Dimitrijevic discussed research undertaken to gather road surface temperatures using Kriging, a geospatial interpolation model. The goal was to discover a way to extrapolate the information collected from the sensors to provide estimated road surface temperatures across the entire road network within NJDOT’s jurisdiction.

The researchers collected data from RWIS/MRWIS and other data available, including land coverage, elevation, etc., that can affect road surface temperatures (RST). They sought to use a Kriging Interpolation and Machine Learning Model to give estimated RSTs over the network to inform planning and evaluation of winter road maintenance efforts. Variability in RST across the analysis region is a big factor. Researchers needed to find a function that fit the variability between the data points, and use that to estimate the parameter value at any particular point.

Dr. Dimitrijevic discussed the differences between three Kriging methods: Ordinary Kriging and Universal Kriging, the simplest and fastest to calculate; regression Kriging which uses additional factors, besides distance, that will affect RST; and Empirical Bayesian Kriging that uses Bayesian inference to calculate parameters, but also calculates the probability of making an error.

All three Kriging methods assume that for any correlation between a given parameter that you are trying to estimate in a given area, there is a relationship between the values of that parameter at different points that depends on the actual location of the points, or distance between points. The method uses the known value of surrounding parameter points, for example, the road surface temperature at these points, and measures the distance between these points of known parameter value to estimate the parameter (RST) at the unknown point. Kriging assumes a statistical relationship involving the distance between RWIS stations.

Researchers conducted case studies using RST interpolation of stationary RWIS data by driving between RWIS locations, and then expanded the RWIS coverage of mobile sensors during a winter storm event. They found the best results came from combining RWIS and mobile RWIS data. They found Regression Kriging to be helpful for including other factors (the most statistically significant being vegetation type, land cover type, distance to water, and elevation). Increasing the mobile RWIS records reduced the error level, and this finding resulted in a recommendation to increase the number of mobile sensors on NJDOT’s fleet.

Kriging was effective in capturing the spatial variation in the dataset. An error of one degree Fahrenheit still needs to be addressed. The researchers continue to look into solutions in ongoing research which will explore additional interpolation methods, integration of short-term past predictions, and a bi-level interpolation using stationary RWIS data at a regional scale and the mobile RWIS data to make adjustments to the local scale.

The model that performed best was implemented in a web-based map tool that gathers data in real time and refreshes the estimated road surface temperature every 10-15 minutes, providing a map and the ability to download data. When complete, this tool will become part of the toolbox for Operations, Maintenance and Mobility division.

Dr. Dimitrijevic answered questions following his presentation:

Q. How is the dew point and frost point measured by the sensor?
A. Dew point is not measured; there are statistical models that calculate readings of air temperature, air humidity and pressure to determine dew point or frost point. Dew point and frost point are the same thing. The term used depends on the temperature.

Q. What other interpolation models, besides Kriging, will you be looking at?
A. We are looking at a combination of machine learning and geo-statistical modeling. There is also bi-level modeling that uses one method to regress the regional scale estimate, and another to use the localized readings to adjust the estimates for a local roadway. These methods require more computation time, but we are looking for models that can calculate in real time for tactical management purposes.

A recording of the webinar is available here.


Resources

Cowan, S., Catlett., S. Ahmed, R., Murphy., T., Dimitrijevic, B., Besenski, D., Spasovic, L., and Zhao, L. (2022).  Weather-Savvy Roads Pilot Program, Final Report.  Retrieved from: https://www.njdottechtransfer.net/wp-content/uploads/2022/11/WeatherSavvy_FinalReport_20220613.pdf

Qizhong (George) Guo, Robert Miskewitz, John Hencken, Lin Zheng, Diego Meneses, (2023). Evaluation of Coefficient Related to Runoff from Roadway Projects [Final Report].  Retrieved from: https://www.njdottechtransfer.net/wp-content/uploads/2023/05/FHWA-NJ-2023-004.pdf

Wang, H., Guo, L., and Soares, L. (2023).  Energy Harvesting on New Jersey Roadways [Final Report].  New Jersey Department of Transportation Bureau of Research.  Retrieved from: https://www.njdottechtransfer.net/wp-content/uploads/2023/05/FHWA-NJ2023-001.pdf

Wang, H., Guo, L., and Soares, L. (2023).  Energy Harvesting on New Jersey Roadways [Technical Brief].  New Jersey Department of Transportation Bureau of Research.  Retrieved from: https://www.njdottechtransfer.net/wp-content/uploads/2023/05/FHWA-NJ2023-001_TB.pdf

NJ’s Saw Cut Vertical Curb Featured Innovation on AASHTO Webinar

The American Association of State Highway and Transportation Officials (AASHTO) Innovative Initiative (AII) program recognized NJDOT’s Sawcut Vertical Curb as one of seven Focus Technologies in 2022. AASHTO held a webinar on Wednesday, April 12, 2023 during which NJDOT practitioners and contractors offered their first-hand experience with implementing the saw-cutting method on their projects successfully. The innovation was also recognized as the NJ’s Build a Better Mousetrap Winner in 2022 and a video description of the innovation can be found here.

Below is a reprint of the AASHTO Innovation Initiative Page that features the Saw Cut Vertical Curb and can be accessed here.

NJDOT’s Saw Cut Vertical Curb is featured as an AASHTO Innovation Initiative.

The AASHTO Manual for Assessing Safety Hardware (MASH) establishes uniform standards for the installation of roadway safety features, including longitudinal barriers. In accordance with the recent MASH standards, the New Jersey Department of Transportation (NJDOT) has updated the installation requirements for guide rails. Per this new requirement, curbs in front of and along guide rail end terminal treatments should be limited to a maximum 2-inch exposure. The typical exposure of existing curbs is four inches. To make guide rail installation MASH compliant, the conventional practice is to remove existing curbs and replace them with 2-inch curbs. The practice typically requires seven days of field operations for the removal, replacement, and curing of concrete.  Not only does this timeframe add to labor costs, but also exposes work crews and motorists to work zone traffic for longer periods of time.

NJDOT has developed an innovative method in which the existing curbs can be saw cut to two inches in lieu of removal and replacement. The existing guide rail can remain in place during saw-cutting, while the construction crew can return at a later time to remove and upgrade the guide rail. The saw-cutting approach requires only two days of labor. The process uses a power-driven vertical curb saw fitted with horizontally-oriented, diamond-edge blades or abrasive wheels that are capable of sawing to the required dimensions without causing uncontrolled cracking. The saw is water-cooled, circular, and has alignment guides. The saw is also capable of immediately collecting the slurry produced from cutting the concrete. Traffic control in work areas requires a moving operation set up that includes channelizer barrels and drums, construction signs based on the Manual on Uniform Traffic Control Devices (MUTCD) and DOT standard details, and a truck with a mounted crash cushion.

Resources

Contact Information

Gary Liedtka–Bizuga
Senior Engineer Transportation Design Services
(609)963-2525
gary.liedtka-bizuga@dot.nj.gov

Henry Jablonski
Senior Engineer Transportation Construction Services And Materials
(973)714-1929
henry.jablonski@dot.nj.gov​​​​​​​​

Saw Cut Vertical Curb Webinar

Do you have to reduce the curb height to make the longitudinal barriers compliant with AASHTO Manual for Assessing Safety Hardware (MASH) requirements?

Join AASHTO for an information-packed webinar with New Jersey Department of Transportation on how saw-cutting is used in curb retrofitting to make longitudinal barrier installations compliant with new requirements in a safer, more cost-effective, and more efficient manner.

The American Association of State Highway and Transportation Officials (AASHTO) Innovative Initiative (AII) program recognized NJDOT’s Sawcut Vertical Curb as one of seven Focus Technologies in 2022.  More info about the about the AII award and the Saw Cut Vertical Curb innovation can be found here.

AASHTO’s webinar will be held on Wednesday, April 12, 2023 at 2:00 pm EDT.  Register HERE

NJDOT Build a Better Mousetrap winner, Sawcut Vertical Curb, is a response to a change in standards requiring existing curbing at guide rails to be reduced in height. This innovation increases safety and cost savings.

NJDOT Build a Better Mousetrap winner, Saw Cut Vertical Curb, is a response to a change in standards requiring existing curbing at guide rails to be reduced in height. This innovation increases safety and cost savings.

During this free webinar, participants will engage with NJDOT practitioners and contractors who have first-hand experience in implementing the saw-cutting method on their projects successfully.

Discussion will include:
  • Benefits of saw-cutting vertical curbs
  • Implementation considerations
  • Successes and lessons learned
  • Resources to get you started
Lead States Team Expert Presenters and Panelists

Gary Liedtka-Bizuga, New Jersey Department of Transportation
Henry Jablonski, New Jersey Department of Transportation
Peter Harry, Jr., ML Ruberton Construction Co., Inc.
Rick Berenato, ML Ruberton Construction Co., Inc.

Click to learn more about the Saw Cut Vertical Curb innovation and the New Jersey Build a Better Mousetrap program.

NJDOT Tech Talk! Webinar – Research Showcase: Lunchtime Edition 2022

On April 21, 2022, the NJDOT Bureau of Research hosted a Lunchtime Tech Talk! webinar, “Research Showcase: Lunchtime Edition!”. The event featured three important research studies that NJDOT was not able to include in the NJDOT Research Showcase virtual event held last October. The Showcase serves as an opportunity for the New Jersey transportation community to learn about the broad scope of academic research initiatives underway in New Jersey.

The three research studies focused on evaluation and testing of the performance and durability of materials and pavement for use in transportation infrastructure. After each presentation, webinar participants had an opportunity to pose questions to the presenter.


Evaluating the Potential of Using Foamed Concrete as the Insulation Layer for Pavements in Cold Regions. Cheng Zhu, PhD, PE, Assistant Professor, Rowan University, Center for Research and Education in Advanced Transportation Engineering Systems (CREATES)

In cold-weather areas, water freezes and thaws in the subgrade layer of the soil and causes weak zones in the subgrade that affect surface layer performance. These weaknesses appear as pavement surface distress and cracking. To protect the subgrade, insulating material is used.

Click for PDF

Extruded polystyrene (XPS) boards are commonly used as insulation but face deterioration over time with water infiltration, and installation is time-consuming and labor-intensive. This study looked at the potential for using foamed concrete as an alternative material. The study also looked at the methodology of selecting optimum parameters that balance mechanical strength and insulating effect. When density is low, more air bubbles provide more insulation, but more density gives higher mechanical strength.

Some of the results found through laboratory testing and large-scale testing using a soil box, include: foamed concrete with higher density has a higher compressive strength, thermal conductivity, and a lower porosity; to ensure the subgrade layer remains unfrozen, there is a minimum insulation thickness needed for a foamed concrete layer; increasing the depth of the insulation layer will achieve a better mechanical performance, while also increasing the frozen depth; and using a foamed concrete with a higher density results in a better mechanical performance.

Several questions were posed to Dr. Cheng after his presentation:

Q. What is the estimated design life with foamed concrete?
A. We did not check the timeframe of the pavement structure. We are currently working on lab tests to study the real traffic load on the pavement structure. A simulation could also be used.  This is something that we are currently working on.

Q. Were you able to find an optimal thickness and depth combination in this research?
A. We have some recommendations for the specific material used in this study. We have a design table that we can share for the foam concrete material but was not included in this presentation. We did a comparison among several insulation materials including foamed concrete, tire chips, foamed glass aggregates, and XPS board.

Q. Was the insulation box used to create the sample box replicated in the real life soil scenario?
A. We used XPS board around the sides to minimize heat transfer and to ensure heat transfer process in this test is vertical. In reality, the heat transfer in pavement is in the vertical direction.


Development of High Friction Surface Treatment Pre-screening Protocols and an Alternative Friction Application. Thomas Bennert, PhD, Rutgers University, Center for Advanced Infrastructure and Transportation (CAIT) Associate Research Professor

The use of HFST can improve surface friction in road pavements around curves to reduce lane departure crashes or on steep declines to improve braking. With HFST, hard angular stone is glued to the pavement surface in less than a ½ inch application. The aggregate of choice, calcined bauxite, is applied using epoxy. HFST must be applied to pavements in “good” or better condition (i.e. with no cracking or rutting).

Click for PDF

There can be situations where pavement appears to be in good condition, but is not a good candidate for HFST. In 2018, in studies on two county roads, overlays showed signs of premature deterioration, probably due to previously undetected issues. It was determined that a prescreening protocol was needed to determine substrate conditions before HFST is applied. The study developed an effective prescreening tool that assesses the compatibility of asphalt and epoxy. Field core samples would be used to evaluate pull-off strength and relative asphalt binder properties.

The study also explored High Friction Chip Seal as an alternative to HFST. In a case study, an asphalt-based binding system was shown to be more compatible with the pavement than epoxy resin. Aggregate from local sources proved to be an acceptable substitute and less expensive than bauxite.

Following the presentation, Dr. Bennert responded to questions asked through the chat feature:

Q. What is the life expectancy of HFST? Is it suitable for places with higher traffic volumes?
A. If a road carries high traffic volumes, it is probably designed without horizontal curves and steep declines that might require quick braking. Some areas in Pennsylvania and lower volume highways have used this application. Pavement life expectancy is debatable but generally depends more on the level of traffic volume than years in place. At around a million passes, pavement starts to show raveling, in part due to the effects of UV on epoxy, but aggregate also debonds. Applications can lose friction quickly, an aspect that we are concerned with for its safety implications as well.

Q. Is there any difference in the noise with HFST?
A. In applications using aggregates that point upwards, there is a slight increase in noise at the tire-pavement interface, similar to noise resulting from other microsurface applications in place around the state.

Q. Anything similar to high friction chip seal in use elsewhere in the country?
A. No. We were one of the first to consider this particular application. We worked with the asphalt binder supplier and did some laboratory work and looked at durability. Chip seals have been used in other areas of the country in areas where friction is an issue, but chip seals have not been specifically designed as a friction treatment as this one is.


Influence of Cracking and Brine Concentration on Corrosion and Chloride Content. Aaron Strand is a Ph.D. Candidate in the John A. Reif, Jr. Department of Civil & Environmental Engineering at New Jersey Institute of Technology and recently defended his Ph.D. Dissertation successfully.

Throughout the U.S., agencies are using increasing amounts of salt and brine to counter road icing. Corrosion is an expensive problem for highway bridges. In reinforced concrete bridges, the primary cause of deterioration is chloride-induced corrosion. The focus of this study was the effect of surface-applied chlorides through road salting, typically using rock salt or brine. The research showed that the effect varies dependent on the condition of the bridge deck.

Click for PDF

The research explored whether current testing takes into consideration the amount of salt placed on the roads, salt placement cycles, and the current condition of the bridge deck. Chlorides can affect the bridge steel reinforcement through diffusion from the surface, and through cracks in the bridge deck. The variables explored were salt brine concentration and degree of cracking and their effect on the corrosion time of bridge decks. Testing was undertaken in the lab and from core samples from a large-scale bridge deck specimen.

Ongoing work based on this preliminary study includes testing of other concrete mixture designs, testing other rebar types, and developing a model for the amount of chloride content and corrosion current process. Looking at other concrete designs.

Mr. Strand answered several questions following his presentation:

Q. Among the cracked samples, did the higher brine solution show faster corrosion? What was the rate?
A. They all really showed corrosion immediately, at least in the macrocell test, but the rate was not shown. Going back to the total corrosion, six percent showed a quicker rate, but the other three passed the threshold at the half-year mark. There might be a decrease in the time to corrosion as the brine is increased, but it’s maybe not as much as would be expected from such an increase.

Q. Did you introduce temperature as a variable or do you see this as part of a future study?
A. This would be part of a future study. We did look at doing some type of freeze-thaw work on the concrete itself, but not as part of the brine cycling. As part of research into different mixture design, we would look into temperature’s role into the rate of ingress.

Q. How would you like to see your research findings used to inform bridge design, operations or maintenance in the future?
A. The testing we do shows how mixtures might perform together. For actual application-based work, we need to be more careful about the testing of the materials. For example, we know very little about how incorporating changes is in brine concentration might impact corrosion.

A recording of the webinar is available here.

Lunchtime Tech Talk! WEBINAR: Goodluck Point Beneficial Use of Dredged Material via Nearshore Placement and Shark River Sediment Transport Model

On March 24, 2022, the NJDOT Bureau of Research hosted a Lunchtime Tech Talk! Webinar on “Goodluck Point Beneficial Use of Dredged Material via Nearshore Placement and Shark River Sediment Transport Model.” Welcoming remarks were given by Amanda Gendek, Manager of the Bureau of Research, who turned over the session to its moderator, Omid Sarmad, a member of the NJDOT Technology Transfer Project Team.

Dr. Miskewitiz described the coastal Marine Transportation System.

In his introductory remarks, Mr. Sarmad noted that nearshore placement of dredged sediment is a natural and nature-based features strategy that offers the dual benefits of providing ecosystem enhancement and reduction of coastal flooding while providing a viable, cost-effective long-term beneficial use option for disposal of dredge materials.  However, Mr. Sarmad noted that improper placement of dredged materials can damage habitat or wash away, providing little or no benefit. Strategic placement requires knowledge of site conditions and sediment transport behavior to provide ecosystem enhancement and resiliency.

Mr. Sarmad then introduced Dr.  Robert Miskewitz, Associate Research Professor within the Rutgers Department of Environmental Sciences and the Center for Advance Infrastructure and Transportation (Rutgers-CAIT), and Dr. Daniel Barone, Associate Research Professor within the Rutgers University Department of Marine and Coastal Sciences (DMCS), the Department of Geography and Rutgers-CAIT who, respectively, presented their research on the development of a Delft3D morphological model to improve estimation of channel shoaling along the Shark River waterway, and the lessons being learned from a nearshore sediment placement project at Goodluck Point in Berkeley Township, NJ.

Dr. Miskewitz described how the computer model domain was informed by tidal conditions, bathymetric surveys and design depths.

Dr. Miskewitz’s presentation, Morphological Sedimentation Model Development and Integration within Maritime Transportation System (MTS) Applications, described an approximately two-year research project underway in association with Dr. Barone on the Shark River waterway. The research seeks to establish a model framework for assessing sediment transport in the NJ Maritime Transportation Systems.

He outlined the challenge of maintaining a coastal maritime transportation system in NJ, a system of 300 nautical miles of state and federal channels, that continuously fills with sediment.  Dredging is required to keeps channels usable for marine ports and smaller recreational boating channels, which are all essential to New Jersey’s economy. However, maintaining navigable channels is expensive, meaning the amount that can be dredged is limited based on the existing fiscal resources despite the overall need for dredging based on the amount of sediment being accumulated each year.  Recognizing that sediment deposition rates are not uniform among areas, tools are needed for the informed setting of priorities for the allocation of resources.

Dr. Miskewitz shared a visual simulation of how flow rates vary by locations and depth in the model

Dr. Miskewitz shared a visual simulation of how flow rates vary by locations and depth in the model.

Their research seeks to inform and supplement the multiple systems offered by NJDOT’s Office of Maritime Resources (OMR) – the Dredged Material Management System (DMMS), Waterway Linear Referencing System (WLS), and Maritime Asset Management System (MAMS) – that are being used to assess the state of the marine transportation system, what is required to get it to a “state of good repair”, and then keep it in a “state of good repair”. Then, as part of the dredging process, the questions turn to what to do with the dredge materials – how best to dispose of them or reuse them to put to a beneficial use.

Dr. Miskewitz explained that historically the estimation of sediment shoaling in the NJMTS has been accomplished via a highly simplified empirical sedimentation model. Dr. Miskewitz explained that channel depths are measured every few years, with data predicting infill rates and shoaling based on simple equilibrium depths between two points. In contrast, Dr. Miskewitz described their efforts to develop a more complex process-based hydrodynamic model, offered by the Delft3D model, which allows for more detailed prediction of sediment transport up to 2 years out.

Dr. Miskewitz explained his estimates of the rate of sediment accretion over time.

Dr. Miskewitz explained his estimates of the rate of sediment accretion over time.

To pilot this process-based hydrodynamic model, Shark River’s small network of maintained state channels was selected as ideal for small-scale testing. Sediment can vary by grain size and source, behaving differently based on these factors. This is crucial for modeling, as the muddy sediment in the Shark River does not move discretely like grains of sand. Rather, it breaks in chunks after a critical shear force is met, allowing currents to flow into the holes created, further undermining its cohesion.

The Delft 3D model allows for multiple parameters to be set, including bulk settling velocities for certain sediment types, measured from samples which had been collected.   The model that has been developed includes a fine fraction (silts and clays) and a coarse fraction (sand). Samples were analyzed to determine the fine content versus the coarse content and to inform the model’s characterization of the erodible layer.

The modeling process itself is very resource-intensive and, thus far, has only been run for a limited 3-day period, but allowed for extrapolation to estimate sediment accretion over time. The predictive model showed that shoals near channels are being destabilized, despite small changes in overall sediment levels. Dr. Miskewitz pointed to a ridge of shoal pushing outward and away from the channel, explaining that this means sediment is being suspended and other channels are shallowing.

Dr. Miskewitz shared examples of the model's visualizations of accretion and changes in shoals over time.

Dr. Miskewitz shared examples of the model’s visualizations of accretion and changes in shoals over time.

As the current project continues, Dr. Miskewitz described the research team’s tasks to calibrate the hydrodynamics against observation, eventually running long-term (2 to 3 years) model simulations, and investigating the impact of extreme episodic events (like Hurricane Sandy) compared to normal accretion rates.

Ultimately, the long-term goal is to develop the capacity to run the model in real-time for the entire NJ Maritime Transportation System and incorporate the model into NJDOT’s OMR’s MAM model to better manage the sediment transport predictions and better manage the resources for dredging.  He noted their current plans to integrate new computer server capacity to perform the requisite sediment transport modelng in a timely fashion and at the scale envisioned for aligning with these goals.

Dr. Barone’s presentation, Goodluck Point Monitoring and Modeling Nearshore Placement of Dredged Materials, described ongoing research of a nearshore placement project in Berkeley Township. Owned by the Forsythe National Wildlife Refuge, the subject lands are a narrow sandy estuarine beach and dune system fronting a tidal marsh. His research involved a pre-dredging assessment of marine conditions (e.g., turbidity, current, wave conditions, etc.) and tracked the extents of sediment plumes from the filling operation. Then he assessed conditions at 3, 6, and 12 months after placement to see how beach morphology was affected, with an 18-month post-placement survey forthcoming.

Dr. Barone shared several images and video captured by UAS, including of a barge used in pumping dredged materials.

Dr. Barone gave an overview of the several data collection methods used for monitoring and modeling the results of the beneficial use project before, during and after dredging.  He shared video taken by an unmanned aerial system (UAS) of a barge pumping roughly 6000 cubic yards of suitable dredged material (more than 70 percent sand) in a 1700ft linear bar near the shore.

Preliminary results showed that turbidity was relatively high, but not significantly higher during the project. (Ironically, turbidity was far higher prior to the project starting due to a storm event, then falling much lower just before the project commenced.)

Dr. Barone illustrated how UAS aerial surveys illustrated visible plumed before, during and after dredging.

Dr. Barone illustrated how UAS aerial surveys were able to display visible plumes before, during and after dredging.

Dr. Barone shared images of the visible plumes, which were largely confined to the placement area. A major storm event occurred during the first month post-placement, moving most settlement onshore and into the southern area, where there is a small cape. After 12 months, only 42 percent of the placed sediment remained in the placement zone at Goodluck Point, with dominant alongshore sediment transported to the south.

Across the entire mapped project area (including beach, berm and offshore), a total volume loss of 7,100 cubic yards was observed between the Before-Dredge survey and 12 months post-fill. Similar losses across the entire mapped areas were observed between Before-Dredge and After Dredge.  Seaward shoreline movement – that is, accretion, occurred in the southern 715 feet of the project area over the survey period.

In future projects, he suggested consideration of alternative placements, such as feeder beaches. By experimenting with placement and validating against the hydrodynamic morphological model, he hopes that the better modeled flows will inform and improve placement strategies.

Dr. Barone highlighted volume loss and geographical shifts of nearshore berm placement of dredge materials placement over time based on surveys.

Dr. Barone highlighted volume loss and geographical shifts of nearshore berm placement of dredge materials placement over time based on surveys.

Following the presentations, Mr. Sarmad moderated questions posed by participants via the chat feature.

Q. Did freezing the cores of sediment samples impact the shear measurements?

Dr. Miskewitz: That they may have. We froze them because we had to wait months before students were available to process and we did not want anything to grow, as these samples are pretty much alive.

Q. Regarding the bridge at Highland Avenue: Does the model measure the changes in elevation and speed?

Dr. Barone:  This is a depth average model, not a 3D model.

Q. How well can you simulate Hurricane Sandy?

Dr. Miskewitz: That type of simulation will be done based on adjusting boundary conditions. Some affect from wind, but probably not as much as water level going up. The release of everything being inundated and then washed out, carrying stuff with it, is the dominant factor in erosion.

Dr. Barone shared several visualizations and explained how the hydrodynamic /morphological model can be used to optimize locations, configurations, and timing of dredge materials placement

Dr. Barone shared several visualizations and explained how the hydrodynamic /morphological model can be used to optimize locations, configurations, and timing of dredge materials placement.

Q. Does the popularity of the channel affect the frequency or priority of dredging? (e.g., compared to residential areas)

Dr. Miskewitz: That is a question best directed to NJDOT’s OMR, not for us, but it is based on many things that would drive decisionmaking at which I’m not qualified to comment.

Q. Was the project permitted as a pilot project, or did it not have that designation?

Dr. Barone: It did not have that designation. OMR partnered with the Forsythe Wildlife Center, who controlled the project and NJDOT partnered with them to provide technical resources.

Q. How do you test the accuracy of your preliminary model?

Dr. Barone: We compared our survey data with model output such as time-varying bed levels, but also ADCP (Acoustic Doppler Current Profiler) data, so we can validate velocity and water level and tide gauge.

Q. Were there any other locations identified as potential areas for similar observation?

Dr. Barone: The plan is to do this for the entire state’s navigation channels. Regarding Goodluck Point specifically, marshes are not getting bigger and beaches continually need sediment since there is an absence of sediment supply, so there are lots of places that will need this kind of work.

Dr. Miskewitz: We have a couple of projects in the area and further south that will get similar treatment.

The presentations described several technical analytical considerations in handling data and defining modeling parameters and contained several visual simulations that can best be appreciated by viewing the webinar recording, which is available here, (or see right).

NJDOT Tech Talk! Webinar – What Happens Now? Virtual Public Engagement During and Beyond Covid-19

The New Jersey Department of Transportation Bureau of Research convened a Lunchtime Tech Talk! Webinar on What Happens Now? Virtual Public Involvement During and Beyond COVID-19 on October 6, 2021. Amanda Gendek, Manager of the NJDOT Bureau of Research, welcomed everyone to the event which included presentations by five representatives of public sector transportation agencies who discussed the immediate transition and ongoing adaptation to virtual platforms to engage with the public for transportation plans, projects, and other activities, and the benefits and challenges associated with this shift. Of particular emphasis was outreach to underserved and vulnerable populations.

Facilitators for the Tech Talk, Andrea Lubin and Trish Sanchez, from the Rutgers University-Voorhees Transportation Center, Public Outreach and Engagement Team (POET), opened the session with reference to their work on NCHRP Synthesis 538: Practices for Online Public Involvement, and the next phase of work, NCHRP 08-142 Virtual Public Involvement (VPI) – A Manual for Effective, Equitable, and Efficient Practices for Transportation Agencies. During the pandemic, Rutgers POET has conducted public engagement which transitioned to virtual for the South Jersey Transportation Planning Organization, Somerset County, and Middlesex County’s Destination 2040 projects. Ms. Sanchez noted the need to experiment with different engagement practices to find what works for each community, and the benefits of building partnerships with local organizations to reach a broad audience. She also noted challenges with VPI such as the digital divide, internet access, and staffing. Ms. Lubin discussed a 2020 study conducted for the Kessler Foundation and interviews with social service agencies and community organizations that offered lessons learned when conducting virtual outreach with vulnerable populations. Despite challenges, Ms. Lubin emphasized that VPI has expanded engagement opportunities in many instances to those who had previously been unable to participate in-person due to obstacles including transportation and childcare.

Rickie Clark, Transportation Specialist with FHWA, noted that Virtual Public Involvement (VPI) is one of the innovative initiatives supported in the fifth and sixth rounds of the agency’s Every Day Counts Initiative. He reviewed the legislation and regulations that requires early and continuous public involvement in the transportation planning and project development process. To meet those requirements during the COVID-19 pandemic, FHWA issued VPI Temporary Guidance that will remain in effect until the pandemic has ended. Mr. Clark encouraged the use of a wide array of VPI tools that can be customized to the needs of particular projects and audiences. VPI extends outreach to the public and enables the public to engage with transportation officials efficiently and effectively. For those who have limited access to the internet, he emphasized that transportation agencies must provide alternatives to ensure full, fair, and meaningful participation for all. Mr. Clark noted that New Jersey is using many VPI innovations.

Jamille Robbins, Public Involvement, Community Studies & Visualization Group, Leader, North Carolina DOT, spoke on how his agency has reached underserved communities with VPI. He discussed the importance of pursuing thoughtful marketing to support the success of VPI and other outreach efforts designed to educate and inform the public and other stakeholders in the transportation project development process. He explained that broadening outreach and increasing engagement contributes to transparency and builds trust. He noted that social media is an effective tool for reaching rural, lower-income, Black, Hispanic, and less-educated populations, and that mobile phone friendly communication is essential.  However, agencies should not be solely relying upon VPI. Traditional media, webpages, partner agency and organization networks, newsletters, postcards, door hangers and local access television and radio remain effective tools for reaching traditionally underrepresented groups. Similarly, integrating the use of phones to collect public comments can augment traditional methods for collecting input, such as paper surveys. Mr. Robbins shared experiences with utilizing a variety of VPI tools and platforms including public engagement software such as publicinput.com and the social networking service Nextdoor. He also described pre-recorded project information videos as a highly effective tool for controlling messaging and highlighted the agency’s use of online engagement platforms for live meetings, with the recordings placed on the web, so that constituents can access them and provide feedback at any time. Mr. Robbins also promoted the use of project visualizations, including 3D renderings and interactive animation that can be easily dispersed across online communication channels and improve understanding of proposed projects. While sharing many tools creatively being used by NCDOT, Mr. Robbins balanced his remarks with several takeaways and lessons learned observations about the limitations of VPI for reaching underrepresented communities.

Alison Hastings, Associate Director, Communications, Delaware Valley Regional Plan Commission (DVRPC) spoke about the agency’s use of VPI in the Long Range Plan 2050 Visioning process, and for the Ben Franklin Bridge Eastbound Access project, and the regional MPO’s anticipated integration of VPI for public involvement in the post-pandemic era. When pivoting from in-person public engagement to virtual events, Ms. Hastings listed several themes that required consideration:  accessibility and accommodations, recreating the in-person experience, setting ground rules and ensuring security. She also described her team’s considerations in determining the specific staffing roles needed for their virtual events, such as lead facilitator, technical assistance leader, and comment response facilitator, among other roles. She noted identifying these positions has helped to ensure smoother virtual events.

DVRPC has used many VPI platforms and tools, both old and new, such as videos, targeted social media campaigns, live transcription and captioning in meetings, web maps, and postcard mailings and noted that public participation has increased with their VPI efforts. Ms. Hastings discussed the advantages of meeting platforms that run well on browsers and smart phones and enable participation in underserved communities that lack internet access. In the future, DVRPC’s equity checklist will include using American Community Survey data to understand the demographics of the project area, communicating why the meeting is important, using Google forms to build contact lists, preparing the team for the challenges of online meetings, experimenting with different outreach, and evaluating the VPI process.  She anticipates that hybrid meetings – in person and virtual – will continue and may require additional staff to run efficiently to achieve desired outcomes.

Vanessa Holman, Deputy Chief of Staff and Megan Fackler, Director of Government and Community Relations at NJDOT explained that their Public Information Centers (PICs) and other outreach must be compliant with Title VI requirements. Due to the pandemic, they needed to find ways to bridge the digital divide which is economic, generational, and geographic. NJDOT has combined established methods of engagement with virtual methods, and in particular, collaborated with stakeholders through social media, websites, and digital news sources. They noted that virtual meetings have helped to remove some barriers to participation, such as the need for transportation and childcare. Ms. Holman shared that they have lost some of the interaction typical of an in-person meeting, and noted the different staff demands of online meetings such as prepared scripts. The Department has also expanded communication in other ways, including through 1-2 page project update memos, written in plain language, for public officials. They now tend to over-communicate and continue to use a range of tools. These efforts are resulting in more public participation and comment in general.

Public involvement tools are available to engage underserved and vulnerable populations and expand outreach so every community member can participate in transportation decision making. Click for Andrea Lubin and Trish Sanchez's presentation

Mr. Clark noted that there is no one-size-fits-all public involvement process and promoted the use of an array of public involvement tools to communicate with the public and receive input. Click for Rickie Clark's presentation

North Carolina JDOT uses 3D visualizations and interactive animation, among other tools, to help public involvement participants understand proposed projects and impacts.

North Carolina DOT uses 3D visualizations and interactive animation, among other tools, to help public involvement participants understand proposed projects and impacts. Click for Jamille Robbins' presentation

DVRPC used both old and new methods of communication for the Ben Franklin Bridge Outreach Plan. Click for Alison Hastings' presentation

NJDOT was successful with their two-week, on-line PIC for the Rt. 80 and Rt. 15 Interchange project. They received large volumes of survey responses and discovered key times for public participation that will inform future efforts. Click for Vanessa Holman and Megan Fackler's presentation

At the end of the event, the speakers responded to questions posed by attendees through the platform’s chat feature.

Q. How expensive is NextDoor?

Jamille Robbins: I don’t believe there’s a huge cost associated but I would have to check with our social media coordinator.

Q. What program did North Carolina use to do 3D presentations?

Jamille Robbins: We use 3D Studio Max for a lot of the presentations.

Q. How do you provide for two-way communications and conversations in an online environment that would occur at in-person events?

Alison Hastings: The platforms, such as Zoom, help. The chat box becomes a primary source of input since you can save it. Conversations can happen in breakout rooms with small groups and a facilitator sharing a screen while using Google docs to record notes. Platforms push updates that provide these tools to emulate the in-person experience.

Trish Sanchez: Break-out groups allow people to feel more comfortable speaking openly.

Andrea Lubin: Especially if they are intimidated by large groups.

Q. What are typical costs for publicinput.com?

Jamille Robbins:  North Carolina uses it on all projects and it is cost-effective, but I do not know specific costs.

Q. For NJDOT: Have you received feedback, either positive or negative, on the VPI process or the platforms used and has that encouraged you to change anything in your VPI strategies?

Megan Fackler: Not thus far. We have received questions on the platform, and requests for technical assistance. It is important to provide a phone number for people to reach out prior to a meeting if they are having difficulties accessing the meeting.

Q. For Rickie Clark: If a municipality requested an in-person event, would FHWA provide guidelines for conducting such a meeting?

Rickie Clark: The possibility for in-person meetings would depend on state and municipal guidance for in-person engagement, as well as the guidance of local health officials. During the pandemic, the VPI Temporary Guidance is in effect.

Q. If you could offer one piece of advice for VPI for underserved or vulnerable populations, what would it be?

Andrea Lubin: What I heard from Jamille was the power of radio advertising to target outreach, based on the number of people who are regular radio listeners.

Rickie Clark: From the federal perspective, agencies must have a public involvement plan in place to begin with. Agencies should evaluate the effectiveness of VPI tools. DOTs have become more nimble in modifying their approach. Imagine a time after COVID-19 when a hybrid model can be used and start planning now. It will be a win-win.

Jamille Robbins: Look at the demographics of the area and population characteristics. If there are EJ or LEP communities, reach out to the local planning office or someone familiar with the area. This is the most effective way to get into those communities.

Q. How do you handle data protection in the VPI process?

Alison Hastings: Don’t ask the question if you can’t protect the information you gather. Also, sunset dates determine how long a survey remains open. Set a date for expunging contact information after gathering that information. Use the same process for focus groups.

Jamille Robbins: We are simplifying the demographic information we are requesting. Asking for a name, email, and address may pass a threshold. Keep in mind that information gathered at a public meeting is a matter of public record.

A recording of the webinar is available here.