
On June 10, 2020, the NJDOT Bureau of Research hosted a Lunchtime Tech Talk! Webinar on "Evaluation of Precast Concrete Pavement Systems and State Specifications.” Dr. Yusuf Mehta, Director of Rowan University’s Center for Research and Education in Advanced Transportation Engineering Systems (CREATEs), introduced the presentation and acknowledged the contributions of individuals and other state DOTs to the research effort. Dr. Daniel Offenbacker began the presentation with a description of the research study performed for NJDOT to identify, evaluate, and compare precast pavement systems, specifications, and practices currently in use for Precast Concrete Pavement (PCP). The study included an extensive literature review and surveys with Subject Matter Experts from various state DOTs that have experience with precast concrete pavement rehabilitations.
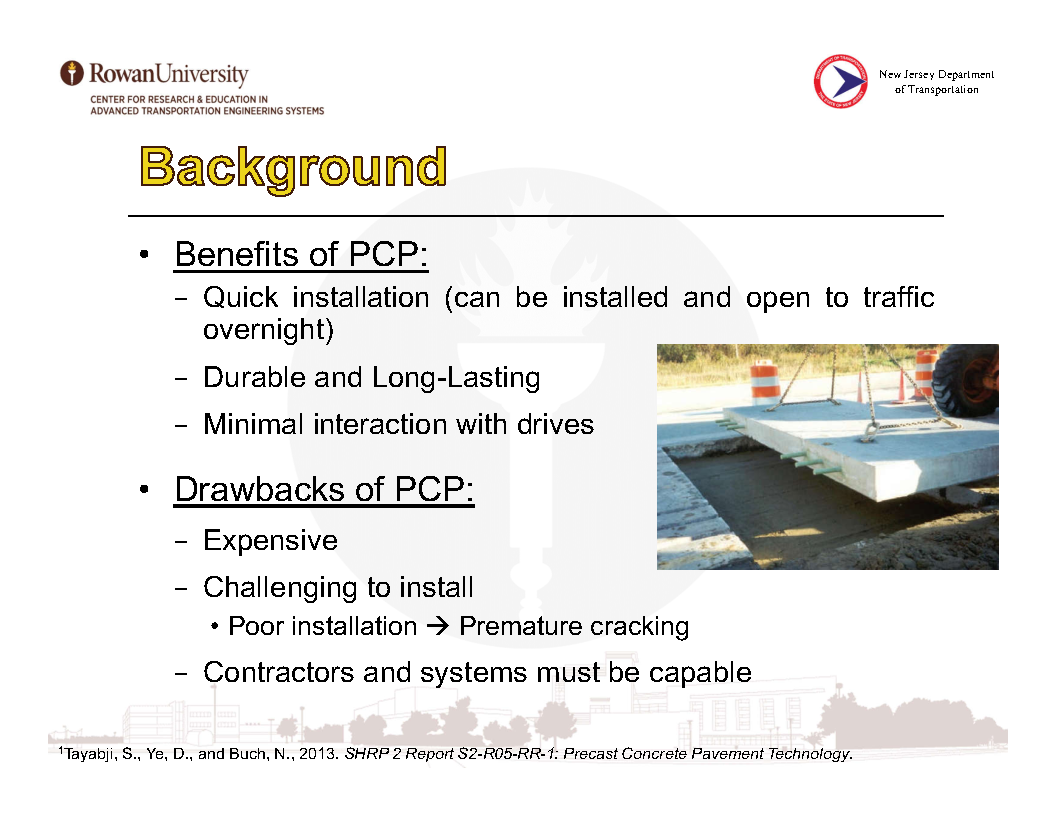
Dr. Offenbacker discussed the benefits and drawbacks of Precast Concrete Pavements.
Rigid pavements play an important role in highway infrastructure, primarily in regions with high traffic density such as New Jersey. NJDOT is continuously exploring innovative pavement rehabilitation strategies, such as Precast Concrete Pavement (PCP), that allow for faster and more durable rehabilitation of rigid pavements. Precast concrete is cast off-site to specifications and installed to match a particular location. Dr Offenbacker noted the benefits of precast concrete systems including quick installation that limits the duration of road closure and requires minimal interaction with drivers. The material is durable and long-lasting. Drawbacks include the high cost, challenges to installation requiring tight specifications, and limited capability among contractors and systems.
The researchers surveyed 17 states and followed up with 8 states that are using PCP systems. Other states shared experiences with systems in use, standards for manufacture and installation, permitting of new systems, and experiences with installation and performance. Eight different state specifications were identified that addressed panel fabrication, bedding and grout stabilization, installation tolerances, and encasement grout.
The research led to the conclusion that installation is critical to PCP performance. Failure is generally due to misalignment or poor leveling. Dr. Offenbacker described a proposed five-step system approval process to be used in New Jersey for acceptance of newly-developed precast pavements. The approval system included materials and slab approval, demonstration of system installation, and proof of performance. Recommendations included use of documented experiences from other states in establishing specifications and exploring development of a generic PCP system for New Jersey.
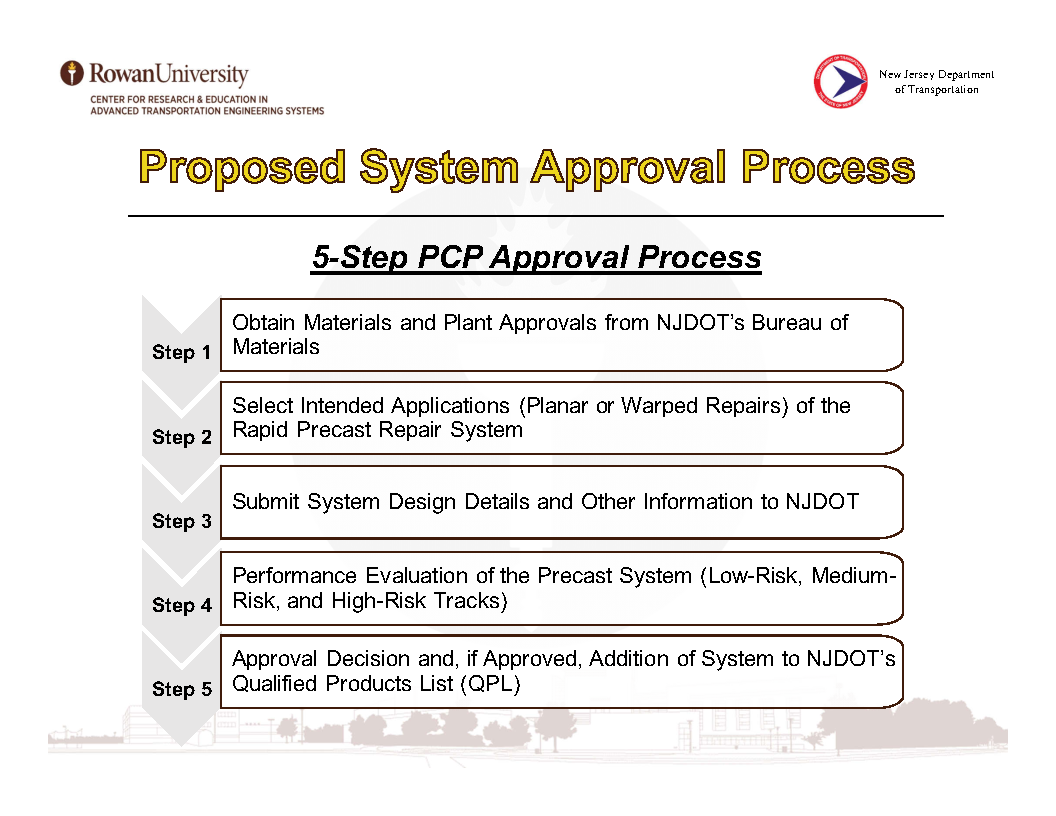
The research resulted in recommendations for a Precast Concrete Pavement approval process for use in New Jersey
Dr. Offenbacker noted the need for future work to investigate the long-term performance of PCP systems, to prepare a life cycle cost analysis to quantify the economic benefits, to assess the usefulness of intermittent precast systems in light of surrounding pavement deterioration, and to develop a training platform for contractors to insure proper installation.
Following the presentation, participants posed questions via the chat feature. Responding to a question about the use of planar vs. non-planar slabs, Dr. Offenbacker noted that the existing conditions of the roadway would determine which slab would be used to match the existing structure.
A participant asked if there was any criteria for choosing between rapid-set concrete and PCP. Dr. Offenbacker responded that there was no criteria yet for when one would choose one over the other.
A participant asked what Dr. Offenbacker considered the key takeaway from the surveys. He responded that installation was the key consideration. He emphasized the need to understand the economic benefits of PCP, which are starting to outweigh the benefits of other rehab techniques such as rapid-set.
In response to a question about training needed, Dr. Offenbacker noted that training is needed in the specific systems. California requires each contractor to go through a certification process if they want to use precast pavement systems on a regular basis.
A participant asked if deterioration of slabs adjacent to a replacement slab was due to the replacement slab. Dr. Offenbacker replied that the replacement slab would not cause deterioration if installed properly. The roadway may be deteriorating incrementally.
A participant asked if the Federal Highway Administration (FHWA) provided input on QA/QC for underslab grouting and grouting dowel bar slots. Dr. Offenbacker responded that there are thorough specifications for these elements and they are available in the final report.
In response to a question about whether there is a maximum and minimum size for PCPs and how that correlates to performance, Dr. Offenbacker noted that this has not been explored well yet. The typical length is 15 feet.
The presentation given by Dr. Mehta and Dr. Offenbacker can be downloaded here.
For more information about the research study, please access the final report and technical brief here.
For more information about research at Rowan University's CREATES, click here.
A recording of the presentation is also available here (or see right).