Lunchtime Tech Talk! WEBINAR: Analysis of Local Bus Markets

On October 7, 2020, NJDOT hosted a Lunchtime Tech Talk! Webinar on the Analysis of Local Bus Markets with Deva Deka, Ph.D., Assistant Director, Research, at Rutgers – Alan M. Voorhees Transportation Center, and Susan O’Donnell, Senior Director, Business Analysis and Market Research at NJ TRANSIT. Dr. Deka began the presentation with a general description of the NJ TRANSIT system that operates approximately 250 bus routes throughout New Jersey. Bus riders constitute almost 60 percent of all riders using NJ TRANSIT services, including commuter rail and light rail. For many New Jersey residents, those buses are essential for meeting almost all daily travel needs.

Dr. Deka provided a profile of the demographics of bus users, including household income, race, and vehicle ownership

Dr. Deka provided a profile of the demographics of bus users, including household income, race, and vehicle ownership.

For the past five years, the Alan M. Voorhees Transportation Center of Rutgers University has been conducting onboard surveys of bus riders in different parts of New Jersey for projects funded by the NJDOT Bureau of Research and sponsored by NJ TRANSIT. Dr. Deka, the Principal Investigator for these survey studies, presented the bus survey methodology, and key findings. He described the questionnaire design, survey scheduling, training of surveyors, and the process of data collection, and the post-survey process that has involved data cleaning and weighting, and analysis. Over the five years, the project has generated clean data for over 15,000 riders.

Dr. Deka gave an overview profile of bus rider characteristics and trip characteristics found from the survey research. The survey showed that riders are predominantly Hispanic and/or African-American, lower-income, from households with no car or one car, and dependent on the bus system. The data support the essentiality of bus services for zero-car households and inform analyses of the broader impacts of bus services such as decreases in traffic delays and reductions in greenhouse gas emissions.

In the second half of the presentation, Ms. O’Donnell described the use of the survey data by NJ TRANSIT for planning purposes. The data supports travel demand modeling which replicates existing conditions and predicts future conditions to inform roadway projects and transit projects. This information is shared with New Jersey’s three Metropolitan Planning Organizations, the Port Authority of New York and New Jersey, and the New York Metropolitan Transportation Council. Current data is required in transit grant applications, and contributes to studies related to access to transit, corridors, intermodal systems, and transit oriented development.

To fulfill the agency’s obligations under Title VI of the Civil Rights Act of 1964, NJ TRANSIT uses the data to perform an equity analysis to evaluate the effect of fare changes or service changes on low-income populations and minority populations, and to provide data to help in developing a language assistance plan for Limited English Proficiency populations.

In addition, NJ TRANSIT uses the data when working with advertisers that want to target their message efficiently to specific demographic groups.

The agency’s Newark Bus System Redesign Project will use the data collected in fall 2019 to align and modify bus routes and explore service to new areas. This is the first, and largest, of multiple systems to be evaluated to bring the agency’s entire bus system up to date.

In closing, Ms. O’Donnell presented an update on bus use during the pandemic based on surveys given during April and June. The data shows how important the bus system has been to essential workers.

Following the presentation, the Dr. Deka and Ms. O’Donnell responded to questions asked through the chat feature:

Q. What was the number of questions asked on the survey and what incentives were offered?
A. The survey comprised about 30 questions. Incentives helped increase interest in the surveys and respondents had a chance of winning 1 of 5 $100 gift cards.

Q. Did you consider using IPads rather than paper-based intercept surveys?
A. Dr. Deka noted that they did consider them, but use of IPads limits the number of surveys that can be collected at one time. The surveyor has to stay with the individual using the IPad, and cannot approach other riders at the same time, limiting the efficiency of the survey-taker. Dr. Deka also referenced a Mineta Transportation Institute report that compared data quality and costs for different approaches to on-board transit passenger surveys that found efficiencies with the paper-intercept approach for bus users. Ms.O’Donnell noted that this technology might work at a station or on a platform because a number of surveyors can be located in the same place but is difficult to use on a crowded bus. During the pandemic, IPads probably could not be used due to safety concerns with touching and handling equipment.

Q. What are typical variables used to weight the data to the total ridership?
A. The sample is weighted by direction of the bus, time of day, and the run. A trip is from an origin to the destination and all trips combined is a run. They do not weight the sample by demographic variables or geography because they do not have solid information on the total transit user “universe” population related to these variables.

Q. Did you compare rider survey results by types of service area?
A. No. While there are some suburban routes if you segment or categorize by origins, such as Morristown, almost all routes are generally very urban. It would be possible to use the data to compare by counties.

Q. What is the delay imposed by traffic congestion on buses?
A. Traffic impacts have been an issue that has been looked at by traffic engineers at Rutgers – CAIT some years ago. They collected data traffic signal timings at intersections that the bus traveled through and applied VISSIM for simulations. Dr. Deka said that he could connect anyone interested with the detailed technical methods that the researchers used on that traffic impact study, if they’re interested.

The presentation given by Dr. Deka and Ms. O'Donnell can be downloaded here

A recording of the webinar is also available (see right).

Share Your Ideas on the NJ Transportation Research Ideas Portal!

The New Jersey Department of Transportation’s (NJDOT) Bureau of Research invites you to share your ideas on the NJ Transportation Research Ideas Portal.

We are asking NJDOT’s research customers and other transportation stakeholders to propose research ideas for the NJDOT Research Program. Join us in finding workable solutions to problems that affect the safety, accessibility, and mobility of New Jersey’s residents, workers, visitors and businesses.

REGISTER TO PARTICIPATE.  Once you are registered, you may submit ideas at any time.  If you registered last year, you do not need to register again.

HOW DO I SUBMIT AN IDEA?  Only registered participants can log in to submit a new idea or vote on other ideas to show your support. Register at the NJ Transportation Research Ideas website welcome page here:  https://njdottechtransfer.ideascale.com/

NEXT ROUND OF RESEARCH.  Please submit your research ideas no later than December 31, 2020 for the next round of research RFPs. The NJDOT Research Oversight Committee (ROC) will prioritize research ideas after this date, and high priority research needs will be posted for proposals.

Questions about how to register?
Email: ideas@njdottechtransfer.net

For more information about NJDOT Bureau of Research, visit our website: https://www.state.nj.us/transportation/business/research/

Or contact us:  Bureau.Research@dot.nj.gov or (609) 963-2242

FHWA Announces Every Day Counts (EDC-6) Innovation Areas

Every two years, FHWA works with state transportation departments, local governments, tribes, private industry and other stakeholders to identify and champion a new collection of innovations that merit accelerated deployment through the Every Day Counts Program (EDC). The FHWA’s Center for Accelerated Innovation (CAI) has recently issued the next round of areas of innovation, EDC-6.

EDC is a state-based model that identifies and rapidly deploys proven, yet underutilized innovations to shorten the project delivery process, enhance roadway safety, reduce traffic congestion, and improve environmental sustainability. Proven innovations promoted through EDC facilitate greater efficiency at the state and local levels, saving time, money and resources that can be used to deliver more projects.

FHWA’s CAI fosters collaboration between stakeholders within the transportation community through the State Transportation Innovation Councils (STIC), which are charged with evaluating innovations and spearheading their deployment in each state.

FHWA announced that it will officially launch EDC-6 by webinar on September 23, 2020. More information is expected to follow regarding virtual summits during which transportation leaders and front-line professionals from across the country will discuss and identify opportunities for implementing the innovations that best fit the needs of their respective state transportation program. Following the summits, New Jersey will finalize their selection of innovations, establish performance goals for the level of implementation and adoption over the upcoming two-year cycle, and begin to implement the innovations with the support and assistance of the technical teams established for each innovation.  Further descriptions of each of the EDC-6 Innovations are below:

Crowdsourcing for Advancing Operations. State and local transportation agencies need real-time, high-quality, and wide-ranging information to optimize roadway operations for reduced congestion and increased safety. Agencies are increasing the quality and quantity of operations data with crowdsourcing, which enables staff to make better decisions that lead to safer and more reliable travel and apply proactive strategies cost effectively. With crowdsourced data from multiple streams, agencies can capture in real time what happens between sensors, in rural areas, along arterials, and beyond jurisdictional boundaries.

e-Ticketing and Digital As-Builts. Highway construction projects generate massive amounts of valuable data that historically were communicated via paper, but agencies are improving on paper process by integrating them into electronic and digital workflows. Electronic ticketing improves the tracking, exchange, and archiving of materials tickets. Digital information, such as three-dimensional design models and other metadata, enhances the future usability of as-built plans for operations, maintenance, and asset management. Both can increase project safety, quality, and cost savings through efficient data gathering and sharing.

Strategic Workforce Development is among the innovative initiatives in EDC-6 offering strategies to identify, train, and place workers for highway construction jobs.

Next-Generation Traffic Incident Management: Integrating Technology, Data and Training. More than 6 million traffic crashes are reported each year, creating congestion and putting motorists and responders at risk of secondary crashes. Next-generation traffic incident management (NextGen TIM) builds on FHWA’s national TIM responder training program to shorten the duration and impact of incidents and improve the safety of motorists, crash victims, and responders. NextGen TIM offers tools, data, and training mechanisms that can benefit both new and existing TIM programs, including local agency and off-interstate applications.

Strategic Workforce Development. The demand for highway construction, maintenance, and operations workers is growing while the transportation industry is experiencing a revolution of emerging technologies that require new skills. The Highway Construction Workforce Partnership developed strategies and resources to demonstrate the value of a career in transportation and fill the jobs that support the Nation’s highway system. Resources include the “Identify, Train, Place” workforce development playbook and Roads to Your Future outreach campaign to attract and retain workers in highway construction jobs.

Targeted Overlay Pavement Solutions. Pavement overlays represent a significant portion of highway infrastructure dollars. Many pavements in the highway system have reached or are nearing the end of their design life while carrying traffic that exceeds their initial design criteria. Targeted overlay pavement solutions (TOPS) are now available for asphalt and concrete pavements that enable agencies to maximize their investment and help ensure safer, longer-lasting roadways. TOPS will improve performance, lessen traffic impacts, and reduce the cost of pavement ownership.

Ultra-High Performance Concrete for Bridge Preservation and Repair. Ultra-high performance concrete (UHPC)—a fiber-reinforced, cementitious composite material with mechanical and durability properties that far exceed those of conventional concrete—has become popular for field-cast prefabricated bridge elements. Bridge preservation and repair is a new application of UHPC that offers superior strength, enhanced performance, and improved life-cycle cost over traditional methods.

Virtual Public Involvement. Public engagement during transportation project planning and development helps agencies identify issues and concerns early in the process, which can ultimately accelerate project delivery. Virtual public involvement supports agency efforts to engage the public more effectively by supplementing face-to-face information sharing with technology. Techniques such as telephone town halls, online meetings, and social media increase the number and variety of ways to inform the public, receive feedback, and collect and consider stakeholder input.

STIC Incentive Funding Grant Awarded for Local Aid Software Training

FHWA recently announced the award of a State Transportation Innovation Council (STIC) funding grant ($38,490) to support NJDOT’s Division of Local Aid and Economic Development in their efforts to deliver software training to NJDOT and local transportation agency staff to perform electronic plan reviews.

The STIC-funded training initiative will be provided in conjunction with NJDOT’s efforts to implement features of the Project Management and Reporting System (PMRS), initially launched in 2018, to establish electronic document management, electronic plan review, and other 21st century project management innovations to help make project management more efficient. The PMRS is also being designed to integrate with tools, such as Bluebeam® Revu® and geographic information systems (GIS), to enable collaborative plan review and georeferencing project data.

NJDOT is continuing with its plan for an enterprise innovation shift to electronic project management. The NJDOT Division of Local Aid is about to implement Phase 2 of the PMRS.   This implementation includes transitioning plan review from a paper-based process to an electronic process offering greater standardization and tracking capabilities. The Department’s shift is well-aligned with EDC-3’s e-Construction initiative and Local Aid’s objectives to improve program delivery through electronic review.

With this shift, Local Aid project managers will have easier access to project plans and documents from the District Offices in electronic formats from anywhere.  The innovations embedded in the platform and supporting software will enable easy file sharing, efficient project transfers, tracking comments and their resolution, and the ability to track and review previous project phases more efficiently.

The STIC funding will support the NJDOT Division of Local Aid in the development of a software training program for municipal and county engineers and Local Aid staff.  The training will be conducted over a two-month period with various morning and afternoon classes to offer flexibility in scheduling and attendance.  The initial “live” training sessions are expected to be recorded for future online, “on-demand” use.  The course development and training initiative will be carried out by a team that manages the Local Aid Resource Center in association with NJDOT Local Aid staff.

The training seeks to accomplish key goals aligned with the Department’s commitment to using technology to enable staff to be more efficient in accomplishing routine tasks and collaborative activities with external stakeholders.   Ultimately, the transition to an online tool is expected to reduce paper consumption as well as centralize and standardize project management activities.

Click on NJ STIC Incentive Funding Grants to get more information on the purpose, eligibility and uses for which the NJ STIC has sought incentive funding in recent years.


Lunchtime Tech Talk! WEBINAR: Evaluation of Precast Concrete Pavement Systems and State Specifications

On June 10, 2020, the NJDOT Bureau of Research hosted a Lunchtime Tech Talk! Webinar on "Evaluation of Precast Concrete Pavement Systems and State Specifications.” Dr. Yusuf Mehta, Director of Rowan University’s Center for Research and Education in Advanced Transportation Engineering Systems (CREATEs), introduced the presentation and acknowledged the contributions of individuals and other state DOTs to the research effort.  Dr. Daniel Offenbacker began the presentation with a description of the research study performed for NJDOT to identify, evaluate, and compare precast pavement systems, specifications, and practices currently in use for Precast Concrete Pavement (PCP). The study included an extensive literature review and surveys with Subject Matter Experts from various state DOTs that have experience with precast concrete pavement rehabilitations.

Dr. Offenbacker discussed the benefits and drawbacks of Precast Concrete Pavements.

Rigid pavements play an important role in highway infrastructure, primarily in regions with high traffic density such as New Jersey. NJDOT is continuously exploring innovative pavement rehabilitation strategies, such as Precast Concrete Pavement (PCP), that allow for faster and more durable rehabilitation of rigid pavements. Precast concrete is cast off-site to specifications and installed to match a particular location. Dr Offenbacker noted the benefits of precast concrete systems including quick installation that limits the duration of road closure and requires minimal interaction with drivers. The material is durable and long-lasting. Drawbacks include the high cost, challenges to installation requiring tight specifications, and limited capability among contractors and systems.

The researchers surveyed 17 states and followed up with 8 states that are using PCP systems. Other states shared experiences with systems in use, standards for manufacture and installation, permitting of new systems, and experiences with installation and performance. Eight different state specifications were identified that addressed panel fabrication, bedding and grout stabilization, installation tolerances, and encasement grout.

The research led to the conclusion that installation is critical to PCP performance. Failure is generally due to misalignment or poor leveling. Dr. Offenbacker described a proposed five-step system approval process to be used in New Jersey for acceptance of newly-developed precast pavements. The approval system included materials and slab approval, demonstration of system installation, and proof of performance. Recommendations included use of documented experiences from other states in establishing specifications and exploring development of a generic PCP system for New Jersey.

The research resulted in recommendations for a Precast Concrete Pavement approval process for use in New Jersey

Dr. Offenbacker noted the need for future work to investigate the long-term performance of PCP systems, to prepare a life cycle cost analysis to quantify the economic benefits, to assess the usefulness of intermittent precast systems in light of surrounding pavement deterioration, and to develop a training platform for contractors to insure proper installation.

Following the presentation, participants posed questions via the chat feature. Responding to a question about the use of planar vs. non-planar slabs, Dr. Offenbacker noted that the existing conditions of the roadway would determine which slab would be used to match the existing structure.

A participant asked if there was any criteria for choosing between rapid-set concrete and PCP. Dr. Offenbacker responded that there was no criteria yet for when one would choose one over the other.

A participant asked what Dr. Offenbacker considered the key takeaway from the surveys. He responded that installation was the key consideration. He emphasized the need to understand the economic benefits of PCP, which are starting to outweigh the benefits of other rehab techniques such as rapid-set.

In response to a question about training needed, Dr. Offenbacker noted that training is needed in the specific systems. California requires each contractor to go through a certification process if they want to use precast pavement systems on a regular basis.

A participant asked if deterioration of slabs adjacent to a replacement slab was due to the replacement slab. Dr. Offenbacker replied that the replacement slab would not cause deterioration if installed properly. The roadway may be deteriorating incrementally.

A participant asked if the Federal Highway Administration (FHWA) provided input on QA/QC for underslab grouting and grouting dowel bar slots. Dr. Offenbacker responded that there are thorough specifications for these elements and they are available in the final report.

In response to a question about whether there is a maximum and minimum size for PCPs and how that correlates to performance, Dr. Offenbacker noted that this has not been explored well yet. The typical length is 15 feet.

The presentation given by Dr. Mehta and Dr. Offenbacker can be downloaded here.

For more information about the research study, please access the final report and technical brief here.

For more information about research at Rowan University's CREATES, click here.

A recording of the presentation is also available here (or see right).

Lunchtime Tech Talk! WEBINAR: Dredging, Dredged Material Management and the NJ Marine Transportation System

On May 12, 2020, the NJDOT Bureau of Research hosted a Lunchtime Tech Talk! Webinar on "Dredging, Dredged Material Management and the New Jersey Marine Transportation System.” W. Scott Douglas, Dredging Program Manager in NJDOT’s Office of Maritime Resources (OMR), discussed the dredging process, management of dredged material, OMR’s asset management system, and dredging case studies.

Mr. Douglas discussed the extent of New Jersey's Marine Transportation System, and its significance to the local, and larger economy.

Mr. Douglas described the New Jersey Marine Transportation System (MTS) that includes all infrastructure and equipment that connects land-based transportation assets to navigable water. The MTS supports a $50 billion industry that encompasses international and domestic freight, commercial fishing, recreational boating, travel and tourism, marine trades and ferries. NJDOT is directly responsible for maintaining some 200 of the 600 nautical miles of engineered waterways that provide safe navigation pathways to and from the shore-based infrastructure, and provides dredged material management services for another 150 nautical miles of Federal waterway. Since Superstorm Sandy, OMR is the State’s lead agency for these responsibilities, providing planning, design, procurement and construction services and coordinating the State’s waterway emergency response.

The system is divided into three regions: the New Jersey/New York Harbor (the third largest port in the country), the Delaware River, and the Atlantic Shore where NJDOT takes a larger role. Much of their work involves managing clean dredge materials in shallow draft areas where there is little land on which to place the dredged material. Mr. Douglas described the various aspects of the dredging process including bathymetric surveys, sediment sampling and analysis, and permitting, and went on to explain uses of dredged material.

As a natural part of the aquatic ecosystem, sediment is a resource. The Office of Maritime Resources works to reuse the material in various ways depending on the nature and composition of the sediment. Mr. Douglas offered several examples of reuse such as construction fill, beach replenishment, landfill capping, and brownfield redevelopment. The OMR is exploring the use of sediment to increase shoreline resiliency through marsh and dune restoration and other shoreline stabilization techniques, island creation, dredged hole replacement, and habitat creation.

The talk highlighted several facets of collecting, tracking, and dispersing dredged materials.

Mr. Douglas discussed his agency’s Maritime Asset Management tools developed to evaluate cost, conditions, and to help prioritize the Office’s work. Their Waterway Linear Segmentation database, comparable to the roadway Straight Line Diagrams, is a first in the nation for maritime asset management. OMR is assembling a dredged material database. Deployment of these tools is anticipated later this year. OMR’s Maritime Asset Management Systems comprises these two tools and produces plans based on current and future conditions, cost, and availability of dredge system management. The output is similar to the asset management reports used by highway and bridge engineers to assist management in decisionmaking.

Successes of the state’s channel dredging program include 54 channels cleared and 45 nautical miles of waterway opened. Mr. Douglas highlighted three dredging case studies including projects in the Port Jersey Channel, Shark River, and Upper Barnegat Bay. In 2020, OMR has four ongoing projects and four planned projects to open a total of 25 channels.

Participants posed questions via the Q&A feature. Mr. Douglas was asked what quality controls are in place before dredged material is moved. He noted that New Jersey has one of the most stringent systems in place in the country. NJDEP has a list of contaminants related to locations. They test both the sediment before it is moved, and the water, and a mixture of sediment water. If the material is stabilized and placed upland, it is exposed to lab testing and leachate tests on site. Another participant asked if dredging stirs up contaminants. Mr. Douglas replied that it can, and that the rigorous testing is designed to address the possibility. He noted the distinction between navigation dredging to clear a channel and environmental dredging conducted to clean contaminants from a waterway.

In response to a question concerning locations of island creation, Mr. Douglas stated that a group led by the US Fish & Wildlife Service is looking into potentially creating islands in Barnegat Bay.

A participant asked if dredged material could be used in new embankments and walls that NJDOT is building throughout the state. Mr. Douglas responded that the biggest barrier is cost. Straight fill is less expensive and easier to schedule; timing of highway projects with maritime projects has been difficult.

A participant wondered how the required dredge depth is verified once it is completed? Dredge depth is determined before dredging begins. Generally, channel depth has been determined for the entire state. Usually the depth changes only if conditions change, such as would be required with the introduction of larger vessels needing access to ports.

In response to a question concerning work continuing during the COVID-19 outbreak, Mr. Douglas noted that work is continuing and inspectors are on site every day following appropriate and requisite protocols.

The presentation given by Mr. Douglas can be downloaded here.

A recording of the webinar is available here, (or see right).

Federal Highway Administration Releases Second EDC-5 Progress Report

The second EDC-5 Progress Report summarizes the deployment progress of the 10 innovations in the fifth round of the the Federal Highway Administration’s Every Day Counts program for July through December, 2019. The EDC program coordinates the deployment of new strategies and technologies within State Departments of Transportation. These strategies help transportation stakeholders to shorten the project delivery process, enhance roadway safety, reduce traffic congestion, and integrate automation to better serve the nation.

The national report analyzes each state’s implementation stages for the 10 innovations using charts and maps. The report also presents the number of states that have demonstrated, assessed, or institutionalized innovations, and presents goals for how many states should reach these stages by December 2020. New Jersey Department of Transportation has fully institutionalized Crowdsourcing for Operations, Project Bundling, and Unmanned Aerial Systems. The agency has reached the assessment stage for Safe Transportation for Every Pedestrian, and the demonstration (testing and piloting) stage for Advanced Geotechnical Exploration Methods and Collaborative Hydraulics. Two other innovations are in the development phase.

FHWA compiles a progress report every six months regarding the state of practice for the current round of EDC initiatives. An online version of the EDC-5 Progress Report can be found here.

NJ Transportation Agencies Featured for Their Innovative and Virtual Public Involvement Approaches

FHWA promotes virtual public involvement and other innovative public involvement tools through its Every Day Counts-5 innovations. FHWA notes several benefits of a robust public involvement process that employs technology to bring public involvement opportunities to people. These techniques tend to be more efficient and cost-effective, help to accelerate the project delivery process by identifying issues early in the process, ensure that the needs and desires of community members are heard in a collaborative process, and improve project quality by reaching individuals who might otherwise not be engaged.

FHWA is developing a series of short videos highlighting virtual public involvement tools, as well as other innovative strategies, in use at state and local transportation agencies. Approaches in use by New Jersey Department of Transportation (NJDOT) and North Jersey Transportation Planning Authority (NJTPA) feature in several of these videos.

NJTPA used Set the Table, a meeting-in-a-box, to gather input from millennials for the agency’s long-range regional plan (Plan 2045). Individuals hosted small dinner parties for their peers (aged 18-30). Boxes, similar to pizza boxes, held snacks, and conversation cards on seven focus areas related to transportation. Twenty events were held, reaching over 200 individuals. Participants voiced an interest in staying involved in the planning process.

To supplement print and other media advertisement to gather public input for Plan 2045, NJTPA used online ads geo-targeted to the region. These ads invited people to participate in an online survey covering the Plan’s seven focus areas. The campaign reached 1.6 million people over six weeks and received a robust response. The agency found that this virtual engagement strategy not only reached people where they were, but helped to inform a large number of people about the transportation planning process and the agency.

In-person public engagement events continue to have real value. To encourage public involvement on the Pulaski Skyway rehabilitation project, NJDOT used pop-up outreach at the Liberty Science Center in Jersey City. During construction, lane closures on the highway would affect 35,000 regional commuters and local residents on a daily basis. Wishing to reach a local population, many of whom were unlikely to attend a community public involvement meeting, NJDOT brought the meeting to them. A booth presented information and displayed a piece of the deteriorating bridge to explain to children and adults the importance of the highway project.  

In delivering these examples, FHWA emphasizes the need for transportation agencies to expand their outreach efforts to engage people in their everyday lives.

How New Jersey Counties are Reducing Rural Roadway Departures

Reducing fatalities on rural roads is a key challenge for transportation agencies in the United States, where roadway departures on rural networks account for one-third of traffic fatalities. The Federal Highway Administration (FHWA) has identified safety countermeasures that are proven to improve rural roadway safety and reduce the number of traffic deaths. In the fifth round of the agency’s Every Day Counts (EDC) State-based model, FHWA identified “Reducing Rural Roadway Departures” as a proven, yet underutilized, innovation. The four pillars of the initiative are: all public roads, proven countermeasures, a systemic approach, and safety action plans. FHWA Proven Safety Countermeasures for rural roadway departures fall into three broad categories: helping drivers stay in their lane, reducing the risk of a crash with lane departures, and minimizing the severity in the case of a crash. Specifically, FHWA safety countermeasures related to rural roadway departures include rumble strips and stripes, SafetyEdgeSM, high friction surface treatment, and backplates with retroreflective borders. A recent FHWA video, Focusing on Reducing Rural Road Departures, provides information on how these low-cost measures help drivers stay in their travel lanes and reduce the potential, or minimize the severity, of rural roadway crashes.

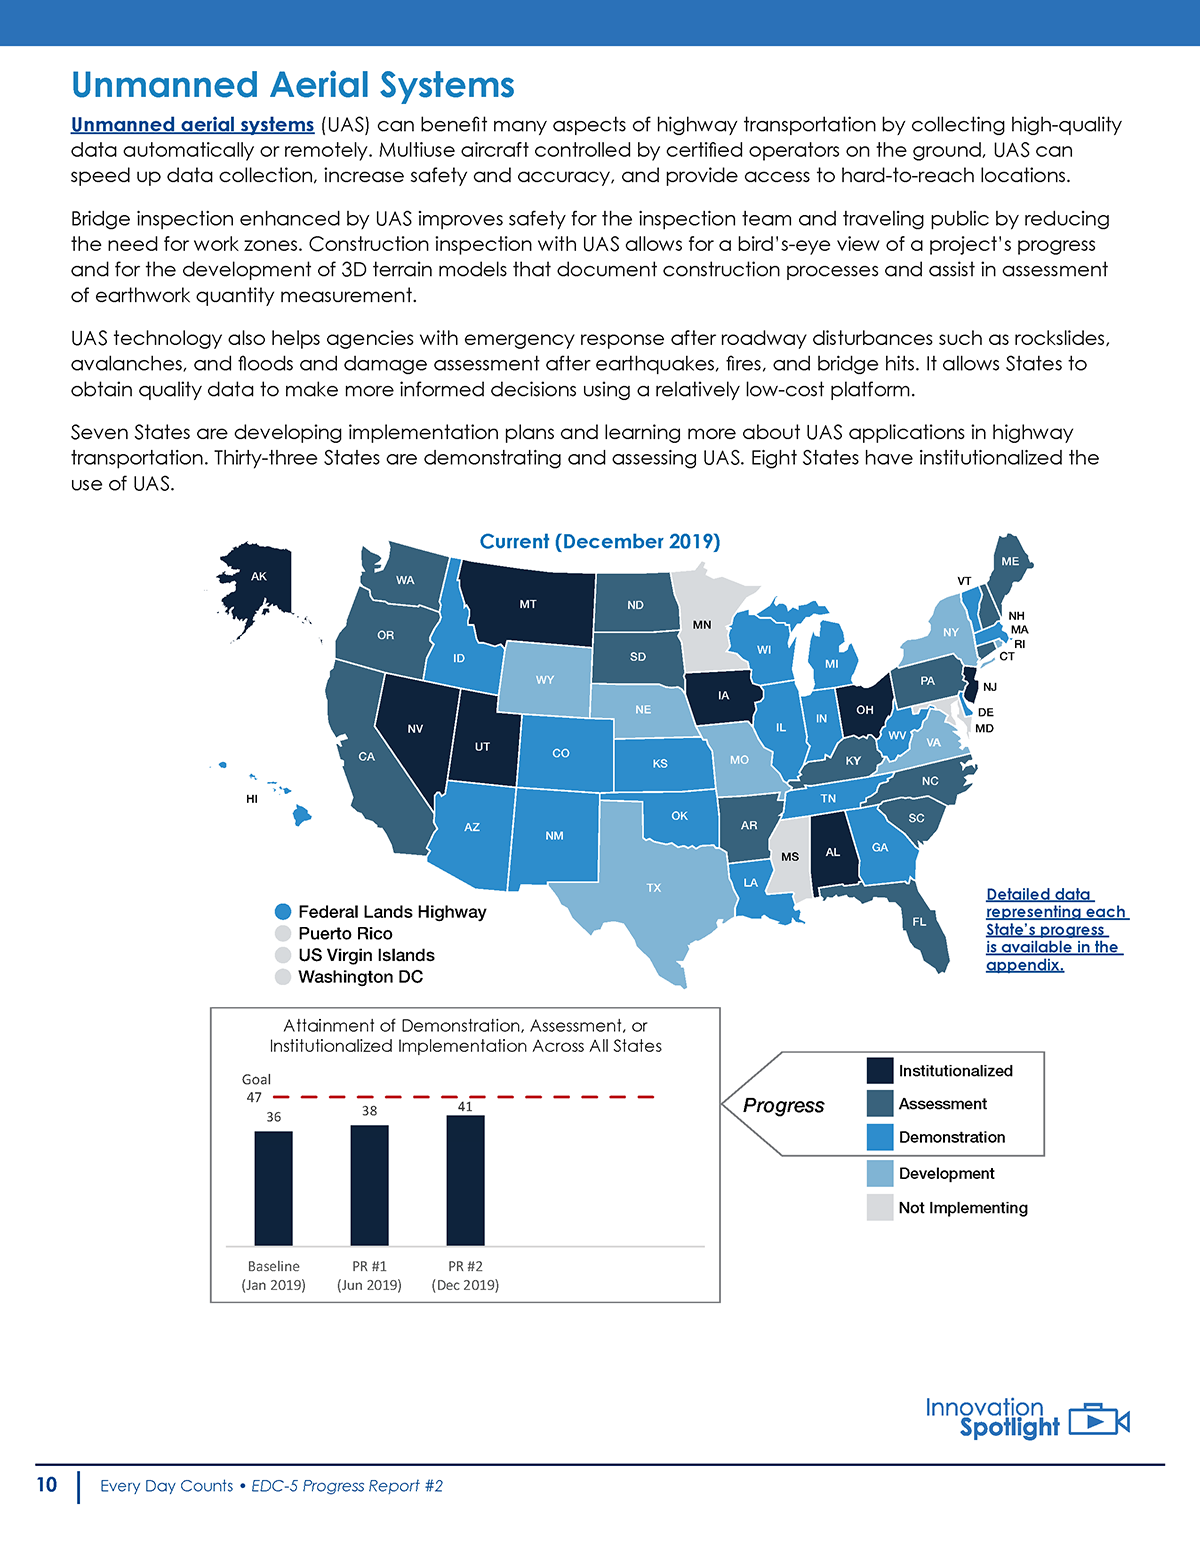
Through EDC, FHWA seeks to support rapid deployment of identified initiatives at the State and local level, which results in cost, time, and resource savings. As of December 2019, New Jersey is in the “development” phase of the Reducing Rural Roadway Departures initiative; NJDOT is collecting guidance and best practices, while building support with partners and stakeholders to develop an implementation process. The goal is to reach the “demonstration” stage by the end of EDC-5 (December 2020), when they would begin testing and piloting the innovation.

In order to achieve this goal, NJDOT seeks to improve the knowledge of rural roadway facility owners and maintainers through training, with the assistance of the FHWA Resource Center. In 2018 and 2019, FHWA and NJDOT hosted a series of Local Safety Peer Exchanges at which engineering staff from Cumberland and Somerset counties shared their experience with implementation of countermeasures on high risk rural roads (HRRR).

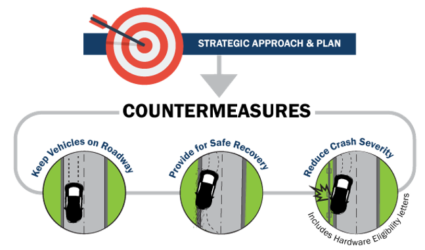
FHWA’s Strategic Approach and Plan to reduce roadway departure crashes and fatalities. Photo Source: FHWA, 2019.

The Cumberland County Engineering Office manages infrastructure that includes 540 miles of county roads, 50 traffic signals and flashers, 54 bridges, and 169 minor bridges. One important source of funding for their work is the Highway Safety Improvement Federal-aid Program (HSIP). The purpose of HSIP is to achieve a significant reduction in highway fatalities and serious injuries on all public roads, using a data-driven, strategic approach focused on improving performance. The County focuses on two types of projects for HSIP: systemic projects and “hot-spot” projects. Systemic projects apply a given improvement method over a large number of applicable locations in order to deter “random” crash events and reduce risk across an entire roadway system.

Hot-spot projects need more in-depth data collection and analysis to determine appropriate site-specific improvements related to crash history. To collect data for hot-spot projects, South Jersey Transportation Planning Organization (SJTPO), the regional Metropolitan Planning Organization (MPO) for Cumberland County, worked with Rutgers University’s Center for Advanced Infrastructure and Transportation (CAIT) to use NJDOT’s Plan4Safety multi-layered decision support tool to create four network screening lists for the region. Each list provided weighted scores for a given timeframe based on a location’s number and severity of crashes. The four screening lists identify pedestrian intersection hot spots, pedestrian corridor hot spots, intersection hot spots, and HRRR hot spots.

Selecting the appropriate countermeasure is critical to project success. When using network screening lists, the countermeasure should address the particular type of crash occurring at the location, while countermeasures used with the systemic approach should address the specific geometric trait(s) that are related to the specific crash type.

Cumberland County highlighted two countermeasures at the Peer Exchange: centerline rumble strips and high friction surface treatment on horizontal curves. Centerline rumble strips reduce the risk of cross centerline crashes and are often part of a systemic approach. With the help of NJDOT’s Bureau of Transportation Data and Safety, SJTPO created a candidate list of potential centerline rumble strip locations. NJDOT’s criteria limit installation to two-lane urban or rural roadways with a 20-foot minimum pavement width, and a speed limit of 35 mph or greater. In addition, Cumberland County limited installation to asphalt roadways 10 years old or less in less dense residential neighborhoods due to the noise the rumble strips produce. Based on these criteria, the County selected approximately 150 roadway miles across 11 municipalities. Installation was performed at night to lessen the impact on traffic, improve safety conditions for construction workers and inspectors, and shorten installation time.

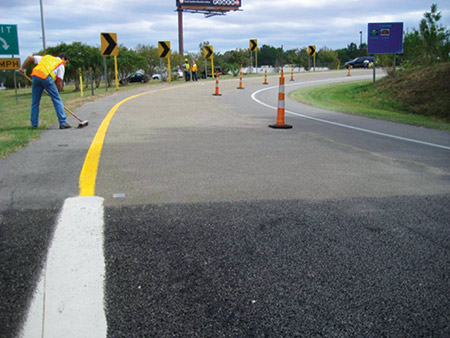
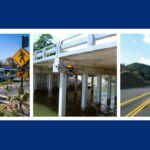
HFST installation at a horizontal curve. Photo Source: FHWA, 2018.

The second method, high friction surface treatment (HFST) on horizontal curves, addresses the challenges that horizontal curves pose due to the change in alignment that can cause issues for driver navigation, especially at night or in inclement weather. According to data analysis cited by SJTPO, 28 percent of fatal crashes nationwide occur on horizontal curves. HFST compensates for the high friction demand at the curves in areas where the current pavement condition does not adequately support operation speed, due to a number of factors such as sharp curves, wet conditions, polished roadway surfaces, inadequate cross-slope design, and driving speeds above the curve advisory speed. HFST are proven to reduce wet road crashes by 52 percent and curve crashes by 24 percent according to the FHWA. Additionally, these treatments are safe for all vehicle types and have high durability. However, the county engineer also noted the high unit cost and the lack of contractors within the region capable of HFST installation. When properly installed, the pavement life is equal to, our greater than, asphalt pavement but improper installation potentially limits the usefulness and life expectancy of the pavement treatment.

Locations were selected from the HRRR list, along with spots familiar to the Engineering Department based on geometry, crash history, residential input, and municipality information. Additionally, pavement condition was taken into consideration as a factor that could affect the treatment’s durability.

Cumberland County staff highlighted the importance of updating and upgrading existing safety features during the project such as size, location, spacing, and retroreflectivity of signage. They noted important considerations moving forward: data used in the network screening lists is aging; the rumble strip projects had a long delivery timeline of 22 months from application submission to construction notice to proceed; and the centralized project review process eliminated interactions with the local public agency which tends to have the most detailed knowledge of the project area.

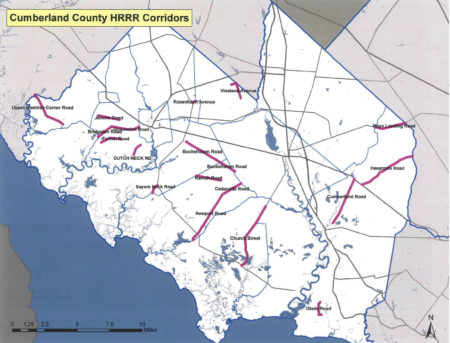
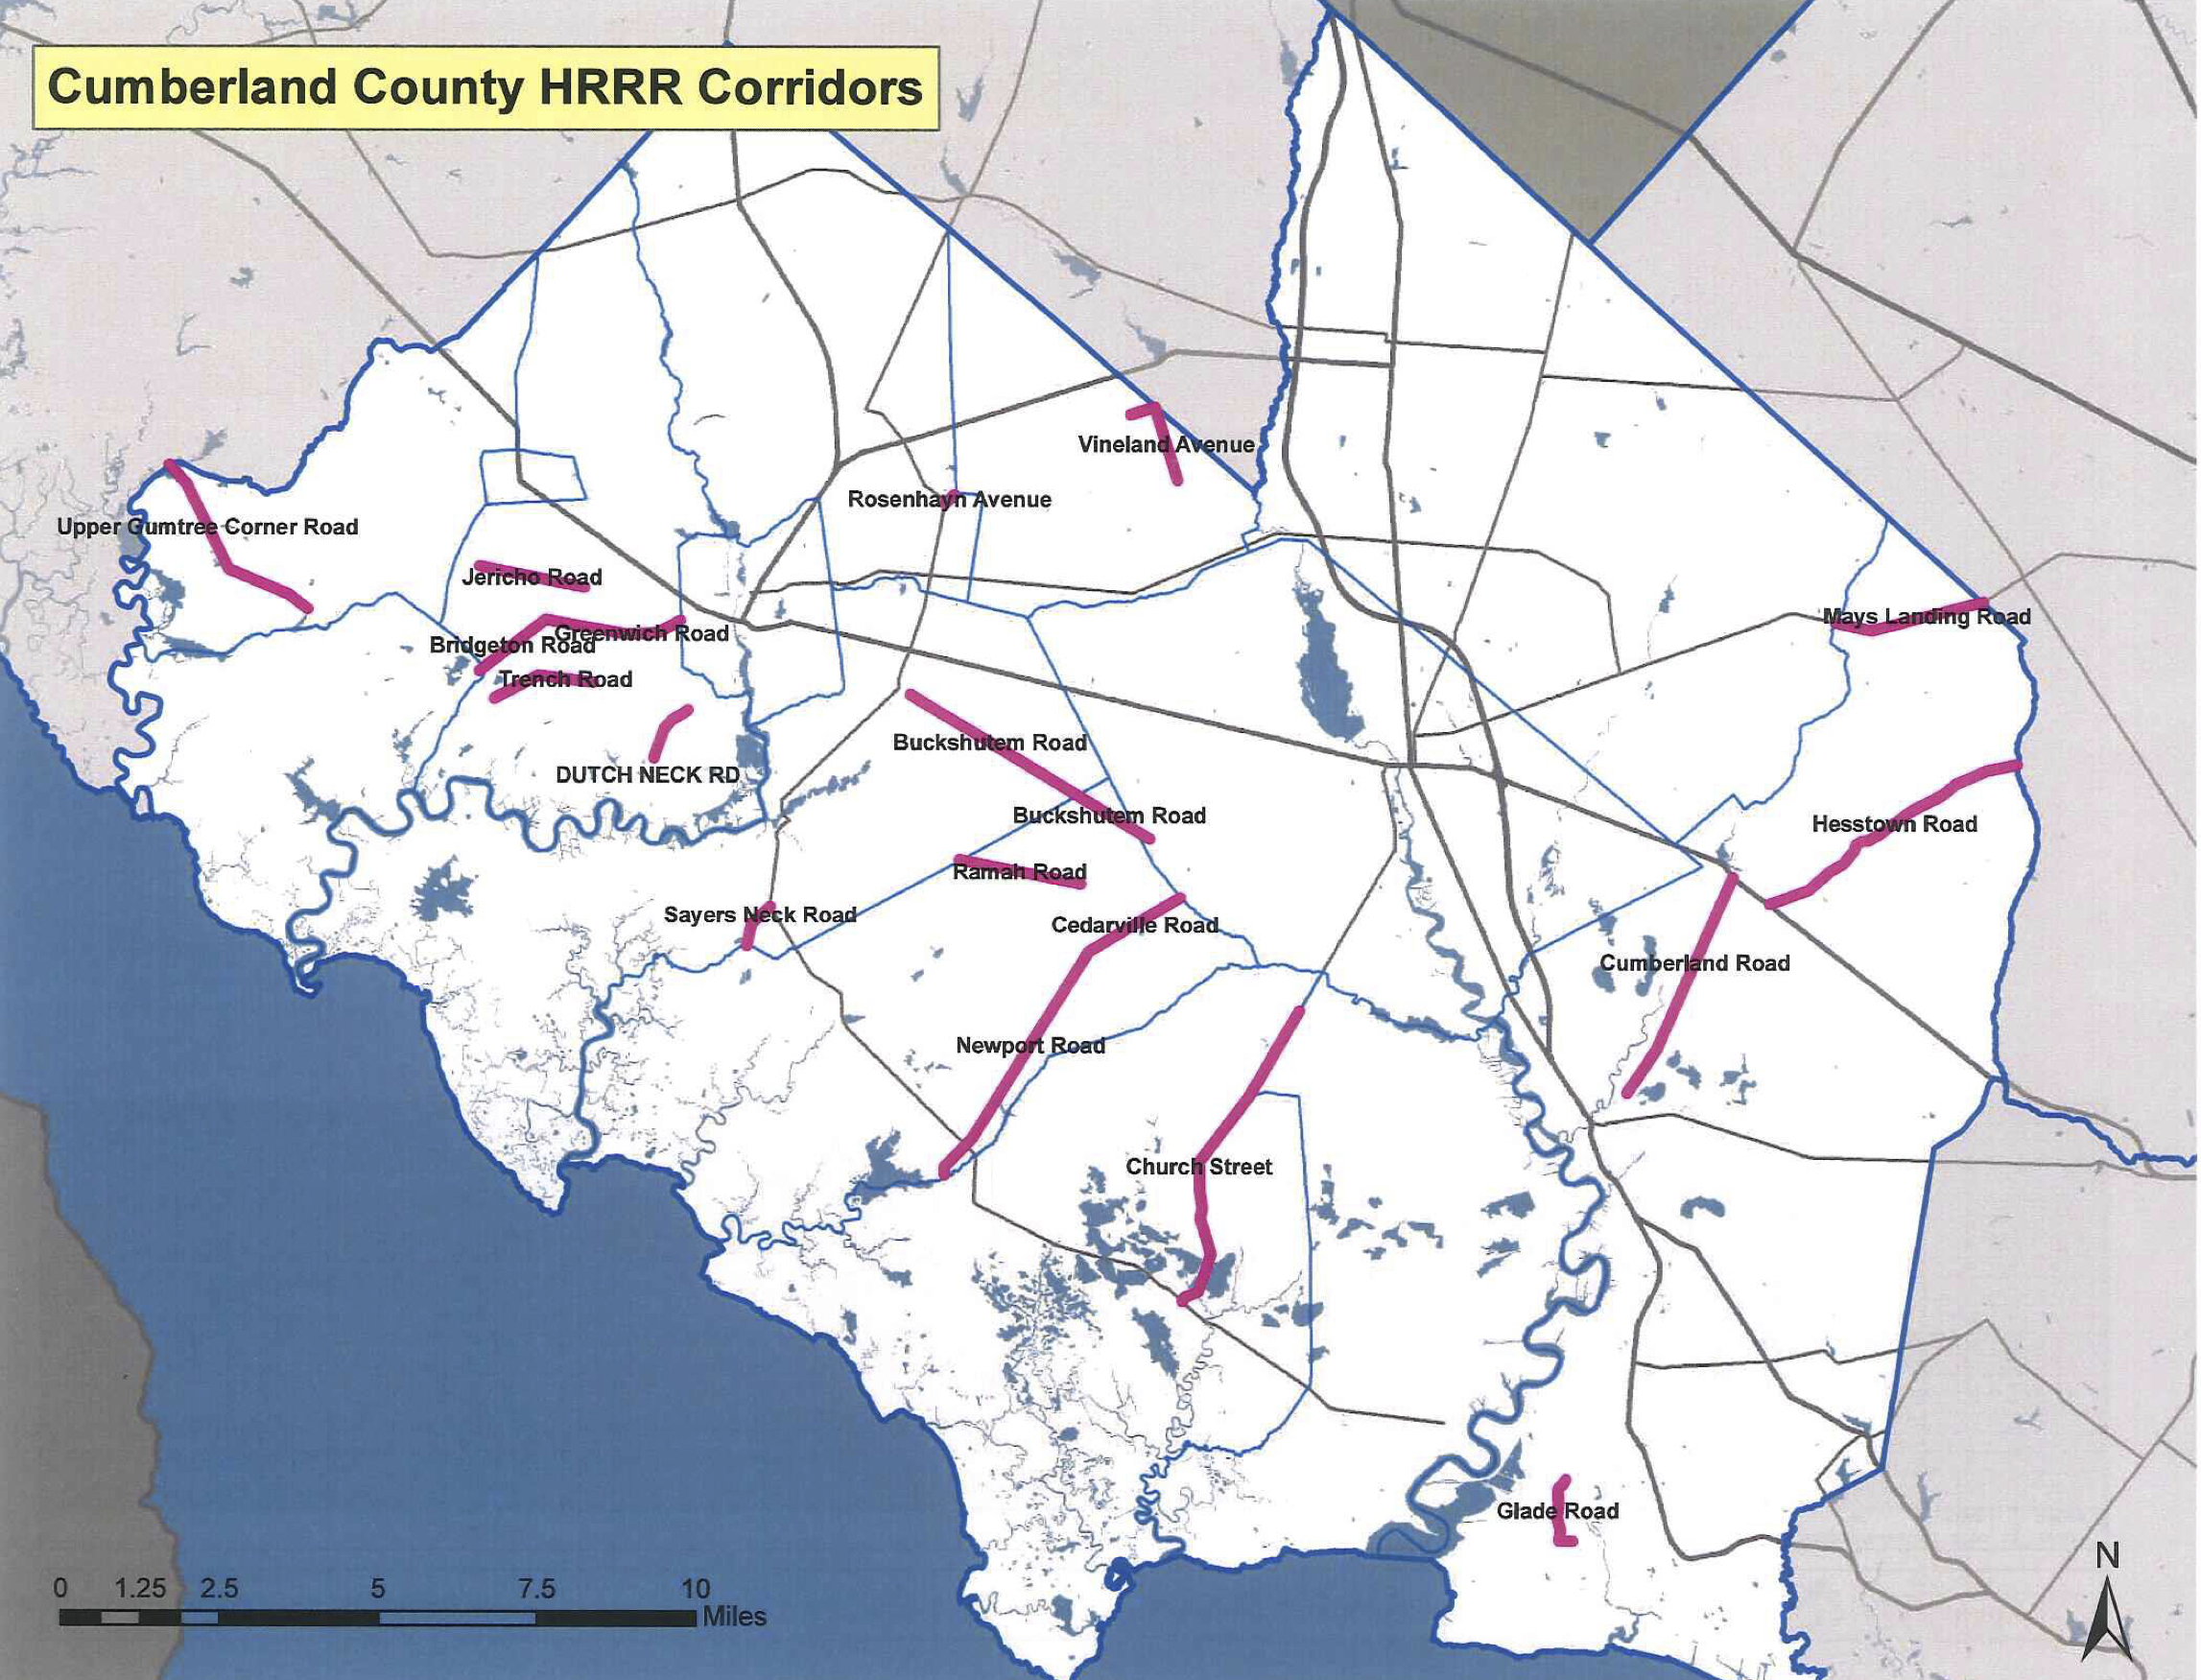
Cumberland County High Risk Rural Roads Locations in Cumberland County. Photo Source: Whitaker, 2018.

A representative of the Somerset County Engineering Office shared their systemic safety approach to horizontal curves with high friction surface treatment. The Engineering Office manages infrastructure for 250 miles of county roads, 193 traffic signals, and 762 bridges, along with county sites, facilities, and parks. Annually, their work includes 15 miles of road resurfacing, 1.2 miles of road reconstruction, 7 bridge replacements, installation or upgrade of 10 traffic signals, and replacing more that 150 ADA curb ramps. The catalyst to pursue pavement friction treatments was the availability of crash data from the Plan4Safety crash database, which allowed Somerset County and their MPO, North Jersey Transportation Planning Authority (NJTPA), to analyze crash trends in the region in order to plan for infrastructure improvements based on need and types of issues.

Based on this analysis, the county identified and prioritized horizontal curves where they decided pavement friction treatments would be the best countermeasure. The next questions they had were: what is the correct treatment method; when is treatment appropriate; and how do they determine the length of need on the horizontal curve. Initially, the county used micro milling which provides a high friction surface to reduce “run-off’ road crashes for a low cost of installation. Downsides for the treatment include a short life expectancy, complaints from motorcyclists and bicyclists, and negative public perception associated with milling a newly paved surface.

Based on this experience, the county turned next to high friction surface treatment as an option that is safe for all vehicle types and has a longer life expectancy than micro milling. As did Cumberland County, Somerset County noted the treatment’s high cost at $35-65 per square yard and the specialized nature of the installation. Somerset County’s evaluation method for determining when HFST should be used requires the following data: centerline alignment geometry, roadway cross slope, road profile slope, posted speed limit, and posted curve advisory plate speed. The resulting evaluation produces friction ranges to guide the action taken.

Initial micro milling treatment in Somerset County. Photo Source: Bates Smith, 2017.

Somerset County found a comparison of crashes in the years prior to the treatment with crash data from the year after the treatment revealed a significant reduction in crashes, although they cautioned that there may be other factors at play. In the case of Chimney Rock Road, annual crashes dropped 84 percent from 73 to 12 for the year after HFST was applied to 5 curves on a 1-mile road segment. Looking to the future, the county plans to prioritize high crash locations for evaluation to either implement additional signage or HFST, based on data from GIS crash mapping, along with the NJ Regional Curve Inventory and Safety Assessment for the NJTPA region. They additionally highlighted important resources that have emerged, including the FHWA’s HFST Curve Selection and Installation Guide.

Cumberland and Somerset counties are just two examples of rural roadway departure safety improvements happening around the state. In the NJTPA region, Monmouth County received $2,967,000 from NJTPA’s FY 2017-18 High Risk Rural Roads (HRRR) Program for corridor improvements on Stage Coach Road in Upper Freehold Township, including the application of high friction surface treatment, safety edging, and centerline rumble strips. To help support and expand these efforts, NJDOT will be holding train-the-trainer events at DVRPC, SJTPO, and NJTPA later this year for county and municipal representatives, MPO staff, and NJDOT staff. This training will help New Jersey advance to the next stage of this EDC-5 initiative and improve safety on rural roads throughout the State.

Featured Image Source: FHWA, 2016.

Resources

Bates Smith, P. (2019). Pavement Friction Surface Treatments. Retrieved from https://www.njdottechtransfer.net/wp-content/uploads/2019/04/E_Somerset-PAVEMENT-FRICTION-surface-treatments-3-21-19.pdf

FHWA. (2019). Reducing Rural Roadway Departures. Retrieved from https://www.fhwa.dot.gov/innovation/everydaycounts/edc_5/roadway_departures.cfm

FHWA. (2020). Proven Safety Countermeasures. Retrieved from https://safety.fhwa.dot.gov/provencountermeasures/

FHWA. Focus on Reducing Rural Roadway Departures (FoRRRwD) Overview Video. (2019). Retrieved from https://www.youtube.com/watch?v=WfdBrrl0WwU&t=87s

NJTPA. (2020). Local Safety Program/High Risk Rural Roads. Retrieved from https://www.njtpa.org/localsafety.aspx

SJTPO. (2020). Highway Safety Improvement Program – Safety Infrastructure. Retrieved from https://www.sjtpo.org/hsip/

Whitaker, D. W. (2018). Systemic Safety Improvements. Retrieved from https://www.njdottechtransfer.net/wp-content/uploads/2018/06/Cumberland-Systemic.pdf

DVRPC’s Sidewalk Inventory and Crowdsourcing Platform

Improved walkability and accessibility help to create vibrant and healthy communities. The Delaware Valley Regional Planning Commission (DVRPC), the metropolitan planning organization for Greater Philadelphia and Burlington, Camden and Gloucester Counties in New Jersey, is seeking to understand the region’s pedestrian infrastructure through the development of an online inventory, map, and platform for public participation and crowdsourcing. According to DVRPC, the goal of the project is, “to assist with planning efforts to help communities in the region become more pedestrian-friendly and accessible.”

Options from the DVRPC Pedestrian Portal homepage

DVRPC hopes that these new tools will assist the agency and its partners to more efficiently identify and prioritize walkability improvements across the region. The online platform is expected to improve asset management and support various regional planning and place-specific initiatives such as Safe Routes to School, pedestrian safety audits, plans for healthy communities, and strategies for providing safe and equitable access to public transportation.

The need for better sidewalk data was suggested by DVRPC staff during a data roundtable meeting and became the impetus for the Sidewalk Inventory Project, according to DVRPC’s Kim Korejko. The MPO had already conducted work on bicycle infrastructure in the region, but lacked data on pedestrian infrastructure. The absence of a good inventory of sidewalk data was also felt by agency staff who had previously worked on transit station area walkability studies. To address this gap, DVRPC resolved to assemble a seamless and standardized GIS dataset of sidewalks in the region.

DVRPC sought state funding from both Pennsylvania and New Jersey to start the project in 2018. The planned platform for crowdsourcing and community involvement was well-aligned with “PennDOT Connects,” a Pennsylvania Department of Transportation initiative that supports collaboration with communities to sustain and expand mobility in the state. This alignment was a principal reason that the project received funding from Pennsylvania. The crowdsourcing platform also aligns well with the Federal Highway Administration EDC-5 initiative to advance crowdsourcing for operations.

Chester and Montgomery Counties in Pennsylvania had previously developed sidewalk databases, but the counties did not follow a standardized methodology for data visualization. As a result, DVRPC needed to rework the data for integration into the new dataset. Philadelphia County was also assembling sidewalk data at the time, but differences in data methodology along with the county’s scale have led to delays in assembling and publishing their inventory.

A visualization of Chester and Montgomery counties original sidewalk databases

The DVRPC sidewalk inventory is not the first of its kind in the country. TriMet, Portland, Oregon’s transit operator, undertook a pedestrian network analysis in 2011 with the goal of improving pedestrian access to transit stops, especially in the suburbs surrounding the city. Once compiled, TriMet was able to put forth 10 pedestrian access projects to improve pedestrian access to transit stops, the majority of which were bus stops, but also to light rail and commuter rail stations. TriMet is continuing its pedestrian network analysis, and is seeking public comment on transit stops with low pedestrian accessibility. DVRPC also cited Denver and Seattle’s sidewalk inventories as inspiration for the Philadelphia project.

The TriMet Pedestrian Network Analysis can be found here.

DVRPC staff were surveyed prior to the assembly of the database to explore how they would use the tool and what features they would want:

  • Sidewalk mileage and gaps — 60 percent said they would use the database to calculate sidewalk mileage and gaps to set goals and measure progress for improved network walkability.
  • Pedestrian routing and modeling — 57 percent sought to use the database for pedestrian network routing and modeling
  • Visualization — 51 percent would use it to help visualize the sidewalk data.

In terms of the data features captured by the inventory and mapping, 83 percent of staff said that they wanted to know sidewalk presence, 70 percent wanted to know the sidewalk conditions, and 59 percent wanted to know of the presence of curb ramps.

A look at the sidewalk inventory in Camden, New Jersey

Out of 30 responses, 29 staff members stated that they wanted to know the presence of crosswalks, 24 wanted to see what pedestrian signalization types are present at intersections, and 15 wanted to know the characteristics of crosswalks in the network.

DVRPC has published a sidewalk inventory, including curb ramps and crosswalks for Bucks, Chester, Delaware, and Montgomery Counties on the Pennsylvania side of their region. A sidewalk inventory for the New Jersey portion of the region was added in February 2020. Release of the Philadelphia County inventory is expected in fall 2020.

To leverage its limited capacity to maintain the database, DVRPC is seeking to crowdsource sidewalk conditions by engaging the public to help keep the map up-to-date and accurate. Community members will be able to create an account to access the editing platform to add new infrastructure and attributes to the database.

In addition, DVRPC hopes to identify and maintain a list of potential pedestrian facility projects through its Pedestrian Facilities and Planning Portal. The portal will provide a space for collaboration between local and regional planning partners working on pedestrian improvements. The secure online interface will (1) provide access to and accommodate maintenance of the regional sidewalk inventory by local entities and (2) allow local and regional planning partners to share their pedestrian facility priorities (such as those identified in their comprehensive/ master plans or those for which they seek grant funding) on an interactive map.

While the planning and editing portals are not yet active, the sidewalk, crosswalk, and curb ramp shapefiles can be downloaded through the DVRPC GIS portal for those wishing to use the inventory for analysis. Once the data has been fully assembled, DVRPC plans to undertake further analyses of pedestrian access to transit and bus stations.

The Greater Philadelphia Pedestrian Portal, which includes the currently available New Jersey and Pennsylvania inventories, can be found here.

A view of the attributes for a sidewalk in Glassboro, New Jersey

Resources:

City of Seattle. “Access Map, Walkability.” https://www.accessmap.io/.

Delaware Valley Regional Planning Commission. “The Greater Philadelphia Pedestrian Portal.” https://walk.dvrpc.org/.

Korejko, Kim. March 2018. DVRPC’s Sidewalk Inventory Project. Presentation. https://www.dvrpc.org/Walk/pdf/DVRPCSidewalkInventory_websiteMar2018.pdf.

Pennsylvania Department of Transportation. “PennDOT Connects.” https://www.penndot.gov/ProjectAndPrograms/Planning/Pages/PennDOT-Connects.aspx.

TriMet. “Improving Pedestrian Access to Transit.” https://trimet.org/walk/.

Walk Denver. June 2016. “Congratulations to the WALKscope Data Challenge Winners!” http://www.walkdenver.org/congratulations-to-the-walkscope-data-challenge-winners/