UHPC for Bridge Preservation and Repair is a model innovation in the latest round of the FHWA’s Every Day Counts Program (EDC-6). UHPC is recognized as an innovative new material that can be used to extend the life of bridges. Its enhanced strength reduces the need for repairs, adding to the service life of a facility.
This Q&A article has been prepared following correspondence with Pranav Lathia, an NJDOT Supervising Engineer, Structural & RR Engineering Services, to learn more about current initiatives to test and deploy UHPC on the Garden State’s bridges. The Q&A correspondence has been edited for clarity.
Q. What is Ultra High Performance Concrete (UHPC), and why is it particularly useful for bridge preservation and repair (P&R)?
Ultra High Performance Concrete (UHPC) is a new class of concrete which contains extraordinary properties of durability and strength. UHPC is a cement based composite material, which consists of steel fiber reinforcement, cement, fine sand, and other admixtures. UHPC is a useful alternative for bridge repairs and preservation due to its long-term durability, which will minimize repairs to a specific structure over time.
Q. Why, in some cases, is UHPC a better application than traditional treatments?
Due to its chemical properties UHPC has a compressive strength of seven times that of regular concrete. Therefore, UHPC is mostly used for thin overlays, closure pours, link slabs, beam end repairs and joint headers.
Q. What are some advantages of UHPC?
UHPC overlays appear to have many ideal properties for deck surface, including superior bond strength, compressive strength, lower permeability, greater freeze-thaw damage resistance, good abrasion resistance, and rapid cure times, among others.
Q. What are some disadvantages to UHPC?
There are some disadvantages to UHPC. UHPC has higher material costs which has to be a factor in the Department's decision process. A life-cycle cost analysis is appropriate for making a determination of whether it is a cost-effective alternative for the Department. Fresh UHPC does not bond well to hardened UHPC, therefore careful consideration for joint construction is needed, including reinforced staging joints. There is also limited test data for construction materials to determine their ability to perform well with UHPC. In addition, the NJ construction workforce is not very familiar with the use of UHPC as an overlay.
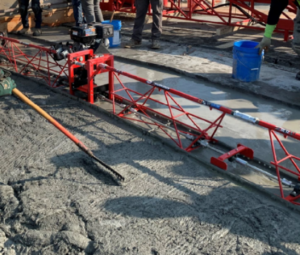
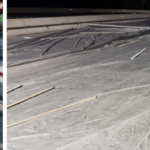
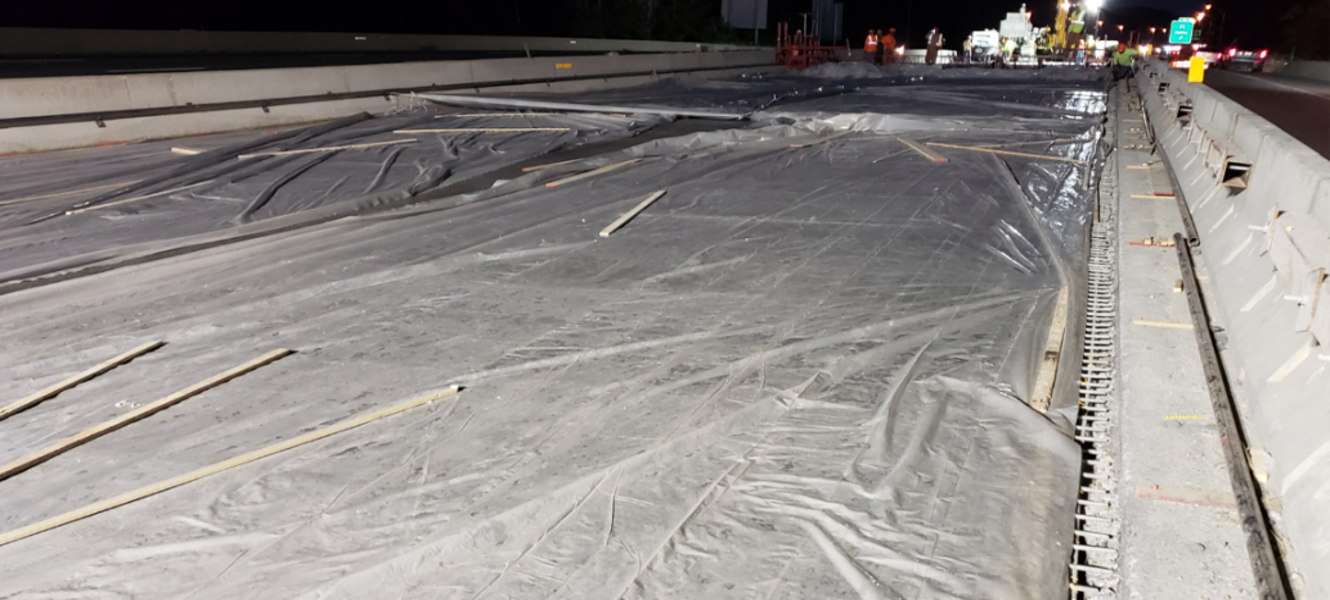
Figure 1: It is imperative that contractors establish the proper amount of UHPC fluidity to maintain the bridge deck’s grade. Courtesy of NJDOT.
Q. When is UHPC perhaps not an appropriate solution?
UHPC would not be an appropriate solution for a full deck replacement, superstructure replacement, or total replacement.
Q. What are some examples of UHPC’s previous implementations?
Before our initiation of a pilot program, UHPC had only been used for ABC (closure pours) and pre-cast connections in New Jersey since 2014.
Q. How is NJDOT approaching the potential implementation of UHPC for bridge preservation and replacement (P&R)?
Currently NJDOT uses UHPC ABC (closure pours) for prefabricated superstructures. NJDOT has launched and implemented a UHPC Overlay Research Project in conjunction with the design engineering firm, WSP Solutions.
Q. Can you describe the how UHPC is applied in the pilot project for P&R?
In the pilot project, a 1.5” UHPC overlay has been applied to four NJDOT structures. The UHPC overlay was constructed on the bridge deck along with the reconstruction of deteriorated deck joints.
Q. What bridges were selected, and what was the rationale for their selection?
Four structures were chosen for the UHPC overlay pilot program and split into two separate contracts, Contract A (North) and Contract B (South):
- I-295 NB & US 130 NB over Mantua Creek in West Deptford, Gloucester County
- NJ 57 over Hances Brook in Mansfield, Warren County
- I-280 WB over Newark Turnpike in Kearny, Hudson County
- NJ 159 WB over Passaic River in Montville, Morris County
The selected bridges for the pilot program were in good condition to leverage the perceived long life-span of UHPC and not allow other factors to limit the potential service life. Eight candidate structures were fully evaluated and tested before the four structures were advanced. The bridges that were ultimately selected varied in their age, size and design. All the bridges had asphalt overlay.
Q. What were the evaluation criteria used for the selection of the pilots?
All structures included in the program were evaluated for suitability based on the structural evaluations, chloride content within the deck, feasible construction stages, traffic analysis results, and existing overlay depths. Chloride content was obtained from the concrete cores we had completed on each bridge deck.
Q. What best practices were learned from the pilot projects?
It was best to install the UHPC overlays in locations that UHPC would serve as the final riding surface. The Department felt that an UHPC overlay should be constructed on structures which had an existing asphalt overlay. A thinner overlay could have been provided to cut material costs. Using a pan mixer, the supplier had the ability to control the fluidity of the UHPC, which is extremely important when dealing with extreme temperatures and high deflection/ movement structures. A flow test should continue to be required to verify the proper mixing and consistency of the UHPC overlay material.
Q. Were there any innovations from the implementation of the pilot projects?
A deeper overlay could be considered as a viable alternative for structures that need major deck rehabilitation or replacement.
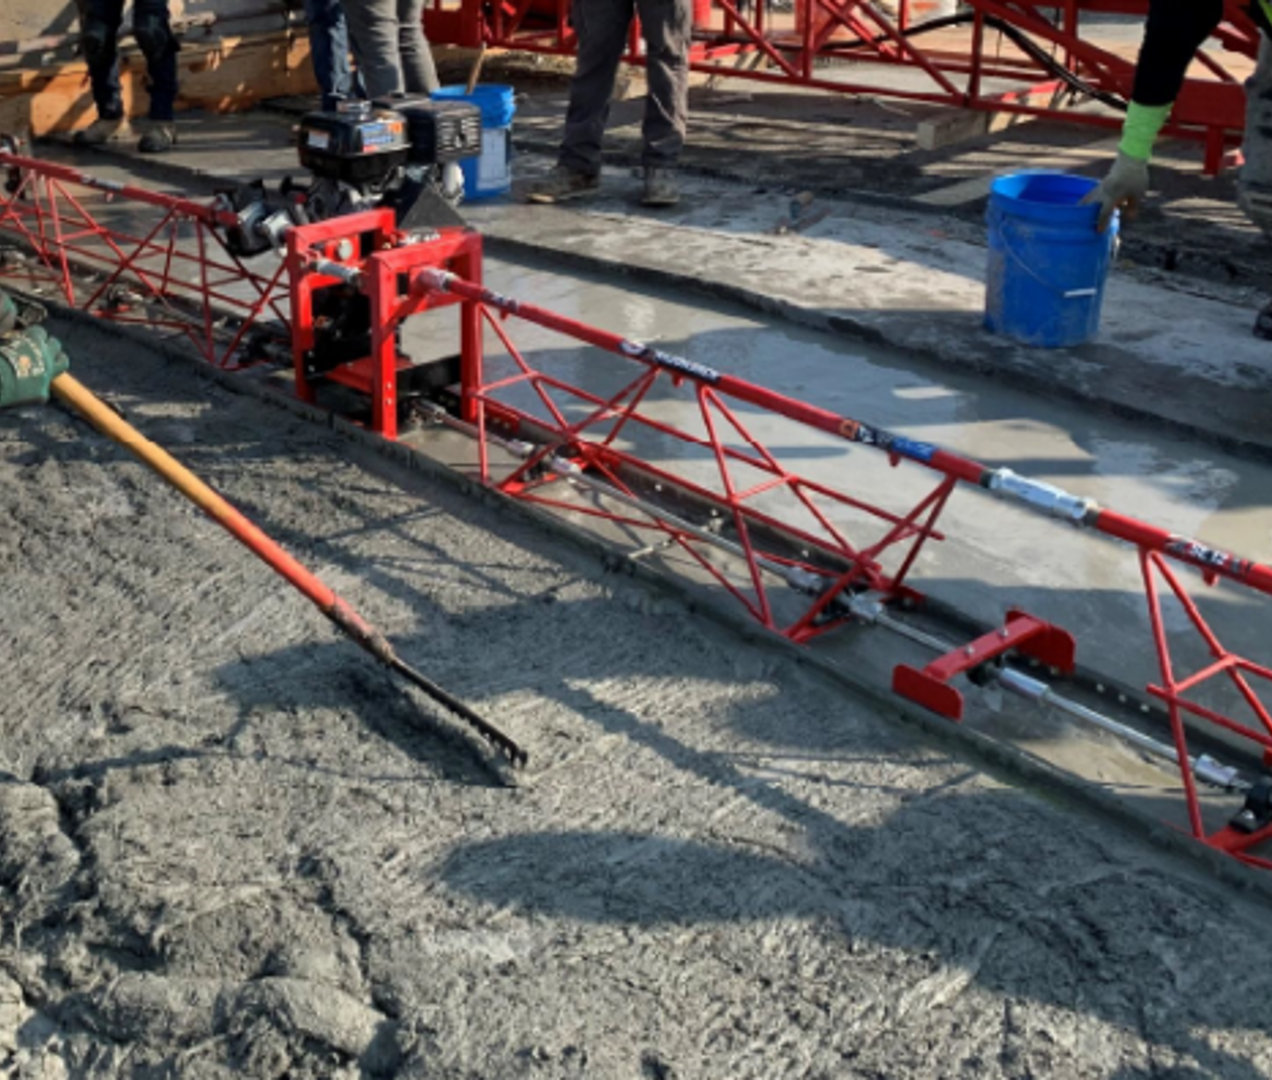
Figure 2. An NJDOT UHPC treatment in the process of curing. Courtesy of NJDOT.
Q. How is data from the pilots being used to research further UHPC applications?
The data from the pilot program will be used to further the Department’s investigation in UHPC for applications other than just bridge deck overlays.
Q. What can be done to prepare industry and the workforce for UHPC as an overlay?
The implementation of UHPC affects the current workforce because it is a new material to be used in New Jersey. The current workforce does not have enough experience with UHPC’s properties which could make a repair more challenging. UHPC has only been used for closure pours in New Jersey. This knowledge gap could be solved by supplying the workforce with workshops, seminars, and suggested construction sequences, practices and equipment. A test slab should also be constructed to verify the proposed material and the contractor’s procedures.
Q. Are there needed actions to better educate NJDOT staff on its efficacy and potential uses?
Yes, training and peer exchange activities are valuable for further educating NJDOT staff on UHPC. Recently, we participated in a a two-day UHPC workshop (October 2021) with the U.S. Department of Transportation. The workshop provided participants with a greater understanding of what UHPC is, and explored solutions for using UHPC for bridge deck overlays, link slabs, and steel girder end repairs. Participants were given information on where to obtain guidance for implementing different types of UHPC preservation and repair strategies. The workshop also provided participants with the opportunity to discuss their UHPC implementation strategy, construction specifications, and design details with FHWA EDC-6 UHPC team members.
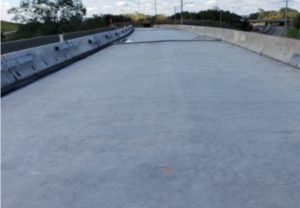
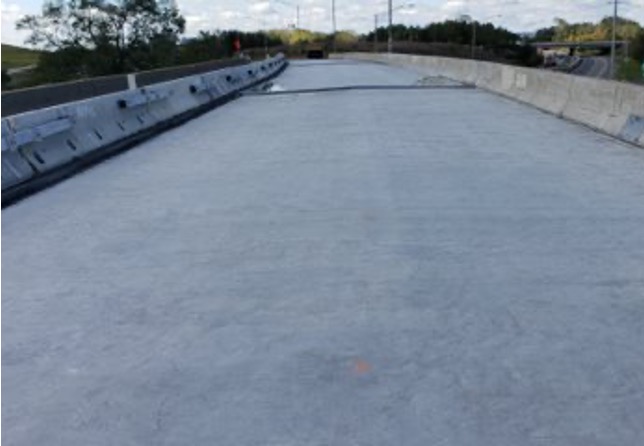
Figure 3. The final product, a UHPC overlay before asphalt paving. Courtesy of NJDOT.
Q. What does the future of UHPC look like in New Jersey?
The future of UHPC in New Jersey could consist of UHPC connection repairs, seismic retrofits, column repairs, concrete patching, shotcrete, steel girder strengthening, bridge deck overlays, and link slabs.
Q. In the current EDC-6 Round, the NJ STIC states that it is planning on performing an assessment of the UHPC pilot projects. When they are complete, how will they be assessed? Could you tell us more about the long-term testing program being developed to gather performance data in the assessment phase?
These are still works in progress. A long-term monitoring and testing program is being developed to gather performance data in the assessment phase. The scope of our current efforts includes further investigation and research, collection and evaluation of performance data, updating the standard specifications and conducting a life cycle cost analysis.
Q. Can you describe the objective(s) and/or provide any other status information about the long-term program goals?
A long-term goal for the department is to incorporate UHPC into our design manual, including for P&R.Eventually we could see UHPC incorporated with bridge deck overlays and concrete bridge repairs. There is currently no timeline on incorporating UHPC into the design manual. We anticipate revising the standard specifications, but there are no updates regarding the revision of the standard specifications for UHPC.
Resources
Federal Highway Administration. (2019, February). Design and Construction of Field-Cast UHPC Connections. Federal Highway Administration. https://www.fhwa.dot.gov/publications/research/infrastructure/structures/bridge/uhpc/19011/index.cfm
Federal Highway Administration. (2020, November). Eliminating Bridge Joints with Link Slabs—An Overview of State Practices. Federal Highway Administration. https://www.fhwa.dot.gov/bridge/preservation/docs/hif20062.pdf
Federal Highway Administration. (2018, April). Example Construction Checklist: UHPC Connections for Prefabricated Bridge Elements. Federal Highway Administration. https://www.fhwa.dot.gov/bridge/abc/docs/uhpc-construction-checklist.pdf
Federal Highway Administration. (2018, March). Properties and Behavior of UHPC-Class Materials. Federal Highway Administration. https://www.fhwa.dot.gov/publications/research/infrastructure/structures/bridge/18036/18036.pdf
Federal Highway Administration. (2018, February) Ultra-High Performance Concrete for Bridge Deck Overlays. Federal Highway Administration. https://www.fhwa.dot.gov/publications/research/infrastructure/bridge/17097/index.cfm
Mendenhall, Jess and Rabie, Samer. (2021, October 20). UHPC Overlays for Bridge Preservation—Lessons Learned. New Jersey Department of Transportation. https://www.njdottechtransfer.net/wp-content/uploads/2021/11/NJDOT-UHPC-Overlay-Research-Project-EDC-6-Workshop.pdf
New Jersey Department of Transportation. (2021, October 20). NJDOT Workshop Report. New Jersey Department of Transportation. https://www.njdottechtransfer.net/wp-content/uploads/2021/11/NJDOT-UHPC-Workshop-Final-Report.pdf
New Mexico Department of Transportation. (2010). Feasibility Analysis of Ultra High Performance Concrete for Prestressed Concrete Bridge Applications. New Mexico Department of Transportation. https://rosap.ntl.bts.gov/view/dot/24640
New York State Department of Transportation. (2021, June). Item 557. 6601NN16 – Ultra-High Performance Concrete (UHPC). New York State Department of Transportation. https://www.dot.ny.gov/spec-repository-us/557.66010116.pdf