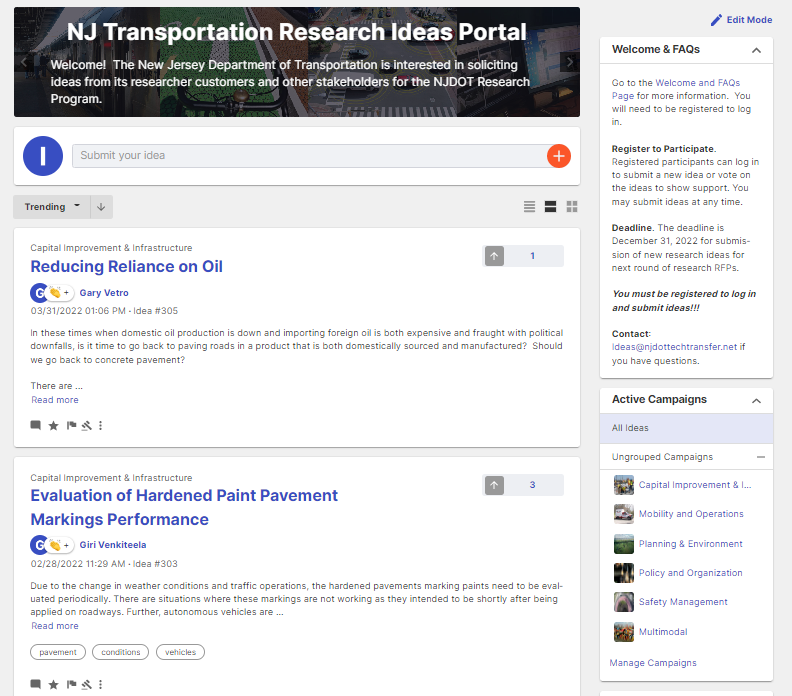
The New Jersey Department of Transportation’s (NJDOT) Bureau of Research invites you to share your ideas on the NJ Transportation Research Ideas Portal. We are asking NJDOT’s research customers and other transportation stakeholders to propose research ideas for the NJDOT Research Program. Join us in finding workable solutions to problems that affect the safety, accessibility, and mobility of New Jersey’s residents, workers, visitors and businesses.
REGISTER TO PARTICIPATE. Once you are registered, you may submit ideas at any time. If you registered previously, you should not need to register again. Click on the “+”button at the top of the page to register.
HOW DO I SUBMIT AN IDEA? Only registered participants can log in to submit a new idea or vote on other ideas to show your support. Register at the NJ Transportation Research Ideas here: https://njdottechtransfer.ideascale.com/
NEXT ROUND OF RESEARCH. Submit your research ideas no later than December 31, 2022 for the next round of research RFPs. The NJDOT Research Oversight Committee (ROC) will prioritize research ideas after this date, and high priority research needs will be posted for proposals.
In 2019, a team of researchers from New York University and Rutgers University examined ways to calibrate and develop Safety Performance Functions (SPFs) to be utilized specifically to address conditions on New Jersey roadways. SPFs are crash prediction models or mathematical functions informed by data on road design. These data include, but are not limited to, lane and shoulder widths, the radius of the curves, and the presence of traffic control devices and turn lanes. With these data, SPFs help those tasked with road design and improvement to build roads and implement upgrades that maximize safety.
The Highway Safety Manual (HSM) presents SPFs developed using historic crash data collected from several states over several years at sites of the same facility type. These SPFs data cannot be transferred to other locations because of expected differences in environment and geographic characteristics, crash reporting policies and even local road regulations. To help SPFs better reflect local conditions and observed data, one of two strategies is usually undertaken to fine-tune SPFs: calibrating the SPFs provided in the HSM so as to fully leverage these data or developing location-specific SPFs regardless of the predictive modeling framework included in the HSM.
The research team, led by Dr. Kaan Ozbay (of NYU’s Tandon School of Engineering), chose to pursue both of these strategies. The research report, Calibration/Development of Safety Performance Functions for New Jersey, can be found here. A webinar highlighting the research and findings can be found here. A monograph, supported by the NJDOT funded study and partially by C2SMART, a Tier 1 UTC led by NYU and funded by the USDOT, was also recently published and can be found here.
C2SMART Webinar highlighted the research methods, findings, challenges and technology transfer efforts of the NYU-Rutgers team for this NJDOT funded research project.
SPFs can be utilized at several levels. At the network level, researchers and engineers use SPFs to identify locations with promise for improvement. SPFs can be used to predict how safety treatments will affect the likelihood of crashes based on traffic volume and facility type. SPFs can be used to influence project level design by showing the average predicted crash frequency for an existing road design, for alternate designs, and for brand-new roads.
SPFs also can be used to evaluate different engineering treatments. In this case, engineers and researchers return to a site where a safety countermeasure has been installed to collect and analyze data to see how the change has affected crash frequency. They examine before and after conditions and measure if the prediction made using the SPF was accurate or needs improvement (Srinivasan & Bauer, 2013). In the end, SPFs are only as good as the data used in their development.
NJDOT and the NYU-Rutgers team set out to calibrate SPFs using New Jersey’s roadway features, traffic volumes and crash data, and if necessary, to create new SPFs that reflect conditions in the state. The facility types considered for this research project included segments and intersections of rural two-lane two-way, rural multilane, and urban and suburban roads. In examining these datasets, the researchers identified areas where data processing improvements could be made to enhance the quality or efficiency in use of the data in addition to pursuing the stated goal of developing New Jersey-specific SPFs.
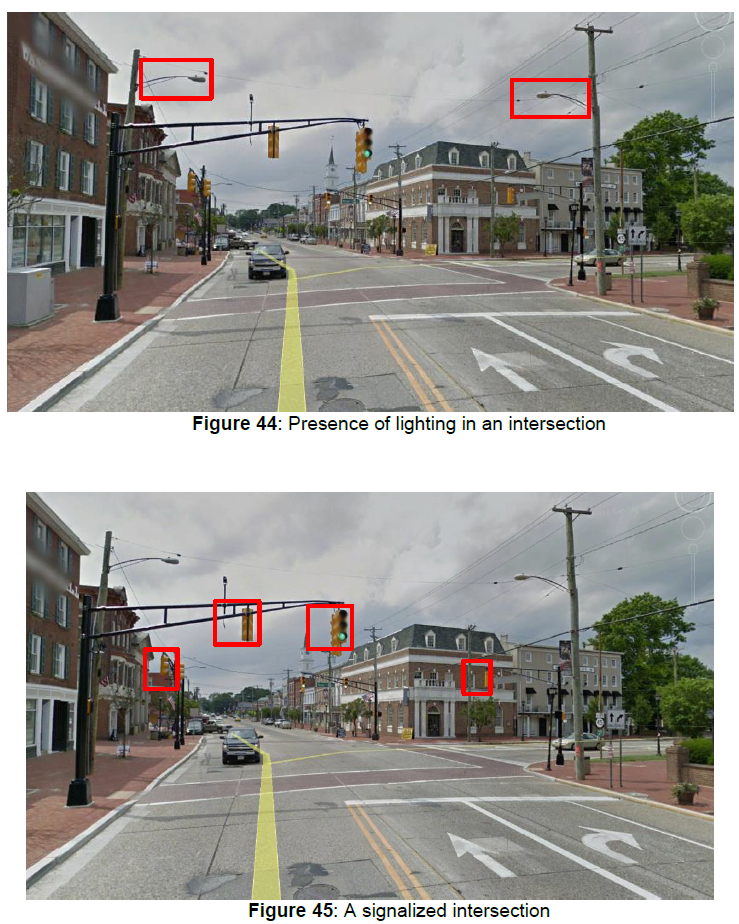
For example, utilizing the data provided by NJDOT, the research team developed methods for processing a Roadway Features Database of different kinds of road facilities. The researchers utilized the Straight Line Diagrams (SLD) database, which offers extensive information about the tens of thousands of miles of roadways in New Jersey, but observed issues and errors in the SLD database that required corrections. For example, the research team utilized Google Maps and Google Street View to conduct a manual data extraction process to verify information in the SLD database (e.g., confirm whether an intersection was an overpass, number of lanes, directionality) and extract missing variables, such as the number of left and right turn lanes at intersections, lighting conditions, and signalization needed for the analysis.
The research team using Google Street View to identify missing data points.
The research team also needed to develop programming code to correctly identify the type and location of intersections and effectively work with available data. The team developed a novel “clustering-based approach” to address the absence of horizontal curvature data using GIS centerline maps.
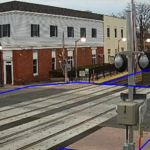
Utilizing Google Maps (Left) and the state’s Straight Line Database (Right), researchers were able to identify missing paths in the database that contributed to inconsistent data.
Police reports of crashes often have missing geographic identifiers which complicates analytical work such as whether crashes were intersection-related. In NJ, police are equipped with GPS devices to record crash coordinates but this crash information is somewhat low in the raw crash databases before post-processing by NJDOT. The researchers employed corrective methods and drew upon other NJ GIS maps to provide missing locations (e.g., Standard Route Identification or milepost).
The processing challenges for roadway features, traffic volumes and crashes encountered by the research team suggest the types of steps that can be taken to standardize and streamline data collection and processing to secure better inputs for future SPF updates. Novel data extraction methods will be needed to minimize labor time and improve accuracy of data; accurate crash data is integral to employing these methods.
The research team modified the spreadsheets developed by the HSM and used by the NJDOT staff. The calculated calibration factors and the developed SPFs are embedded in these spreadsheets. The users can now select whether to use the HSM SPFs with the calculated calibration factors or the New Jersey-specific SPF in their analyses
The researchers’ data processing and calibration efforts sought to ensure that the predictive models reflect New Jersey road conditions that are not directly reflected in the Highway Safety Manual. The adoption of this data-driven approach can make it possible to capture information about localized conditions but significant expertise is required to carry out calibration and development analyses. With more research—and improved data collection processes over time —the calibration and development of SPFs holds promise for helping New Jersey improve road safety.
C2SMART. (2020, September 23). Webinar: Bekir Bartin, Calibration and Development of Safety Performance Functions for New Jersey . Retrieved from YouTube: https://youtu.be/IRalyvjDaFM
Ozbay, K., Nassif, H., Bartin, B., Xu, C., & Bhattacharyya, A. (2019). Calibration/Development of Safety Performance Functions for New Jersey [Tech Brief]. Rutgers University. Department of Civil & Environmental Engineering; New York University. Tandon School of Engineering. Retrieved from https://www.njdottechtransfer.net/wp-content/uploads/2020/07/FHWA-NJ-2019-007-TB.pdf
Srinivasan, R., & Bauer, K. M. (2013). Safety Performance Function Development Guide: Developing Jurisdiction-Specific SPFs. The University of North Carolina, Highway Safety Research Center. Retrieved from https://rosap.ntl.bts.gov/view/dot/49505
Partnering with the Federal Railroad Administration, New Jersey Transit and New Jersey Department of Transportation (NJDOT), a research team at Rutgers University is using artificial intelligence (AI) techniques to analyze rail crossing safety issues. Utilizing closed-circuit television (CCTV) cameras installed at rail crossings, a team of Rutgers researchers, Asim Zaman, Xiang Liu, Zhipeng Zhang, and Jinxuan Xu, have developed and refined an AI-aided framework for detection of railroad trespassing events to identify the behavior of trespassers and capture video of infractions. The system uses an object detection algorithm to efficiently observe and process video data into a single dataset.
Rail trespassing is a significant safety concern resulting in injuries and deaths throughout the country, with the number of such incidents increasing over the past decade. Following passage of the 2015 Fixing America’s Surface Transportation (FAST) Act that mandated the installation of cameras along passenger rail lines, transportation agencies have installed CCTV cameras at rail crossings across the country. Historically, only through recorded injuries and fatalities were railroads and transportation agencies able to identify crossings with trespassing issues. This analysis did not integrate information on near misses or live conditions at the crossing. Cameras could record this data, but reviewing the video would be a laborious task that required a significant resource commitment and could lead to missed trespassing events due to observer fatigue.
Zaman, Liu, Zhang, and Xu saw this problem as an opportunity to put AI techniques to work and make effective use of the available video and automate the observational process in a more systematic way. After utilizing AI for basic video analysis in a prior study, the researchers theorized that they could train an AI and deep learning to analyze the videos from these crossings and identify all trespassing events.
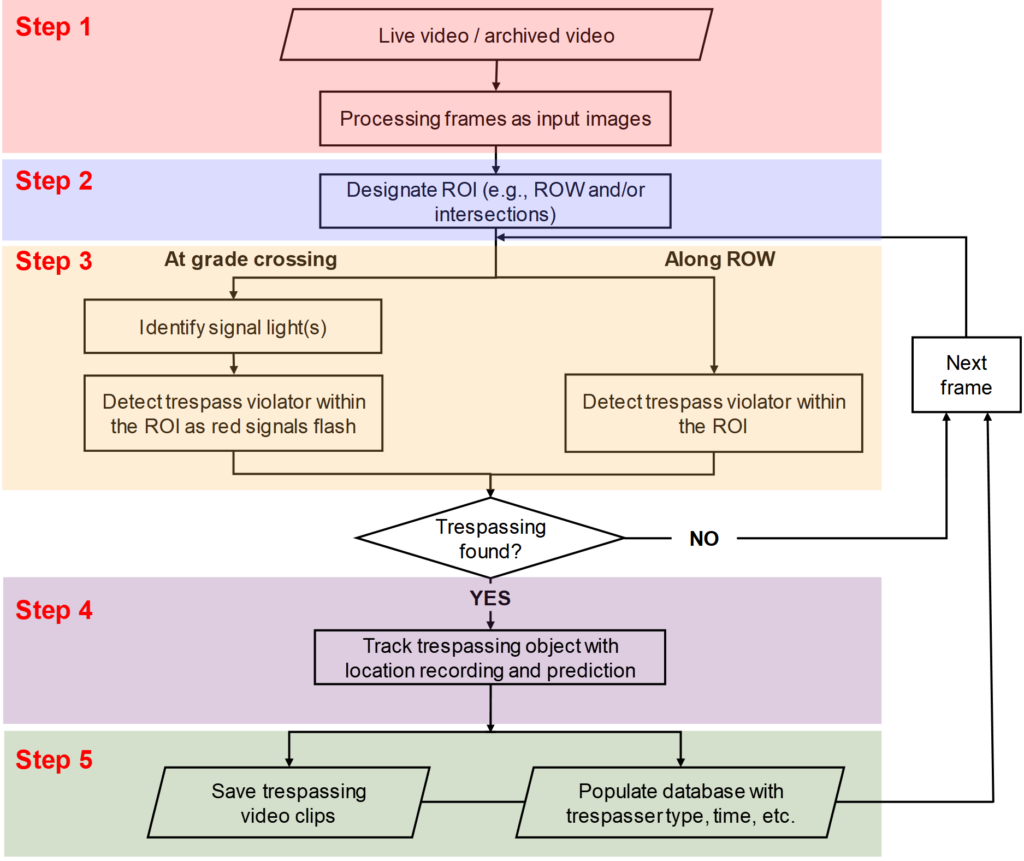
Working with NJDOT and NJ TRANSIT, they gained access to video footage from a crossing in Ramsey, NJ. Using a deep learning-based detection method named You Only Look Once or YOLO, their AI-framework detected trespassings, differentiated the types of violators, and generated clips to review. The tool identified a trespass only when the signal lights and crossing gates were active and tracked objects that changed from image to image in the defined space of the right-of-way. Figure 1 depicts the key steps in the process for application of AI in the analysis of live video stream or archived surveillance video.
Figure 1. General YOLO-Based Framework for Railroad Trespass Detection illustrates a step-by-step process involving AI algorithm configurations, YOLO-aided detection, and how trespassing detection incidents are saved and recorded to a database for more intensive analysis and characterization (e.g., trespasser type, day, time, weather, etc.)
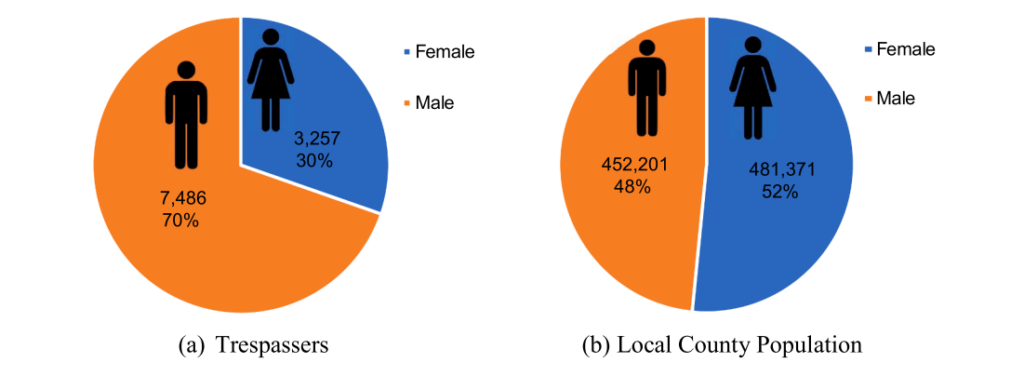
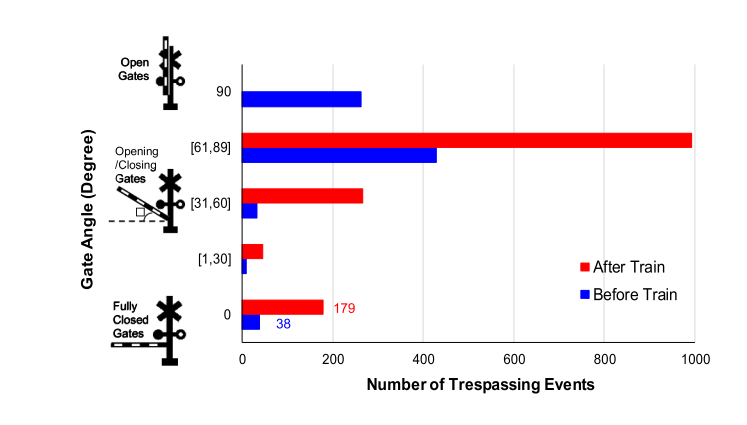
The researchers applied AI review to 1,632 hours of video and 68 days of monitoring. They discovered 3,004 instances of trespassing, an average of 44 per day and nearly twice an hour. The researchers were able to demonstrate how the captured incidents could be used to formulate a demographic profile of trespassers (Figure 2) and better examine the environmental context leading to trespassing events to inform the selection and design of safety countermeasures (Figure 3).
Figure 2: Similar to patterns found in studies of rail trespassing fatalities, trespassing pedestrians were more likely to be male than female. Source: Zhang et alFigure 3: Trespassing events were characterized by the gate angle and timing before/after a train pass to isolate context of risky behavior. Source: Zhang et. al
A significant innovation from this research has been the production of the video clip that shows when and how the trespass event occurred; the ability to visually review the precise moment reduces overall data storage and the time needed performing labor-intensive reviews. (Zhang, Zaman, Xu, & Liu, 2022)
With the efficient assembly and analysis of video big data through AI techniques, agencies have an opportunity, as never before, to observe the patterns of trespassing. Extending this AI research method to multiple locations holds promise for perfecting the efficiency and accuracy in application of AI techniques in various lighting, weather and other environmental conditions and, more generally, to building a deeper understanding of the environmental context contributing to trespassing behaviors.
In fact, the success of this AI-aided Railroad Trespassing Tool has led to new opportunities to demonstrate its use. The researchers have already expanded their research to more crossings in New Jersey and into North Carolina and Virginia. (Bruno, 2022) The Federal Railroad Administration has also awarded the research team a $582,859 Consolidated Rail Infrastructure and Safety Improvements Grant to support the technology’s deployment at five at-grade crossings in New Jersey, Connecticut, Massachusetts, and Louisiana. (U.S. DOT, Federal Railroad Administration, 2021) Rutgers University and Amtrak have provided a 42 percent match of the funding.
The program’s expansion in more places may lead to further improvements in the precision and quality of the AI detection data and methods. The researchers speculate that this technology could integrate with Positive Train Control (PTC) systems and highway Intelligent Transportation Systems (ITS). (Zhang, Zaman, Xu, & Liu, 2022) This merging of technologies could revolutionize railroad safety. To read more about this study and methodology, see this April 2022 Accident Analysis & Prevention article.
Tran, A. (n.d.). Artificial Intelligence-Aided Railroad Trespassing Data Analytics: Artificial Intelligence-Aided Railroad Trespassing Data Analytics:.
Zaman, A., Ren, B., & Liu, X. (2019). Artificial Intelligence-Aided Automated Detection of Railroad Trespassing. Journal of the Transportation Research Board, 25-37.
Zhang, Z., Zaman, A., Xu, J., & Liu, X. (2022). Artificial intelligence-aided railroad trespassing detection and data analytics: Methodology and a case study. Accident Analysis & Prevention.
Commercial vehicle safety-related alerts can notify drivers of major slowdowns from incidents and weather to inform decision-making. Source: Sblover99, Wikimedia
The National Operations Center for Excellence held a webinar featuring New Jersey and Colorado DOT initiatives to establish private sector partnerships that use crowdsourced data to deliver real-time information to commercial vehicles to improve the safety of all road users. Transportation agencies can now deliver in-cab alerts about road conditions through connected truck service providers to help commercial vehicle drivers approach and react more quickly to roadway incidents, work zones, and adverse weather conditions.
For this event, the NJDOT’s Senior Director for Transportation Mobility, Sal Cowan, gave a presentation, “NJDOT Using Crowdsourced Data to Improve Road Safety: Real Time Communications with Truck Drivers”. He was joined in making this presentation by NJDOT's private sector partners for this initiative, Amy Lopez, Director, Public Sector Services and Smart City Strategy for INRIX, and Marc Nichols, Director, Government & Industry Partnerships for Drivewyze.
As traffic deaths rise, NJDOT wants to get more information into the hands of drivers about changing roadway conditions – the earlier the better – to inform their decision making in an effort to reduce crashes. Summoning the key phrase, “Whatever It Takes”, Director Cowan framed the life-saving imperative behind NJDOT's willingness to make greater use of crowdsourcing and real-time data tools to reduce the risk of crashes. He highlighted how commercial vehicle alerts can inform truck drivers of hazards on the road, such as sudden slowdowns, disabled vehicles, and debris before the truck is affected by the incident. The driver can seek an alternate route or pull over until the slowdown is cleared.
INRIX collects extensive traffic data for state transportation agencies. They provide two types of alerts: "curated" incidents are from multiple sources such as DOTs, Twitter feeds, Waze, police scanners and other sources that are managed by the INRIX incident team; and "calculated" incidents such as dangerous or sudden slowdowns that are mathematically calculated by INRIX and compare real time speeds with free flow speeds at specific segment locations to identify abnormal conditions. The INRIX system has the ability to deliver real-time data that detects and describes sudden slowdowns, closures, and queues by location for specific events. This data is passed on to Drivewyze to send out alerts.
Drivewyze, introduced as North America’s largest connected truck network, provides communication with some 2.8 million trucks via its Drivewyze application which is embedded in the electronic logging device (ELD) of the truck. Drivewyze takes data from INRIX and communicates it to commercial truck drivers. The system works with severity thresholds and trigger warnings so only events that exceed these thresholds are reported. Commercial drivers receive the messages through the ELD in their cab. The reported information can be customized to include notification of specific weather events, incidents, work zones, and bridge and road closures.
A "major winter storm alert" was distributed to several states in the Northeast and reached some 4,811 trucks at a critical time.
NJDOT plays a pivotal role in providing weather and detour related data. Through this partnership NJDOT can collect extensive data regarding issues and incidents that it otherwise could not directly obtain. This allows the state to identify areas along key highways that produce issues and NJDOT can then begin to identify ways to resolve them. In addition to analysis, NJDOT can work proactively with is partners to prevent crashes. During Winter Storm Kenan, NJDOT was able to send alerts out through Drivewyze to thousands of trucks across the Northeast to alert drivers to a major winter storm and hazardous road conditions and to take precautions.
The webinar, part of the FHWA's Adventures in Crowdsourcing Webinar Series, had two featured presentations on initiatives to address commercial vehicle safety through crowdsourcing. The webinar explored lessons from New Jersey, Colorado and other states through presentations and information exchange with attendees from the FHWA, other state DOTs, and private sector partners. To learn more about the New Jersey initiative and the capabilities of its private sector partners, check out the full presentation here, starting at the 29th minute. The presentations given by the NJ team and other presenters can be downloaded here.
The State of New Jersey has committed to the widespread deployment of Electric Vehicle (EV) charging technologies in the pursuit of cleaner, less carbon intensive roadway travel. With the establishment of the National Electric Vehicle Infrastructure program (NEVI) in the Bipartisan Infrastructure Law (BiL), also known as the Infrastructure Investment and Jobs Act (IIJA), additional federal funding will be available to support New Jersey’s EV transition ambitions.
To receive NEVI Formula Program funds, states are required to develop an FHWA-approved EV Infrastructure Deployment Plan that describes how the state intends to use the funds in accordance with the NEVI Formula Program Guidance. The State of New Jersey convened a multi-agency task force that included the New Jersey Department of Transportation (NJDOT), NJ Department of Environmental Protection (NJDEP), NJ Board of Public Utilities (NJBPU), the NJ Economic Development Authority (NJEDA), among others (1), to meet the August 1, 2022 deadline for plan submission to the Joint Office of Energy and Transportation with FHWA approval expected by September 30, 2022.
Funding for EV Chargers
Having the highest number of registered electric cars on the road per public charging station of any state in the country, at a ratio of 46.16 (2), New Jersey stands to benefit greatly from NEVI’s formula funding for new EV charging stations. In total, NJDOT will receive $104.4 million from the program over five years (3). This sum represents 2.51 percent of the $4.2 billion that USDOT expects to provide to all states, Puerto Rico, and the District of Columbia through NEVI’s formula (3). For comparison, in 2020 New Jersey’s share of the total American population was roughly 2.8 percent (4), but critically, its share of land area is less than a fraction of a percent (5). Thus, in terms of EV charging infrastructure, the apportioned NEVI funding for New Jersey can ensure broader geographic coverage for its residents than may be possible for other less densely populated states.
Adoption of EV and Hybrid Electric Vehicles is growing exponentially in New Jersey as the technology and infrastructure continues to develop. Courtesy of NJ Department of Environmental Protection.
NEVI’s provisions mandate that interstates and highways designated as alternative fuel corridors (AFCs) must have charging stations at intervals of 50 miles or less (and within 1 mile from the highway itself (6)). In the most recent round of nominations, all of NJ’s interstate roadways were accepted and designated as AFCs by the FHWA, including: I-76, I-676, I-78, I-278, I-80, I-280, I-287, I-95, I-195, I-295, the Garden State Parkway, the New Jersey Turnpike, and the Atlantic City Expressway. At a minimum, the charging stations must have the capability to simultaneously charge four vehicles at 150kW each. The development of intercity EV infrastructure should expand the travel range and charging options for through-travelers and New Jerseyans who operate the State’s rapidly growing fleet of registered plug-in electric vehicles (PEVs) which numbered 64,307 in 2021 (7).
Far more charging stations will be required in New Jersey should the State achieve its goal of 100 percent PEV sales by 2035. By then, the EV vehicle fleet would reach 4.2 million registered EVs, or 73 percent of the estimated total of six million registered vehicles. The NJ EV Plan estimates that between 1,600 and 5,600 additional publicly available fast charging sites will be required throughout the state to meet these registration levels (1).
Beyond the $5 billion from NEVI, the program will establish the DOT-DOE Joint Office of Energy and Transportation to coordinate the shift in energy mixes for the nation’s transportation technology. Courtesy of the Federal Highway Administration.
Supplementing the NEVI Funding Formula program, the BiL sets aside discretionary funding through the National Electric Vehicle Infrastructure Competitive Program to fill in gaps in publicly accessible EV charging and hydrogen, propane, and natural gas fueling infrastructure along both designated alternative fuel corridors (50%) and in community locations (50%), such as parking facilities, public schools, public parks, or along public roads. Under this program, USDOT will prioritize projects that expand access to charging and alternative fueling infrastructure within rural areas, low- and moderate-income neighborhoods, and communities with limited parking space or a high ratio of multi-unit dwellings to single-family homes. Eligible entities include states, metropolitan planning organizations, local governments, political subdivisions, and tribal governments. NJ will be eligible to compete for these funds.
The NJ EV Plan establishes three phases for EV infrastructure development:
Phase 1 focuses on developing electric vehicle supply equipment (EVSE) along the State's AFCs toward achieving "fully built out" status pursuant to the national NEVI program guidance. Nominated corridors must be equipped with at least four, 150 kW chargers at least every 50 miles and located less than or equal to one mile from the corridor exit.
Phase 2 focuses on addressing DC fast chargers on New Jersey’s main corridors every 25 miles, as established by State law and recognizing NJ as the most densely populated state. The State will incentivize the siting of charging stations at corridor interchanges to achieve the goal of EVSE chargers at a spacing of 25 and 50 miles. The 25-mile spacing provides opportunities to install one EVSE location at the intersection of two corridors and potentially serve both corridors which in some instances may save on installation costs.
Phase 3 implements EVSE flexibly in accordance with community needs which could include community-centric charging as well as fast charging hubs near multi-unit dwellings (MUD) and in disadvantaged and overburdened communities to enable electric ride sharing and ride hailing.
The NJ EV Plan emphasizes that each phase will involve planning, community outreach, stakeholder engagement and alignment with Justice40 initiatives. While initial focus will be on Phase 1, the Plan allows for all phases to progress over the next five years (1).
NJ EV Deployment Plan is divided into three overlapping phases over the five-year plan: Deployment of chargers between 50 and 25-mile spaces, addressing gaps in the network, and flexible implementation based on community needs. Courtesy of the New Jersey Department of Environmental Protection.
The NJ EV Deployment Plan notes the establishment of its “Partnership to Plug In,” a multi-agency partnership formed to coordinate the broader statewide rollout of EVs. Partnership to Plug In is co-led by NJBPU, NJDEP and NJEDA and “bolstered by support from Treasury, NJ TRANSIT and NJDOT” (1). NEVI formula funding will increase the support NJDOT can provide to the Partnership. The deployment plan frames NEVI as a stepping-stone towards NJ’s policy goals “of achieving 100% clean energy by 2050 and reducing State greenhouse gas emissions 80% below 2006 levels by 2050” (1).
The expansion of NJ’s EV infrastructure network is a complementary next step to the state’s tax incentives and rebate programs and model municipal ordinance initiative to encourage greater EV adoption. Given a $173,000 cost estimate per station, New Jersey’s share of NEVI funding alone is expected to provide enough for 600 charging stations (9). For comparison, the NJDEP estimates roughly 736 Public Charging Locations in NJ (10), illustrating the scale of the potential impact from formula funding.
Looking to place charging stations at a maximum 25 miles apart in applicable routes, twice the frequency required by NEVI, recent NJ state law signals its goal to remain a leading state for owning or operating an electric car (11). As established in the BiL, the State of New Jersey will share 20 percent of NEVI costs (8). The State government has already committed to requiring that 100 percent of state-owned, non-emergency light-duty vehicles be EVs by 2035 (12) and requiring at least 400 DC Fast Charger public stations by the end of 2025 (12).
The composition of public charging locations in New Jersey would benefit if NEVI provides more DC Fast Charging stations, as the majority of NJ locations only provide lesser voltage Level 1 and 2 chargers. Courtesy of the New Jersey Department of Environmental Protection.
Gasoline exhaust from personal and commercial vehicles can lead to areas closer to highways experiencing disproportionate exposure to harmful air pollutants. Courtesy of Ruben de Rijcke, Wikimedia Commons
Equity in Environment, Workforce, Mobility and Community Economic Development Considerations
Creating the charging infrastructure to ease the transition from fossil fuels to electric vehicles is a rational response to the global climate crisis. It is also an opportunity to advance equity and environmental justice through transportation investments. Subject to the Biden administration's Justice40 commitment to spend 40 percent of overall benefits of federal investments in climate and clean energy in disadvantaged communities (13), NEVI mandates placement of EV charging stations in the State’s affected disadvantaged communities to reduce the negative impacts of gasoline-based air pollutants.
The NJ EV Deployment Plan highlights the ways in which it is aligned with advancing the Justice40 commitment. The Plan outlines the State’s existing laws, regulations, guidance, mapping tools and outreach processes that it has employed, and expects to continue to employ, to deliver equitable transportation benefits and combat the health stressors borne by individuals living near highways and facilities from exposure to tail-pipe exhaust from conventional fuels. The Plan highlights equity, workforce development, mobility needs, and community benefit commitments and considerations. Emphasis is placed on continuing outreach and dialogue processes, through successive deployment phases, working with community leaders and labor organizations, chambers of commerce, community colleges, technical schools, universities, training organizations, and industry to ensure that the deployment, installation, operation, and use of EV charging infrastructure achieves equitable and fair distribution of benefits and services.
Deploying Transformative Public Investment to Meet a Global, National and State Challenge
The Federal-Aid Highway Act of 1956 serves as a reminder of the transformative impact of large-scale federal public infrastructure investment. The bill created a 41,000-mile “National System of Interstate and Defense" which accelerated the nation’s reliance on the personal automobile and commercial trucks for goods movement distribution and profoundly shaped our patterns of living today. Today our challenge is no longer building out the interstate system, but rather retrofitting our roadway systems and land use design to ensure a sufficient supply of EV charging stations. For this era, the aspirational vision for the NEVI program is to build a clean transportation network capable of ensuring reliable regional travel and supportive of carbon emission reduction goals to mitigate climate change impacts.
With its reported national budget of $5 billion (8), the NEVI program makes a critical national investment toward a future where the nation’s EV drivers will increasingly have the confidence to drive down any interstate, knowing charging stations will be waiting for them; non-EV drivers will likewise have fewer “range anxiety” concerns should this be a limiting factor in making the transition to operating a plug-in electric vehicle.
The NEVI program's support will help keep the State’s economy and transportation competitive by complementing its advancements and goals in the EV market. Rewarding New Jersey’s innovation and commitments in encouraging the adoption of new EVs on its road, NEVI’s role in building out charging stations to service EVs will ultimately serve the State well. Increasing the reliability of New Jersey EV network will result in reductions in diesel and carbon emissions from automobiles, thereby protecting the environment, health, and pocketbooks of New Jerseyans.
RESOURCES
(1) New Jersey Department of Environmental Protection (2022, August 1). New Jersey National Electrical Vehicle Infrastructure (NEVI) Deployment Plan.https://www.nj.gov/dep/drivegreen/pdf/nevi.pdf
The sixth round of Every Day Counts (EDC-6) was kicked off with a Virtual Summit that introduced the innovations that FHWA would be promoting over the next 2 years. The summit also featured a National State Transportation Innovation Council (STIC) Network Showcase that highlighted some 245 innovations developed and deployed by agencies throughout the United States. This article is one in a series that takes a closer look at “homegrown innovations” implemented by state and local agencies to save lives, time, and money.
Highlighted by the Federal Highway Administration (FWHA)’s journal Innovator in its March/April 2018 issue, the Florida Department of Transportation (FDOT) produced a systemic, digitized way for creating an inventory of pedestrian infrastructure (1). As a part of a State Transportation Innovation Council (STIC) program, FDOT, in cooperation with the Broward Metropolitan Planning Organization, Florida International University, and the FHWA created a Safe and Accessible Pedestrian Facility Inventory Model (SAPFIM) (1). SAPFIM has been described as “a web-based application designed to collect, manage and report on pedestrian facilities along public roadways” (2) through cost-effective, real-time means.
The project received STIC incentive funding ($100,000) in 2015 to develop and deploy this GIS-based software tool (3), establishing a model that could be adapted and scaled for other local projects and transportation agencies.
As part of the STIC project, several agencies had an opportunity to test SAPFIM and provide feedback that the project team used to modify the software and user’s guide.
SAPFIM has four core functions in recording, managing, mapping, and generating reports on pedestrian. Source Dr. Fabian Cevallos, National Center for Transit Research.
The general design of SAPFIM was broken by researcher into the image above; this particular division of functions could provide a conceptual basis for digital collection software on different topics as well. Source Dr. Fabian Cevallos, National Center for Transit Research.
As an example, a fire hydrant obstructing the middle of a sidewalk might render a pathway inaccessible to wheelchair users. This obstruction in the sidewalk can be photographed and reported in SAPFIM resulting in its identification, labeling and geo-location. Such a tool allows local agencies to better track their pedestrian features while needing less time and resources. The technology also alerts planners and other officials to what pedestrian improvements, repairs, or even new constructions need priority in real-time. With updates being automatically incorporated in a wider database, information storage and retrieval is generally more complete yet simplified for users.
Obstructions to sidewalks and the location of critical pedestrian infrastructure, such as pushbuttons, away from pavement can signal spatial hostility to pedestrians. Right image courtesy of www.pedbikeimages.org; Dan Burden; left image courtesy of www.pedbikeimages.org, Laura Sandt.
As highlighted in a presentation from one of its research team members, SAPFIM collects over 80 standard attributes (2), such as geographic and photographic references, to describe pedestrian infrastructure across the Sunshine State. Authorized users can use wireless devices (smartphones, laptop, tablets, etc.) to enter information on a pedestrian feature or update an existing one. By answering preset criteria tailored to three categories of features (sidewalks, curb ramps, and crossings), compliance with American Disability Act (ADA) accessibility statutes or general safe, comfortable pedestrian design could then be assessed and improved upon (2).
Teams collecting data for SAPFIM still physically measure sites before inputting the information digitally. This physical component could help experientially familiarize participating stakeholders with the wider built environment of their communities. Courtesy of Broward Metropolitan Planning Organization.
A similar program from Seminole County, Florida revamped the transcription and tracking processes of their ADA pedestrian ramp inspections into a digital, mobile application that utilized GIS technology (4). Ultimately winning the FHWA’s 2021 Building a Better Mousetrap Smart Transformation Award, the Seminole County ADA ramp tracker reduced inspection times of individual ramps from 1.5 hours to 5 minutes (4). It streamlined the entire tracking process of a feature from taking 3-4 days with pen and paper to reportedly a single day (4) by also eliminating a multi-hour step of transferring physical records to digital ones.
It is unclear if the Seminole County’s trackers were built off of SAPFIM, but nonetheless the demonstrated utility of the County’s efforts validates the purpose of the FDOT project. Applying digital cataloging technology to the built-environment clearly suggests that the future of transportation maintenance will include enhanced digital record-keeping, including breaches to accessibility ordinances. Such technology continues to be re-tailored to maintenance of street lights, potholes, public bathroom accessibility, curb-cuts and other physical assets and their attributes. The equity and cost-saving gains of these homegrown innovations warrant further attention and deployment, particularly in ways that can respond creatively to rising pedestrian fatalities nationally and in New Jersey (5).
Cevallos, Fabian. (2020. June 1). Safe and Accessible Pedestrian Facility Inventory Model (SAPFIM): Development. National Center for Transit Research (NCTR), University of South Florida. https://core.ac.uk/download/pdf/323870213.pdf
The interstate highway transportation building program undoubtedly yielded significant mobility and economic benefits for the nation in the post WW-II era but also imposed environmental and public health burdens for less favored communities. The benefits and burdens of the building program were not equitably distributed; the burdens were often disproportionately borne by predominantly minority and ethnic populations and lower-income communities that were powerless to halt transportation and land use decisions made in the name of “progress”, regional mobility, more efficient auto and truck travel, and urban renewal.
The Reconnecting Communities Pilot Program, a new and innovative program in the Bipartisan Infrastructure Law, takes a small step toward repairing and redressing the adverse consequences of these past planning and engineering decisions. (1)
The Bipartisan Infrastructure Law (BIL) enacted in the Infrastructure Investment and Jobs Act has been described as a “once in a generation” investment in our nation's infrastructure, promising two million jobs per year and delivering needed financial assistance to transit, highways, water, power, and communications. While much of the BIL’s transportation funding is intended to encourage and prioritize the repair, reconstruction, replacement, and maintenance of existing transportation infrastructure, the BIL also tilts investment and resources for programs, new and old, to tackle the challenges of the 21st century in the realms of safety, equity, and climate change and resilience.
The BIL includes an innovative new program, the Reconnecting Communities Pilot Program, that sets aside $1 billion to “restore community connectivity by removing, retrofitting, or mitigating highways or other transportation facilities that create barriers to community connectivity, including, mobility, access, or economic development.” From 2022 through 2026, the pilot program will receive $500 million from the Highway Trust Fund and $500 million from the general fund for Planning and Capital Construction grants. (2)
Emergency services on scene at O'Connor Electro-Plating explosion in Los Angeles, Calif., 1947. Courtesy of UCLA Library.
Freeway and Urban Renewal in the Bronx. Provided with permission from Segregation by Design.
The USDOT explains that the Reconnecting Communities pilot program will help reconnect communities that were previously cut off from economic opportunities by transportation infrastructure. Reconnecting a community could mean adapting existing infrastructure– such as building a pedestrian walkway over or under an existing highway– to better connect neighborhoods to opportunities or improve access through crosswalks and redesigned intersections. The FY22 Notice of Funding Opportunity (NOFO) has been issued and is available on the USDOT website.
The primary goal of the program is to reconnect communities harmed by transportation infrastructure, through community-supported planning activities and capital construction projects that are championed by those communities. The planning grants support the funding of the planning processes for the entity performing the reconnection, to include project design and public outreach to the historically disconnected communities. Outreach can be tailored to overcome mistrust of the government entity that sited the infrastructure that disconnected the community, and explore potential strategies to redress the burdens of these past siting decisions. After planning is complete, capital construction grants will fund work to remove, replace, or mitigate the facility. The federal government will fund up to half of the costs of these projects.
Below Grade Portion of Cross Bronx Expressway under construction, provided with Permission from Segregation by Design
I-93 Construction in Boston, Provided with Permission by Segregation By Design
What the Reconnecting Communities Program Recognizes
The program is noteworthy for its recognition that, historically, many public and private entities presided over land use policies and the siting of transportation infrastructure that resulted in the isolation and segregation of poor and marginalized populations from the broader community. Some scholars have traced causes of spatial segregation to unfair enactment of zoning laws in the 1930s that peddled "health and safety" as the rationale for carrying out discriminatory land use policies. Over time, the color line boundaries were maintained through redlining, realtor steering, block-busting, and disinvestment that shaped a geography of unequal access to opportunities for those concentrated in disadvantaged communities.
The intent of early zoning was to reinforce protection of citizens’ health and safety as established in nuisance law. It gave governments police powers to make sure that the state and its cities could be proactive in anticipation of negative impacts. Unfortunately, with these powers, the enfranchised voter, politician, planner, and engineer set the parameters of health and safety to fit their preferences and biases. Governments could consolidate disenfranchised populations in specific areas and permit the siting of health and safety nuisances in these communities through “spot zoning”. For example, in South Central LA, a majority black neighborhood, the City began to spot zone industrial uses in commercial portions of the neighborhood. An electroplating plant in the area exploded in 1947 killing 5 local residents and 15 workers while damaging 100 homes. The property next to a church was spot zoned industrial and when the pastor raised their concerns, they were why “Why don’t you people buy a church somewhere else?” (3 pp. 55-56). These local decisions had the silent approval of state and federal governments.
Concurrently, the rise of the personal automobile required the allocation of space to make trips easier and faster in and through traditionally dense American cities. At the beginning of the Highwaymen Era, cities sought to build expressways and parkways, often ignoring the residents who sat in the bulldozer’s path. The Cross-Bronx Expressway is an often-referenced example of how damaging the siting of urban expressway projects were to community life and how powerless the affected communities were to halt siting decisions. In 1945, Robert Moses, perhaps the most infamous highwayman, sought to construct a seven-mile trench highway through the Bronx. He looked at the stretch as his to shape. Even when offered alternatives to his vision, alternatives that would have resulted in preserving more of the neighborhood and homes, he persisted with his alignment through the Bronx and its displacements of the families along the way. (4 pp. 839-878) Moses was not alone among the planners and engineers in ignoring the preferences and plight of local residents.
This process accelerated with passage of the Federal-Aid Highway Act in 1956 that funded the construction of mostly free to access, grade-separated roads that linked cities, towns, and states. The money and power prescribed to states from the federal government allowed the powers that be to run highways through neighborhoods of primarily underrepresented populations. The Embarcadero Freeway in San Francisco (5 pp. 46-96), I-93 in Boston (6), the several I-80’s of Oakland (7) , and many more cut deep into their cities in the name of progress (3 pp. 127-129). Individuals saw the divisive impacts of these highways on communities and eventually rallied in several cities to prevent their expansion, but it was too late for many communities. Hulking multilane highways that produced noise and air pollution cut up and cut off neighbors and communities (5 pp. 94-121).
Over time, people have organized and sought to mitigate or reverse the impacts of these highway sitings on the urban landscape. Several governmental bodies are engaged in planning processes for community reconnection and several projects have been successfully completed in the past two decades. The most famous two examples are The Embarcadero in San Francisco and Boston’s Big Dig. The Embarcadero Freeway was a multilevel highway that separated San Francisco Bay from the City. In 1989, an earthquake struck the Bay Area. The Embarcadero crumbled with the quake and people began to ask questions about how this massive waterfront space could be used. After fights with the State and a 6-5 vote at the municipal level, a boulevard and trolley tracks replaced the Embarcadero. (8) For the first time in decades, the bay, not pillars and concrete, bound San Francisco at its north end.
The most famous reconnection on the East Coast is probably the Big Dig. When constructed, I-93 tore through the historically Italian North End, cutting it off from the City proper. With no transit facilities, the neighborhood was isolated with large spans casting shadows into the residences of the North End. While the North End could not be saved, witnessing the damage caused by the highway sparked highway revolts throughout the Boston area leading to the cancellation of several highway projects in Boston. With traffic pressures rising and lack of political will for more throughput, Massachusetts started to plan the Big Dig in the early 1980s to repair the damage done and improve throughput on I-93. Over the next 35 years, Boston engaged with the North End community, the citizens of the City and business and waterfront interests to shape the public space that would follow. This development process resulted in the current boulevard and park that caps I-93. (6)
Before and After Replacing the Embarcadero, Courtesy of the San Francisco Planning Department
Recent and Promising Reconnections
In Boston and San Francisco, the removal of the highways revived the space, but also led to land speculation that has fueled displacement and gentrification. With the successes and mistakes of these community reconnections in mind, other states and cities are exploring restorative strategies that will avoid and minimize community displacements.
The Inner Loop of Rochester is one of the more recent reconnection projects on the East Coast. Its transformative effects have served as a "demonstration project for highway removal in other parts of the city" (9). When completed in 1965, I-490 and New York State Route 940T created a loop around Rochester’s downtown, making the area difficult to access for most residents. As the 1970s brought significant economic impacts to Upstate New York, Rochester’s population declined and the city recognized the need to reconnect the downtown with the rest of the city. In the early 2000s, several proposals slowly coalesced into public engagement in 2013 through which the citizens helped shape plans for the initial removal of the loop. For $21 million, Rochester removed and buried its below grade highway and have since replaced it with housing and mixed-use development. (9,10)
Built between 1956 and 1968, I-94 connected the Twin Cities, but in the process badly damaged the majority Black neighborhood of Rondo, displacing 60 percent of its residents. In the late 2000s, a freeway cap was proposed to cover the highway in portions, but like many proposals at the time, it languished due to tight public budgets. In 2021, a local nonprofit, Reconnect Rondo, began spearheading an effort to reconnect portions of the community via a four-block land bridge. A land bridge option was settled on rather than removal or downgrading to a boulevard because that stretch of I-94 is considered the busiest segment of highway in the state. Reconnect Rondo is seeking justice in other ways for the cumulative impacts unleashed in part by the highway’s bisection of the community. They want to expand the neighborhood community land trust and provide housing and invest in local businesses while they pursue the highway cap. (11)
Modern day I-93 after the Big Dig, Courtesy of NewtonCourt and Wikimedia.
Rondo Neighborhood 1953 (left), 2020 (right), courtesy of Ramsey County, Minnesota
Syracuse is replacing I-81, the viaduct that runs through the core of its city. I-81’s construction ran through a neighborhood that was not only majority black, but also held a majority of all the black residents in Syracuse. The press depicted the neighborhood as slums and the State targeted the neighborhood for urban renewal in 1957. The completion of the viaduct left a soaring piece of infrastructure that isolated the community. Syracuse joined with several other municipalities in seeking to right the wrong created by I-81 and recently received funding from the State of New York to replace the highway with a boulevard. Community members fear that the growth resulting from the return of I-81 to the city’s grid may displace residents. NYSDOT’s only noted plan for addressing this potential impact is to ensure the ongoing update to the city’s development plan includes gathering the community’s input on how the new space incorporates with the community. (12-15)
New Jersey now has an opportunity to learn from those who have already planned and implemented community reconnection projects. In recent years, two highway segments have been identified as candidate projects. In Northern New Jersey, I-280, when constructed, cut a deep swath underneath the streets of Newark, East Orange and Orange. Today, the interstate segment divides neighborhoods and generates traffic, noise, and air pollution and presents unsafe pathways for pedestrians and cyclists. The North Jersey Transportation Planning Authority (NJTPA), in association with Essex County and the affected municipalities, examined strategies for reconnection in the Essex County Freeway Drive and Station Area: Safety and Public Realm Study in 2017. This study examined access and circulation issues in Orange and East Orange, and around the East Orange, Brick Church and Orange train stations, Route 280, Freeway Drive East and West, and the NJ TRANSIT elevated rail line (16). The Regional Planning Association’s Fourth Plan, completed in 2019, calls for capping I-280 in Newark and East Orange "to restore the street grid and knit back together neighborhoods." (17)
In the State Capitol, the city, county, and state all have sought to transform State Route 29. While not a part of the Interstate System, NJ-29 connects with I-195 and I-295 south of Trenton and winds along the Delaware River, separating Trenton residents from the waterfront. In 2009, the City of Trenton signed a memorandum of understanding with several agencies that proposed transformation of NJ-29 into a boulevard, but like I-94, the project has not advanced. A 2016 grant from the Delaware Valley Regional Planning Commission (DVRPC) spurred renewed interest in continuing the process. (18) With the availability of funding, advocates are seeking state support to plan and rebuild a section of Route 29 in downtown Trenton (19,20).
Can affected communities and stakeholders in New Jersey draw inspiration from the reconciliation and restoration efforts of other states and regions? With federal funding available, advocates see an opportune time to get these or other projects off the ground that could reconnect the communities once divided by past roadway siting and design decisions.
Rendering of before and after I-81 is torn down, courtesy of NYSDOT
Rothstein, Richard.The Color of Law: A Forgotten History of How Our Government Segregated America. s.l.: Liverwright Publishing, 2017.
Caro, Robert.The Power Broker: Robert Moses and the Fall of New York. s.l.: Random House, 2015.
Kelley, Albert Benjamin. The Pavers and the Paved: The Real Costs of America's Highway Program. s.l.: D.W. Brown, 1971.
Crockett, Karilyn.People Before Highways: Boston Activists, Urban Planners, and a New Movement for City Making. s.l.: University of Massachusetts Press, 2018.
Self, Robert O.American Babylon: Race and the Struggle for Postwar Oakland. s.l.: Princeton University Press, 2005.
With federal and state taxes on gasoline becoming less viable as a mechanism for funding transportation infrastructure, the State of New Jersey is looking for participants with passenger and commercial vehicles for a study on Mileage-Based User Fee study. This study is the most recent, fourth phase of the Eastern Transportation Coalition’s wider exploration of Mileage-Based User Fees (MBUF) as a new model for funding transportation infrastructure.
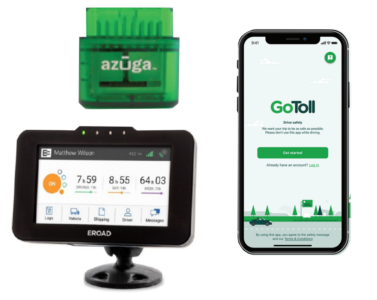
Both plug-in models are attachable to the OBD-II Ports of participants’ vehicles. Courtesy of the Eastern Transportation Coalition
An alternative way for generating revenues for highway maintenance, repair, and construction, a MBUF would charge motorists by the number of miles they travel rather than “at the pump”. For years now, improvements in the fuel efficiency of motor vehicles (i.e. improved miles-per-gallon) have reduced the gasoline tax revenue generated per user, even as the size of vehicles and therefore their potential for wear on the road has only increased. The advent of widespread electric vehicles (EVs) also presents users who do not pay into gasoline taxes at all. Replacing gasoline taxes with a MBUF would be a way of rebalancing costs and benefits of transportation infrastructure for the modern era.
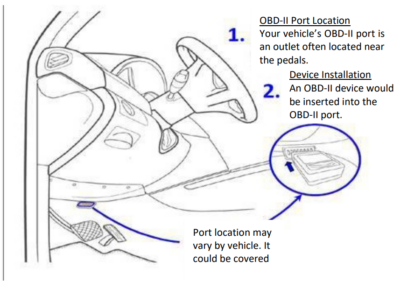
Implementation of MBUF could take many different forms, hence the need for New Jersey to study aspects of potential MBUF systems, such as methods for tracking miles traveled or ways to still encourage fuel efficient vehicles. Similarly, the Federal Highway Administration (FHWA) has committed to $18.7 million in innovation-oriented funding towards exploring MBUF (1). Notably the Eastern Transportation Coalition (ETC), comprised of New Jersey, 16 other states, and District of Columbia, received support from the FHWA in its exploration of MBUF. The ETC’s “National Truck Pilot and State Passenger Vehicle Pilot” has rolled out four mileage reporting options, with two of them being plug-ins to vehicles’ on-board diagnostic port called a OBD-II Port. One connected plug-in utilizes GPS and the other records miles traveled without GPS.
Participants will be able to choose from plug-in options provided in the ETC study (top left), GPS units (bottom left), or inputting information through smartphone applications. Courtesy of the Eastern Transportation Coalition
The other two, non-plug-in options for tracking miles are manual entries of distances recorded by odometers and in-vehicle telemetry. The manual entry is the basic “low-tech” option where the participant provides monthly odometer readings to the Pilot program either through logging into an account to type in the readings or alternatively, they can get a reading automatically by taking a picture of the odometer through an app. For newer vehicles with more advanced electronics, participants can enable their vehicles’ in-vehicle telemetry to automatically send relevant odometer information. Detailed step-by-step instructions for authorizing In-Vehicle Telematics will be provided to the approved participants after enrollment.
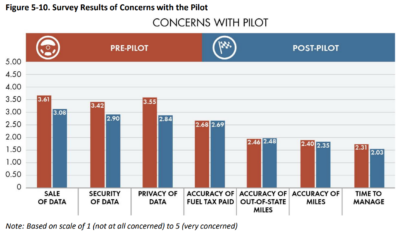
Beyond the technical experimentation with hardware, a past phase of the ETC pilot gauged the opinions of motorists and truckers on MBUF systems. For instance, 52 percent of passenger vehicle participants expressed some level of concern about privacy in a MBUF system at the start of their participation (2). By the end of the pilot, however, only 7 percent still had such concerns due to the privacy practices incorporated into how the plug-in technology was utilized. Strategies to ensure privacy, such as the legal prevention of data sales to third parties and the automatic destruction of user data 30 days after the pilot may have allayed some concerns. If representative of the wider public, this change in opinion suggests that reservations about MBUF may be overcome with greater exposure to the system and responsible implementation.
Current results suggest a general reduction in common MBUF concerns after participation. Courtesy of the Eastern Transportation Coalition.
Several other observations and findings from the pilot were reported; for example, motorists and truckers were especially concerned that the MBUF may unfairly impact residents of rural areas, drivers of fuel efficient vehicles, and in-state drivers. There were also worries regarding if reporting and paying miles under a MBUF would be burdensome or convoluted (3). However, information from the previous Phases of the ETC’s pilot actually shows that on average rural drivers would spend less money in a MBUF since they tend to ride less fuel efficient vehicles (2).
Depending on the structure of a MBUF, different rates of payment could incentivize vehicle adoption based on fuel efficiency or EV-status. However, individuals from the trucking sector have expressed concern with this since smaller trucking firms tend to use older, less efficient vehicles; similarly, drivers of older model, less fuel-efficient passenger vehicles may be opposed to such a tiered pricing scheme. A truncated report by the ETC recommends avoiding the tiering of fee rates by fuel efficiency for these reasons. All the same, there is flexibility in the formulation of MBUF to reward fuel efficient motor vehicles, if one-day desired by the public or environmentally necessary.
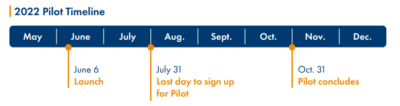
The Eastern Transportation Coalition’s present timeline for NJ Participants in the MBUF Pilot Study. Courtesy of the Eastern Transportation Coalition.
Continued participation and feedback in New Jersey on the ETC’s MBUF Pilot is therefore critical in assessing how best to ensure that future implementation is fair and effective. Participating is free; NJ participants will receive a $50 gift card for their completion of a pre-study survey at a location of their choice from a select list (4), and another $50 gift card for the completion of a post-study survey, as well. All program-related data will remain secure and confidential, as the data will be destroyed shortly after the completion of the Pilot.
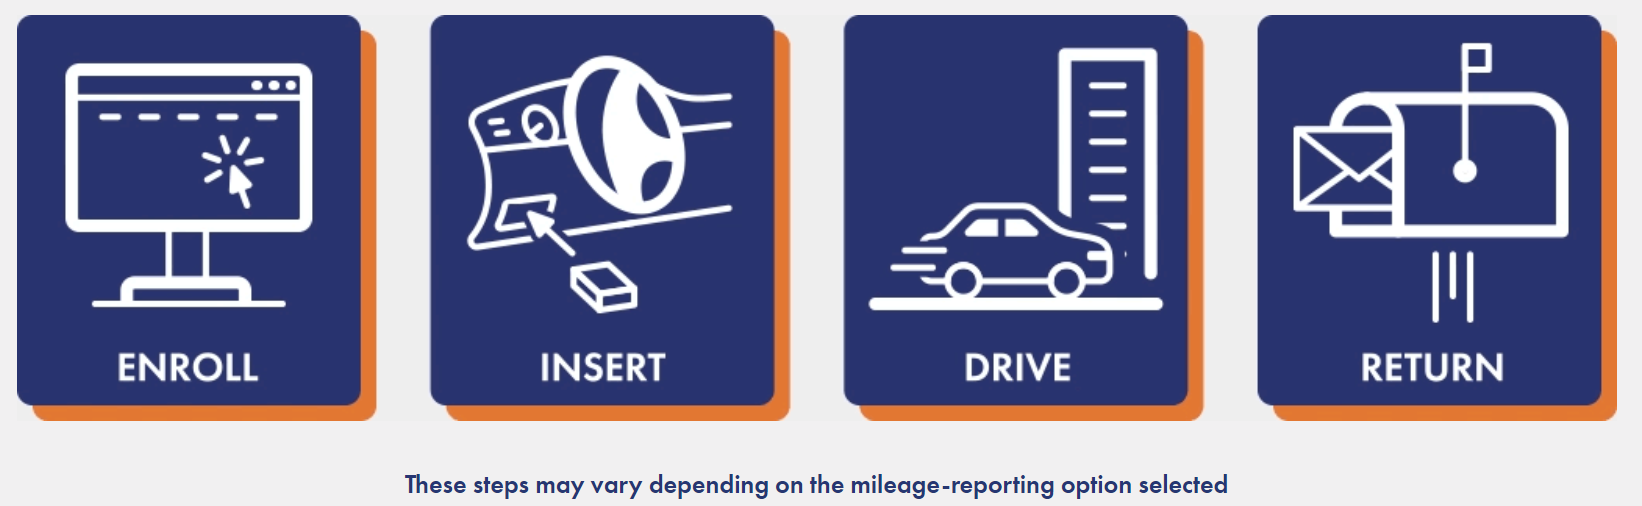
Participating is free and as easy as four steps. Courtesy of the Eastern Transportation Coalition.
Your participation would take the form of four steps (4):
Enroll - Fill out the enrollment form by clicking the link on the website.
Insert - Plug a small device into your vehicle to record mileage.
Drive - Then drive as you normally do.
Return - After a few months, mail back the device
If you are interested in testing the technology and offering your insights in an investigation that could future transportation funding in New Jersey, please visit NewJerseyMBUFpilot.com to learn more and enroll by July 31st to participate in this innovative program.
If you have questions, contact a Pilot team member at 609-293-7800 or NewJersey@MBUFpilot.org.
The Eastern Transportation Coalition provides useful information on their Pilot Program and MBUF at the following links:
The NJDOT Research Library maintains a “Did You Know” page to share basic facts about the research library, transportation research resources, and newly issued publications. The TRB Publications, May to June 2022 list includes recently published research in operations and traffic management, data information and technology, bridges and structures, pavements, safety and human factors, and construction, among others.
The most recent TR News, May-June 2022, features several articles on Pavement Preservation, Maintenance and Rehabilitation. In all, some 30+ research and general readership articles on pavements were issued through TR News and the Journal of the Transportation Research Board, Transportation Research Record.
For those who are not pavement lovers, a few planning and economic articles caught our eye, including:
Factors Affecting Driving Cessation of Older Adults and Their Satisfaction with Mobility Options This survey investigates how elderly adults choose to get around as they age and what influences those choices. The survey explores their experiences in walking and driving. It also makes suggestions about why some drivers choose to retire from driving and some continue to drive as they age.
Asymmetric Gasoline Price Effects on Public Transit Ridership: Evidence from U.S. Cities This paper explores how gas prices and transit service impact transit ridership short and long-run transit ridership. It indicates that shot term growth in ridership can be gained with increased service, but gas prices can serve a more impactful driver to ridership in the long term.
The ASTM Standards, January to April, 2022 list includes recently proposed and revised ASTM standards. As a reminder, the ASTM Book of Standards is available through the ASTM COMPASS Portal for NJDOT employees.
Please contact the NJDOT research librarian, Eric Schwarz, MSLIS, at (609) 963-1898, or email at library@dot.nj.gov for assistance on how to retrieve these or other publications.
The following is a list of research published by the Transportation Research Board (TRB) between May 1, 2022 and June 30, 2022. Current articles from the TRB may be accessed here.

 The New Jersey Department of Transportation’s (NJDOT) Bureau of Research invites you to share your ideas on the NJ Transportation Research Ideas Portal.