
On October 7, 2020, NJDOT hosted a Lunchtime Tech Talk! Webinar on the Analysis of Local Bus Markets with Deva Deka, Ph.D., Assistant Director, Research, at Rutgers – Alan M. Voorhees Transportation Center, and Susan O’Donnell, Senior Director, Business Analysis and Market Research at NJ TRANSIT. Dr. Deka began the presentation with a general description of the NJ TRANSIT system that operates approximately 250 bus routes throughout New Jersey. Bus riders constitute almost 60 percent of all riders using NJ TRANSIT services, including commuter rail and light rail. For many New Jersey residents, those buses are essential for meeting almost all daily travel needs.
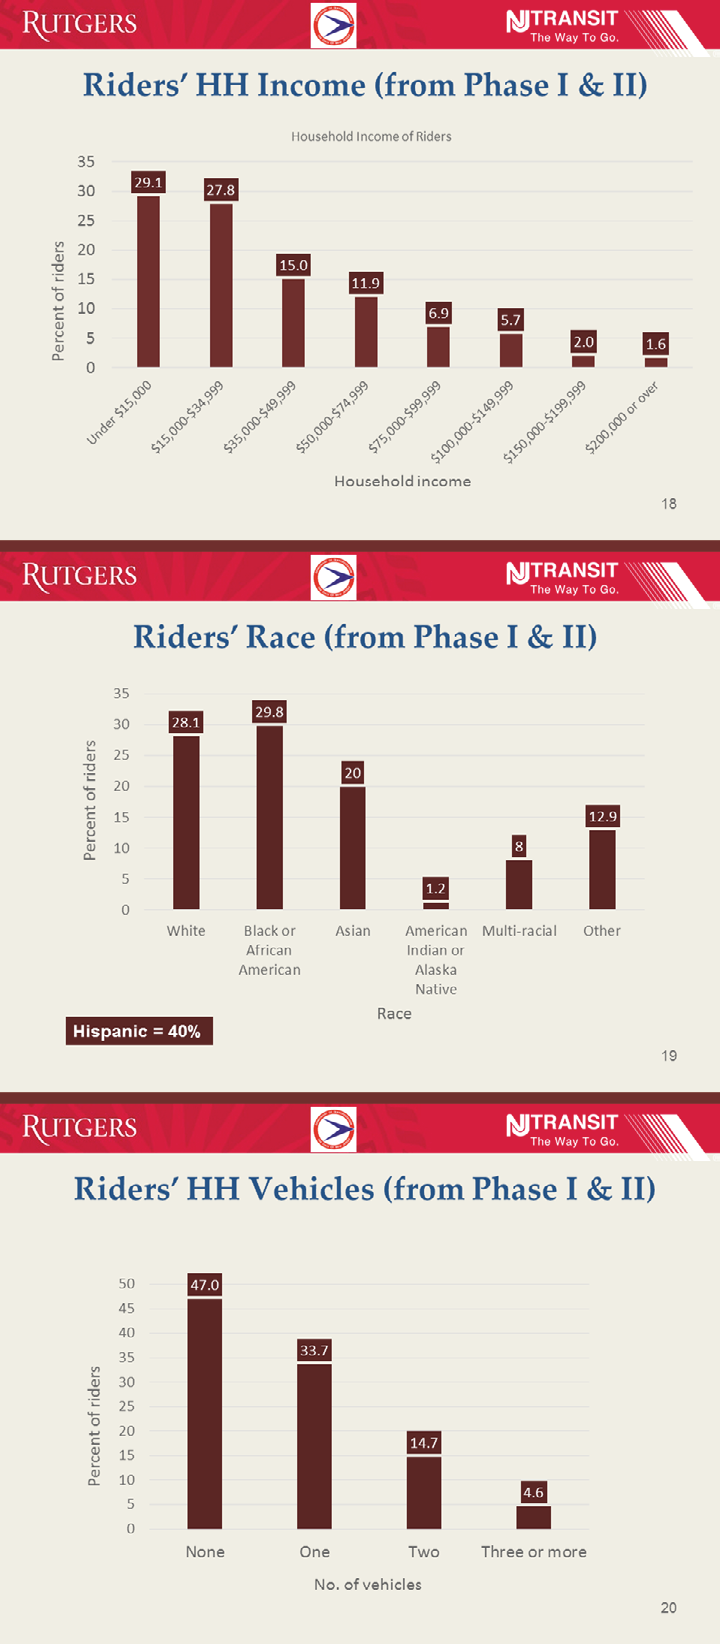
Dr. Deka provided a profile of the demographics of bus users, including household income, race, and vehicle ownership.
For the past five years, the Alan M. Voorhees Transportation Center of Rutgers University has been conducting onboard surveys of bus riders in different parts of New Jersey for projects funded by the NJDOT Bureau of Research and sponsored by NJ TRANSIT. Dr. Deka, the Principal Investigator for these survey studies, presented the bus survey methodology, and key findings. He described the questionnaire design, survey scheduling, training of surveyors, and the process of data collection, and the post-survey process that has involved data cleaning and weighting, and analysis. Over the five years, the project has generated clean data for over 15,000 riders.
Dr. Deka gave an overview profile of bus rider characteristics and trip characteristics found from the survey research. The survey showed that riders are predominantly Hispanic and/or African-American, lower-income, from households with no car or one car, and dependent on the bus system. The data support the essentiality of bus services for zero-car households and inform analyses of the broader impacts of bus services such as decreases in traffic delays and reductions in greenhouse gas emissions.
In the second half of the presentation, Ms. O’Donnell described the use of the survey data by NJ TRANSIT for planning purposes. The data supports travel demand modeling which replicates existing conditions and predicts future conditions to inform roadway projects and transit projects. This information is shared with New Jersey’s three Metropolitan Planning Organizations, the Port Authority of New York and New Jersey, and the New York Metropolitan Transportation Council. Current data is required in transit grant applications, and contributes to studies related to access to transit, corridors, intermodal systems, and transit oriented development.
To fulfill the agency’s obligations under Title VI of the Civil Rights Act of 1964, NJ TRANSIT uses the data to perform an equity analysis to evaluate the effect of fare changes or service changes on low-income populations and minority populations, and to provide data to help in developing a language assistance plan for Limited English Proficiency populations.
In addition, NJ TRANSIT uses the data when working with advertisers that want to target their message efficiently to specific demographic groups.
The agency’s Newark Bus System Redesign Project will use the data collected in fall 2019 to align and modify bus routes and explore service to new areas. This is the first, and largest, of multiple systems to be evaluated to bring the agency’s entire bus system up to date.
In closing, Ms. O’Donnell presented an update on bus use during the pandemic based on surveys given during April and June. The data shows how important the bus system has been to essential workers.
Following the presentation, the Dr. Deka and Ms. O’Donnell responded to questions asked through the chat feature:
Q. What was the number of questions asked on the survey and what incentives were offered?
A. The survey comprised about 30 questions. Incentives helped increase interest in the surveys and respondents had a chance of winning 1 of 5 $100 gift cards.
Q. Did you consider using IPads rather than paper-based intercept surveys?
A. Dr. Deka noted that they did consider them, but use of IPads limits the number of surveys that can be collected at one time. The surveyor has to stay with the individual using the IPad, and cannot approach other riders at the same time, limiting the efficiency of the survey-taker. Dr. Deka also referenced a Mineta Transportation Institute report that compared data quality and costs for different approaches to on-board transit passenger surveys that found efficiencies with the paper-intercept approach for bus users. Ms.O’Donnell noted that this technology might work at a station or on a platform because a number of surveyors can be located in the same place but is difficult to use on a crowded bus. During the pandemic, IPads probably could not be used due to safety concerns with touching and handling equipment.
Q. What are typical variables used to weight the data to the total ridership?
A. The sample is weighted by direction of the bus, time of day, and the run. A trip is from an origin to the destination and all trips combined is a run. They do not weight the sample by demographic variables or geography because they do not have solid information on the total transit user “universe” population related to these variables.
Q. Did you compare rider survey results by types of service area?
A. No. While there are some suburban routes if you segment or categorize by origins, such as Morristown, almost all routes are generally very urban. It would be possible to use the data to compare by counties.
Q. What is the delay imposed by traffic congestion on buses?
A. Traffic impacts have been an issue that has been looked at by traffic engineers at Rutgers – CAIT some years ago. They collected data traffic signal timings at intersections that the bus traveled through and applied VISSIM for simulations. Dr. Deka said that he could connect anyone interested with the detailed technical methods that the researchers used on that traffic impact study, if they’re interested.
The presentation given by Dr. Deka and Ms. O'Donnell can be downloaded here
A recording of the webinar is also available (see right).