Tech Talk! Launching Micromobility in NJ and Beyond

Micromobility Tech Talk was held on February 20, 2020.

Micromobility Tech Talk was held on February 20, 2020.

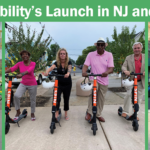
The NJDOT Bureau of Research hosted a Tech Talk! Event, Micromobility’s Launch in NJ and Beyond, that explored the current state of micromobility as a shared transport option in the U.S. and highlighted recent research on cities that have begun to develop and/or refine policies for their bike share and e-scooter programs. In New Jersey, Hoboken and Asbury Park have been on the leading edge by piloting micromobility programs. The speakers presented each city’s experiences with bike-share and the introduction of e-scooters, as well as the demographics of usage, user satisfaction, and community receptivity. Discussion of the nuts and bolts and the challenges of ramping up shared mobility options included: needed infrastructure improvements; marketing and education to attract users and promote safety; law enforcement; and staffing, funding and revenue sharing. The event was held in the NJDOT Multipurpose Room on February 20, 2020.

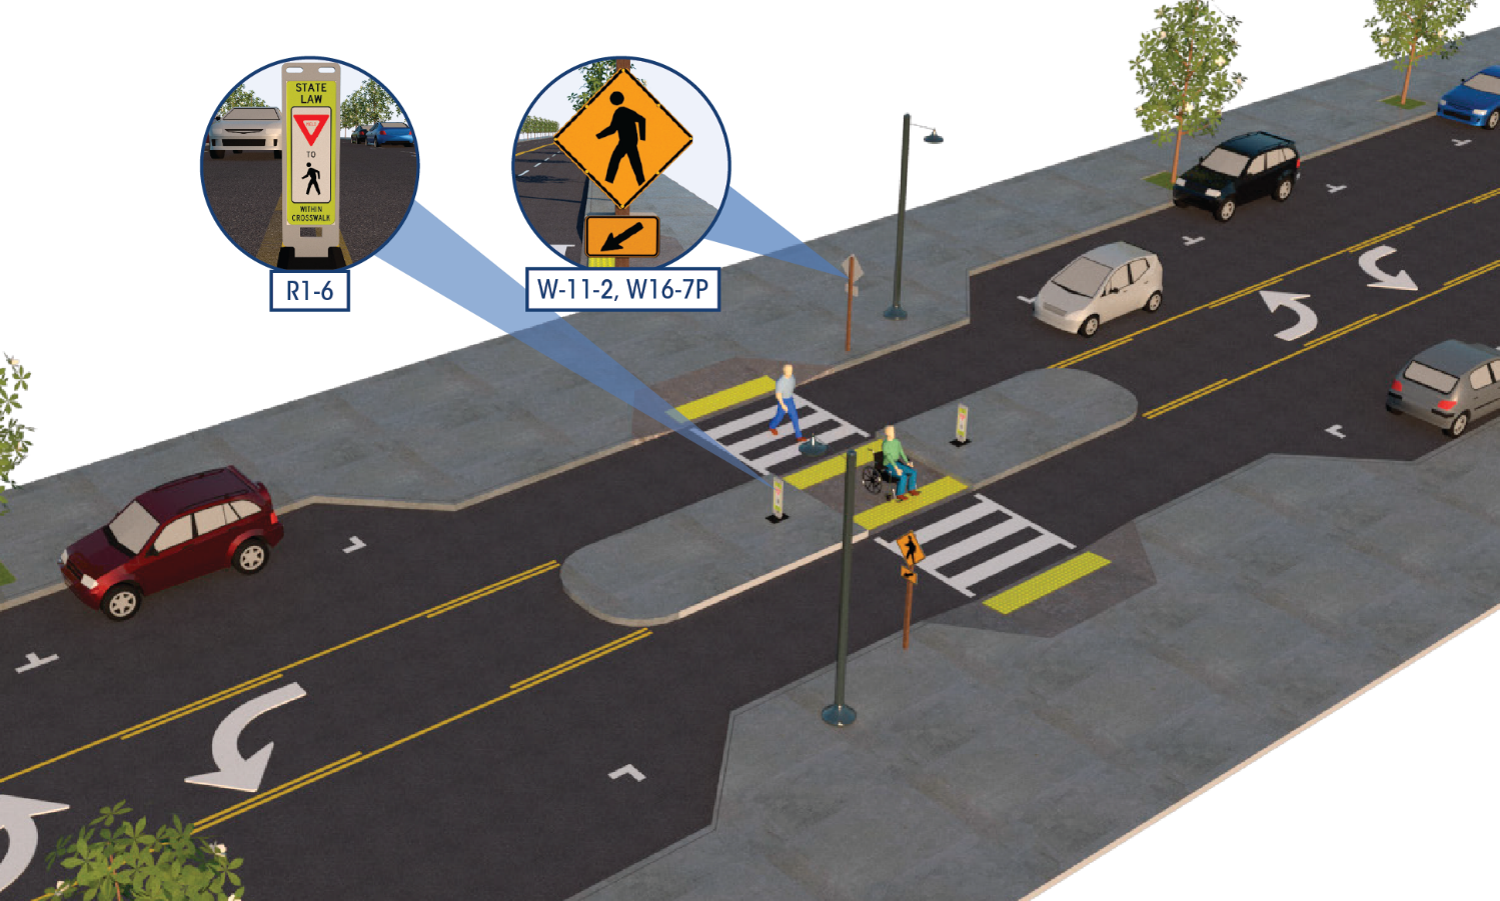
What is micromobility? The presenters agreed that micromobility includes transportation devices such as electric scooters, bikes and e-bikes to travel shorter distances generally in urbanized areas, often to or from another mode (e.g., bus, train or car).  These modes of transport tend to be associated with first-mile/last-mile use (i.e. to and from public transportation).  While not required, users typically rent e-scooters or bikes for a short period of time using an app. The devices are most suitable for operations in well-marked or protected spaces, such as bike lanes, and are operated by a single person at a time.

Charles Brown, MPA, CPD, Senior Researcher, Alan M. Voorhees Transportation Center, Rutgers, The State University of New Jersey. Mr. Brown discussed findings from two recent studies on bike share and e-scooter programs in the United States recently prepared by the NJ Bicycling and Pedestrian Resource Center.  The first part of his talk was on Evaluating the Spatial Equity in Bike Share Systems.  He began by defining equity, and framed the research as asking the question of whether low-income and minority populations enjoy the same range of transportation options available to other populations.  In this study, the research team examined the equity dimension of docked bike share systems in ten of the largest systems in the U.S.  He described the eight socioeconomic variables used as predictors and two dependent variable measures of bike availability — station density by area or station density by population — used to assess the spatial equity of major bike share systems. His presentation included GIS maps and bar charts to aid in visualizing equity disparities within each system and to compare systems. His talk included a rank order of the relative spatial equity of each of the major bike share systems; this methodology and scoring was also used to benchmark the three NJ-based bike share systems in Jersey City, Hoboken and Asbury Park.

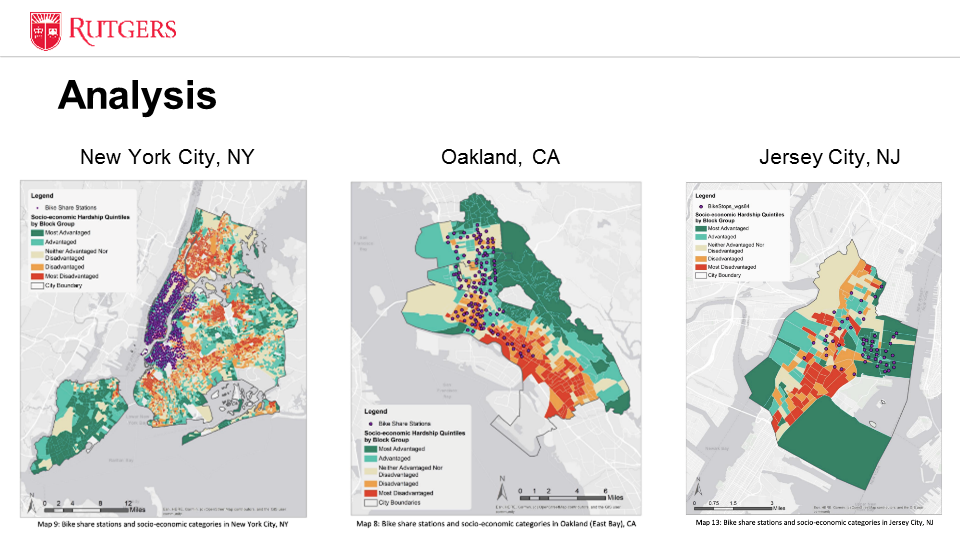
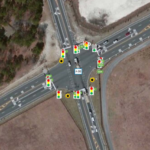
Comparative analysis of Bike Share locations

The E-Scooter Programs: Current State of Practice in US Cities report explores the state of practice for e-scooters in 11 cities in the U.S, taking into consideration applicable state and local regulations, access and equity concerns, and other aspects of managing e-scooters, with an ultimate goal of identifying best practices for incorporating e-scooters as a micromobility option in NJ communities.  Drawing from the report’s major themes, Mr. Brown offered several tips for implementing E-Scooter Share Programs in NJ, touching upon operational regulations and permitting requirements, managing the right-of-way, equitable service standards, public engagement and education, and data reporting.

Ryan Sharp, AICP, PP, Director, Transportation and Parking, City of Hoboken, NJ. Mr. Sharp began his presentation with a discussion of Hoboken’s experience with bike share since the program began in 2013. Hudson Bike Share currently has 40 stations, over 300 bikes, and over 10,000 active users during the peak season. When considering where to locate docking stations, the city solicited public input and mapped areas of public housing, communities of concern, and those residents living the greatest distance from transit. Funding for the program comes from sponsorships for each bike, membership and fare revenue, and advertisement. Bikes are generally used for first and last mile trips.

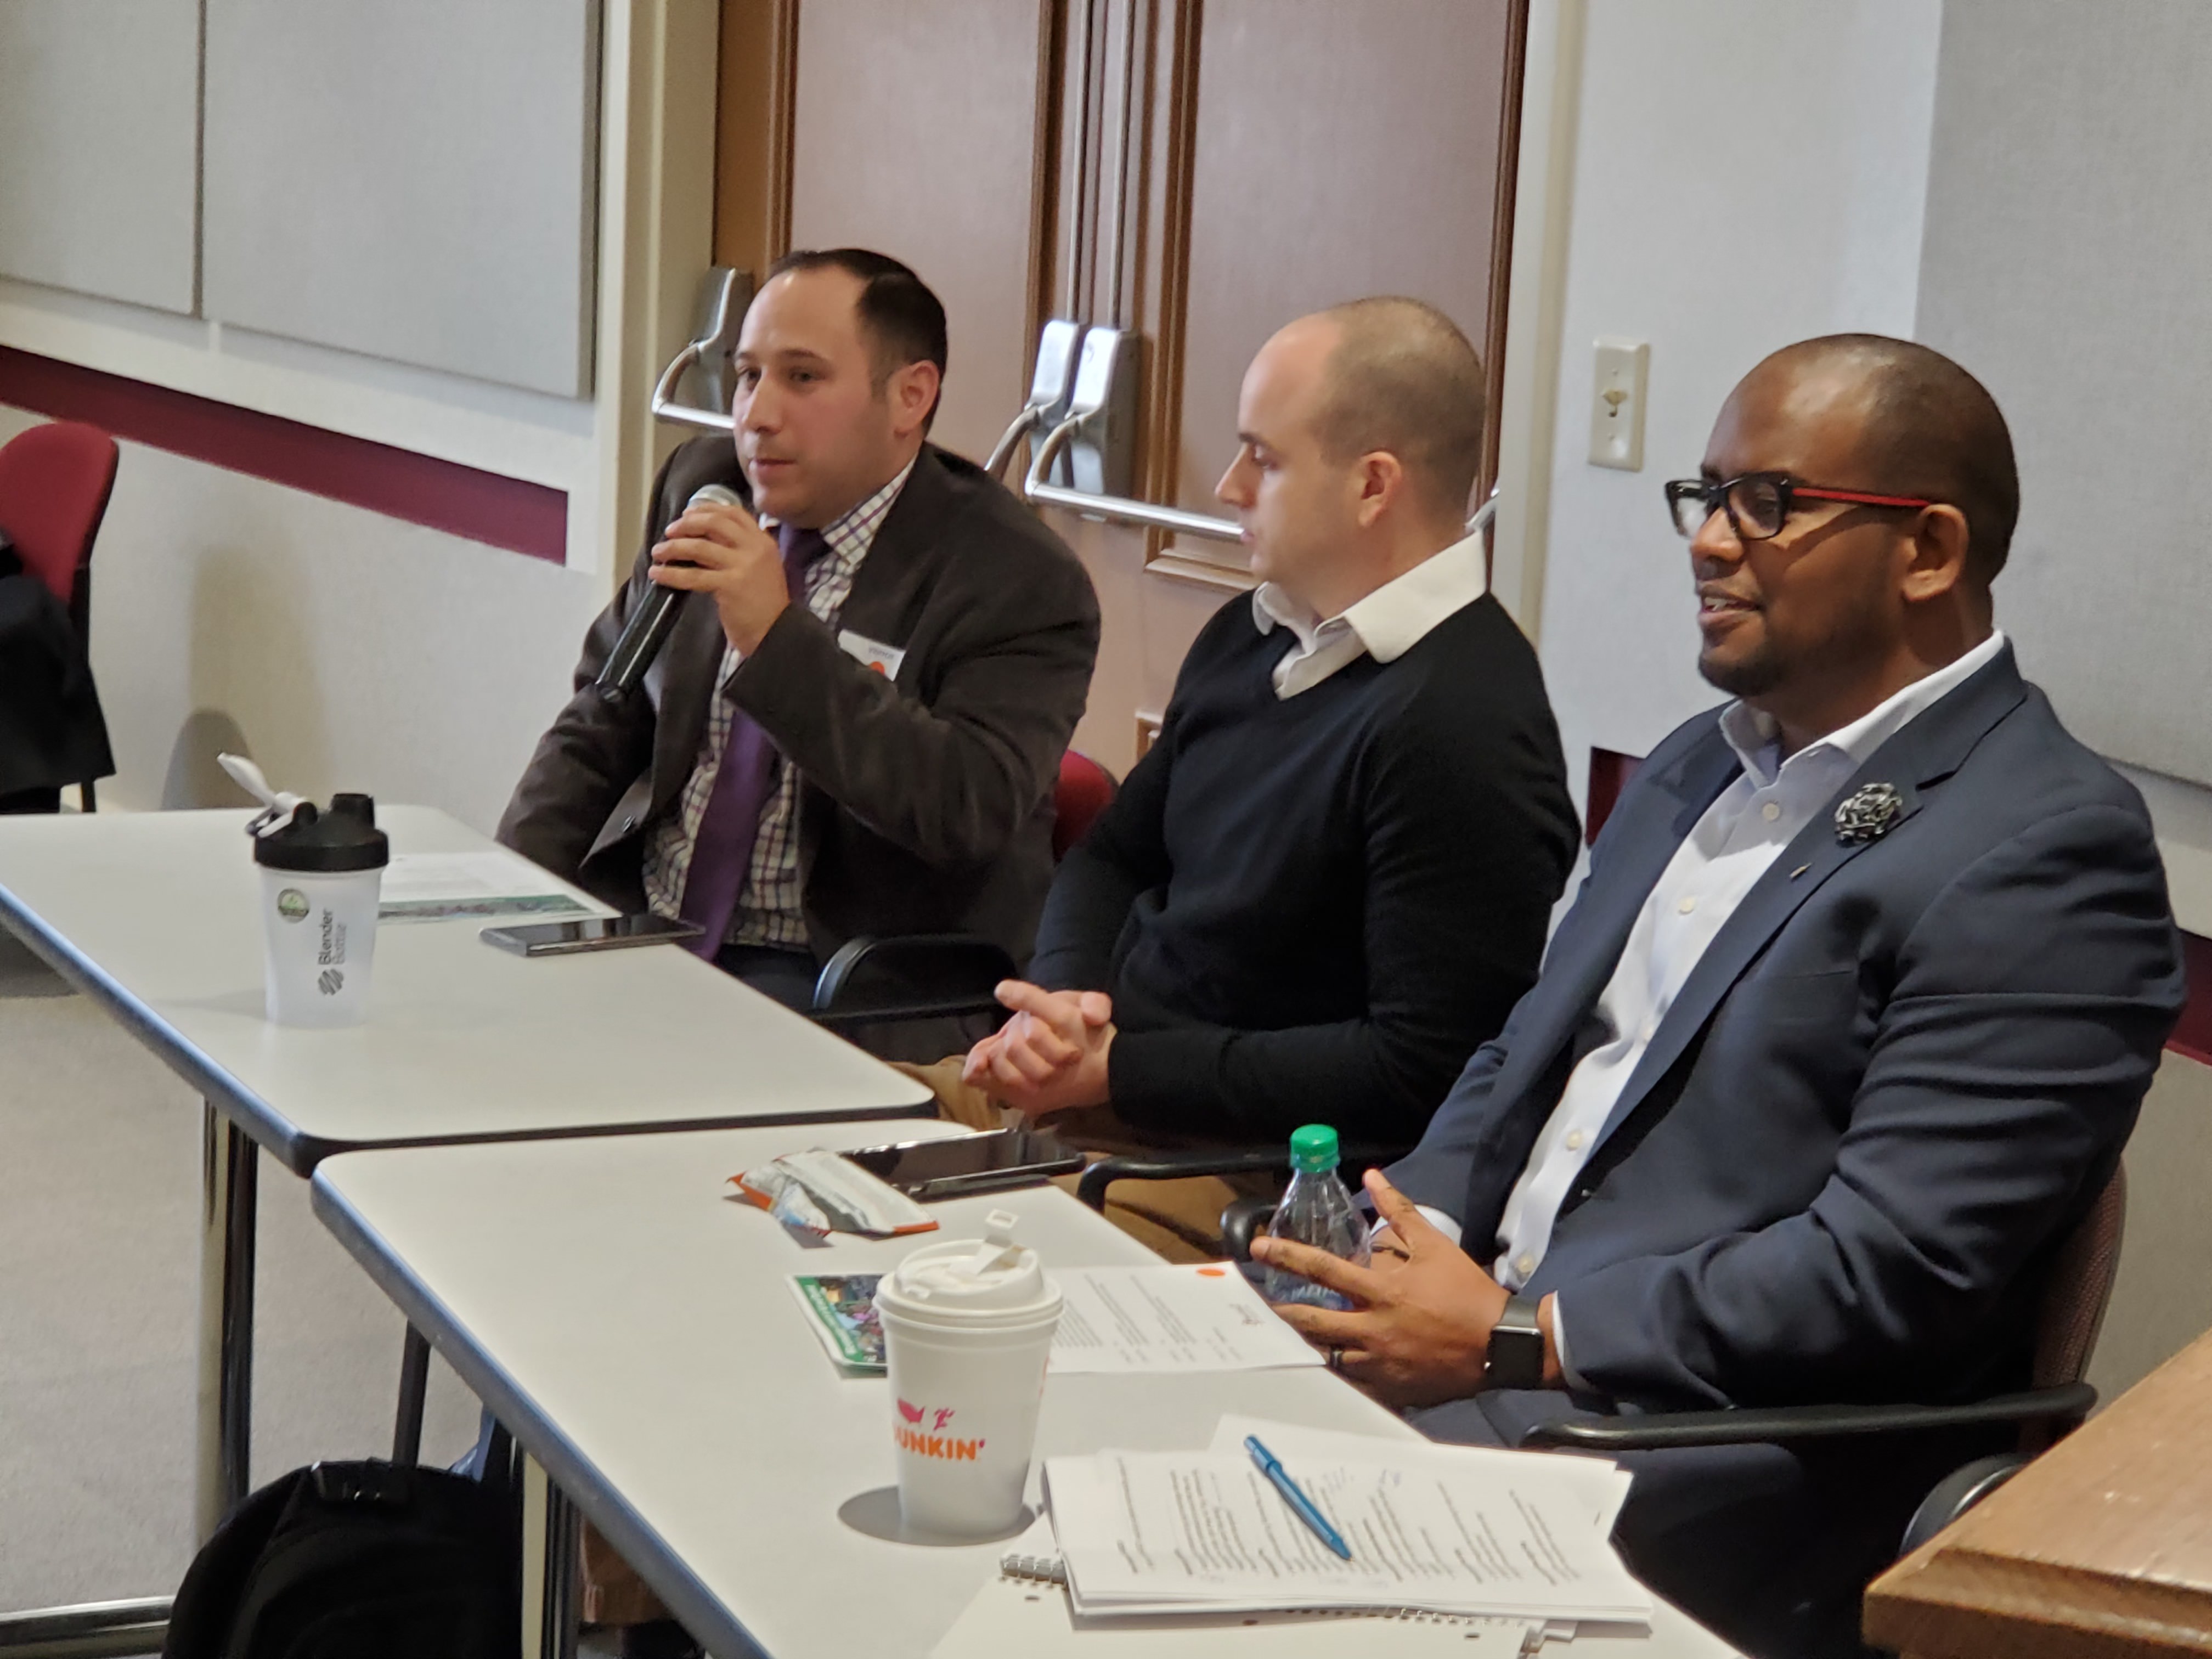
Mike Manzella, Ryan Sharp, and Charles Brown

Hoboken’s e-scooter pilot program began in May 2019 and ramped up quickly. In the first month, the city’s scooters had the highest usage rate in the world for several days. Mr. Sharp discussed safety issues that arose and the need for regulations and education to address underage riders, where and when to ride, speed limit, and parking. An internal e-scooter task force developed several strategies to address these concerns. The city conducted a survey of shared e-scooter use that showed reduced motor vehicle use among e-scooter riders.

Michael Manzella, AICP, PP, Director of Transportation, City of Asbury Park, NJ. Mr. Manzella noted that in this popular shore destination, bike share and e-scooters alleviate parking problems and provide a transportation option for the one-third of the city’s population who are carless. The city introduced a bike share program in 2017 which now has 8 stations with 40 bikes and consistently increasing usage over time. They have located stations in all four quadrants of the city so that people can access the convention hall, boardwalk, downtown, and rail station. Infrastructure is critical to program success and they have striped over four miles of bike lanes.

The city began a pilot e-scooter program in August of 2019 with 25 scooters, but ramped up quickly to 50 stations and 250 scooters. Through a survey, Asbury Park has found that scooter use is replacing car trips. Some safety issues have spurred a decrease in e-scooter travel speed, age verification requirement before rental, and increased education efforts including the use of social media.

The speakers agreed that bike share and e-scooters have a place in their communities. They will continue to promote and expand the programs while addressing safety concerns and the need for infrastructure.

The presenters made several additional points in response to audience questions and comments.

  • The e-scooter companies hire local residents to collect the scooters, charge them overnight, and rebalance distribution throughout the city. The companies track bike and e-scooter usage, and know when the peaks in use are and where to deploy them. Hundreds of people in Hoboken are earning some money through the program. Hoboken’s Housing Authority subsidized the charging costs so individuals did not pay for the increased electricity use.
  • When there are maintenance issues, the companies are quick to repair them and will refund rides if there is an issue. The 311 system accepts reports of maintenance issues and the cities receive monthly maintenance reports on the systems. Newer e-scooters can self-diagnose problems.
  • Infrastructure to support micromobility is essential, but current street design is not set up for increased bike and e-scooter use; there are challenges with design and right-of-way. Hoboken currently has a few protected bike lanes. Asbury Park has no protected bike lanes yet, but is working on a design for them. The speakers noted that dedicated infrastructure, along with signals and signage, may help with both safety and compliance issues.
  • Neither city has taken on-street motor vehicle parking spaces for use for the e-scooter program. Hoboken has claimed some unused street areas for scooter and bike parking.
  • Businesses and merchants have responded positively to the scooter programs. E-scooter users are able to access parts of the city they could not before and businesses, especially those establishments not on the main street or in the downtown area, are seeing more activity.
  • At this time, a smartphone and app are needed for e-scooters, but not for the bike share program. This creates a barrier for unbanked people than those without a smartphone. Asbury Park is hoping to roll out the SPIN access discount program to enable people to purchase e-scooter rides with cash.
  • Both Hoboken and Asbury Park will be introducing e-bikes.
  • NJ TRANSIT and Port Authority have banned any vehicle with lithium ion batteries; e-scooters cannot be taken on trains or buses.
  • E-scooters are deployed in light rain, but not in snow or heavy rain.
  • There is a 250 lb. weight limit for e-scooter use.

Resources

E-Scooter Programs: Current State of Practice in US Cities

Evaluating the Spatial Equity in Bike Share Systems

City of Asbury Park Bike Share Program

City of Asbury Park Scooters Program

Hudson Bike Share

City of Hoboken Electric Scooter Program

Presentations

Final Report Released for the Connected Vehicles Program Pilot Testing of Technology for Distributing Road Service Safety Messages from Safety Service Patrols

NJDOT’s top priority is to improve highway safety. To support this goal, in September 2018, New Jersey began a pilot study of the effectiveness of using connected vehicle technology to alert the motoring public to the presence of safety service patrol (SSP) workers at incident sites.  With the support of the NJ State Innovation Council (NJ STIC) and a STIC Incentive Funding grant of $39,600 awarded by FHWA, NJDOT piloted the use of Beacon Hazard Lights technology on 32 safety service vehicles to alert drivers to the presence of workers via the mobile navigation app Waze. The device, which is produced by iCone, uses GPS location and wireless communication technology to transmit the location of the SSP vehicles to the iCone Data Server in the cloud where it can be picked up by Waze. Together with the New Jersey Institute of Technology’s (NJIT) ITS Resource Center, NJDOT published a final report of their findings from the pilot project in December 2019, available here.

The SSP location and message shown on the Waze.com website. Photo Source: Cowan et al., 2019.

The primary goal of the study was to test the feasibility of the iCone technology on SSP vehicles by analyzing the time elapsed between device activation and Waze notification, to examine the Verizon 4G cellular network strength for potential coverage loss that could result in service disruption in communication, and to analyze the effectiveness of the equipment through several testing means. The methods of evaluation to complete these objectives were field and remote testing of the technology and documentation of the equipment installation and repairs. Field testing was conducted from January to October 2019 by activating the iCone-enabled SSP truck hazard lights and Dynamic Message Board (DMS) at 2-mile intervals along the entire 280-mile SSP coverage area. An analyst conducted remote testing through monitoring of the iCone and Waze web-based interfaces.

The results of field testing showed that, on average, communication with Waze was successful 76 percent of the time, 20 percent of the time the device communicated with the iCone Data Server but not Waze, and the remaining 4 percent of the time the device did not transmit its location to the iCone Data Server or Waze. The average time elapsed from the iCone device activation to its appearance in Waze was 2 minutes and 41 seconds. On two days of testing along the SSP coverage area, there was no communication between the iCone device and iCone Data Server or Waze.

In addition to field testing, analysts conducted remote testing of 85 active instances of the iCone device by observing the iCone and Waze web portals. In 59 percent of these 85 instances, the active iCone device was detected in Waze, with 29 percent of these successful detections showing the exact timestamp in both Waze and iCone. These results were shared with Waze so that the company could address the issues related to missing and delayed data transmission. For equipment evaluation, results showed that by April 2019, 12 of the units had technical problems that were attributed to the winter weather conditions in New Jersey including snow, road salt, and extreme cold. The iCone engineering team was responsive to the issues and re-evaluated the device design so that replaced units could withstand the weather conditions. A prototype of the newly-designed replacement devices was delivered to NJDOT in December 2019 and has been installed in five of the vehicles.

The installation of the device on an SSP vehicle by an iCone technician. Photo Source: Cowan et al., 2019.

The researchers believe that this technology evaluation pilot project was the first of any state DOT to seek to inform the public of SSP patrol vehicle locations with the sole objective of increasing safety.  The pilot project provided valuable analysis and lessons learned to inform next steps for NJDOT. Testing and analysis of installed devices and their replacements will continue until the end of the product warranty period on September 1, 2021. Additionally, researchers recommended further investigation of the disruptions and delays in the communication path from the iCone device to Waze.  Additional coordination with each technical partner during the steps of the testing process could help to identify the cause of service disruptions.

During the study, NJIT and iCone were unable to obtain Waze data showing how many people clicked the “thumbs up” to the message on the app. Future analysis should investigate how to gather reactions of the motoring public to Waze notifications. The researchers recommended exploring partnerships with crowdsourcing GPS navigation providers to further learn how drivers are reacting, which should include a data transfer process and strategies for reducing latency between iCone data server and Waze.

The Final Report contains additional information on the purpose of the research, the role of various stakeholder organizations in the research, a description of the technology devices and tools procured and used in the research, and the evaluation results.  The Final Report was submitted to the FHWA and is available to review here.

Featured Image Source: NJDOT, 2019.

NJ STIC 2020 Winter Meeting

The NJ State Transportation Innovation Council (NJ STIC) held its 2020 Winter Meeting on February 5th, 2020 in the NJDOT Multi-Purpose Room. The NJ STIC Agenda was distributed to the attendees along with handouts highlighting examples of past and ongoing NJ STIC innovative initiatives and how STIC incentive funding grants have been used.

After welcoming remarks from the NJDOT's Asst. Commissioner Michael Russo and Robert Clark, FHWA's Division Administrator, Helene Roberts from the FHWA NJ Division Office provided a brief update of the status of New Jersey's progress on Every Day Counts (EDC-5) innovative initiatives. Short presentations were given by the three Core Innovation Area (CIA) Teams—Safety, Infrastructure Preservation, and Mobility & Operations—reporting on the activities planned and underway. More detail on the innovative initiatives can be accessed here.

"Virtual Public Involvement" was the featured innovation topic for the meeting.  Representatives of New Jersey's three MPOs—Alan Huff from South Jersey Transportation Planning Organization, Melissa Hayes and Ted Ritter from North Jersey Transportation Planning Authority, and Alison Hastings from Delaware Valley Regional Planning Commission—highlighted examples of their agency's efforts, performance metrics, lessons learned and challenges using social media, polling, videos, surveys, and mapping tools among other strategies.

Amanda Gendek, Manager of the NJDOT Bureau of Research and Ms. Roberts then conducted an interactive polling exercise that invited attendees to use their cell phones to collaborate with the NJ STIC leadership team. Participants were asked a series of questions exploring their interest and soliciting their input on possible topics for a future STIC meeting that would feature breakout sessions on the EDC-5 innovative initiative. The results from the interactive polling exercise and informal feedback given throughout its administration will assist the leadership team in planning a future event.

Ms. Gendek noted that "NJ STIC Examples in Excellence" will be featured at the NJ TransAction Conference 2020 to be held on April 28, 2020 at the Tropicana in Atlantic City at 4:00pm. And look for an article on NJDOT's UAS Demonstration for the TRB representative to be published in the Jan/Feb 2020 TR News.  Attendees were also informed of an upcoming Tech Talk! Event, "Micromobility in New Jersey and Beyond"  scheduled for February 20, 2020 in NJDOT's Multi-Purpose Room for which registration is open. The event will highlight research conducted by the NJ's Bicycle Pedestrian Resource Center and feature speakers intimately familiar with Hoboken and Asbury Park initiatives to bring bike share and e-scooters to their communities. 

She also announced that the Bureau of Research would like to create short videos on STIC innovative initiatives that local agencies have implemented in order to highlight these accomplishments and encourage adoption by others. Contact her if you would like to participate.

Finally, attendees viewed the new NJ Build a Better Mousetrap video featuring Gerald Oliveto in NJDOT Operations Support and Engineering with the 2019 winning innovation, the Bridge Fender Navigation Lighting Reflective Backup System. The video and a fuller description of the competition and innovation, can be found on the Build a Better Mousetap page.

The Spring Meeting is scheduled for May 6, 2020.

The NJ STIC Winter Meeting Presentations can be found in sections below.

Welcome; FHWA Update; Roundtable Recap
CIA Team Update: SAFETY
CIA Team Update: Infrastructure Preservation
CIA Team Update: Mobility and Operations
MPO Implementation of Virtual Public Involvement
Interactive Survey & Results
Roundtable, Reminders & Announcements, Wrap Up

NJLTAP – Proven Safety Countermeasures Workshops – Upcoming Events

New Jersey is currently a Federal Highway Administration (FHWA) focus approach state for both Pedestrians and Intersections, with approximately 24% of fatal and serious injury crashes involving Intersections and 27% involving Pedestrians and Bicycles. In New Jersey, approximately 60% of fatal and serious injury crashes are occurring on the local system.

The New Jersey Local Technical Assistance Program (NJLTAP) has partnered with the FHWA Division Office, NJDOT Bureau of Safety, Bicycle and Pedestrian Programs and Local Aid and Economic Development, and our three Metropolitan Planning Organizations (MPOs) to develop a half-day workshop focused on the FHWA Proven Safety Countermeasures and the funding available for improvements to the local system.

This workshop provides guidance on the FHWA Proven Safety Countermeasures that local public agencies can implement to successfully address roadway departure, intersection, and pedestrian and bicycle crashes. The course will provide emphasis on intersection and pedestrian safety countermeasures, as well as potential funding sources (both federal and state) for implementing such countermeasures. Further, emphasis will be provided to include ways to implement the countermeasures into existing projects as proactive low-cost solutions to safety improvements.

Registration is required to attend any of these workshop events to be in North, South and Central regions of NJ. AICP and PE credits will be available. There is no fee for these workshops, but advance registration is required.

Visit the NLTAP Training and Events page for more information and to register for any of the 3 workshops:

The Impact of SJTPO’s Traffic Signal Inventory on Signal Operations

As technology advances, so does the need for data—information that allows engineers, planners, and others to utilize innovative ways to improve transportation and safety. To implement smart traffic systems, whereby centrally controlled traffic signals and sensors regulate the flow of traffic, agencies must know the present state of their traffic signal infrastructure. The South Jersey Transportation Planning Organization (SJTPO), the metropolitan planning organization for four counties in South Jersey, sought to better understand their infrastructure by developing a database of all traffic signals in the region. Completed in 2017, the database provides local agencies with the information needed to target intersections and signals for upgrades and replacements. Replacement with newer integrated traffic signals improves traffic flow, allows for remote signal monitoring and regional signal maintenance, and supports bicycle and pedestrian improvements at intersections.

A traffic signal located in SJTPO’s region. (Source: Tracy, 2017)

In 2016, SJTPO sought to create a database for all traffic signals within Atlantic, Cape May, and Salem Counties. Previously, Cumberland County had developed a traffic signal inventory which SJTPO plans to integrate into the new, comprehensive database. SJTPO and county governments wanted to know the count, age, and types of signals in their jurisdictions. An SJTPO study in Vineland found that many of their signals were very old, with one using circa 1955 electromechanical components to operate. In addition, traffic signal maintenance progressively transferred from municipalities to counties and records of some signals were found to be deficient. The lack of information needed to properly maintain signals was a major impetus for creating the database, according to Andrew Tracy formerly of SJTPO (Source: Tracy, 2017).

Agencies across the country have created similar traffic signal databases. The Chicago Metropolitan Agency for Planning (CMAP), the regional metropolitan planning organization for Chicago and the surrounding seven counties, undertook development of a signal database in 2013 for the region, with the first version released to the public in 2018. CMAP’s goals for the database reflect those of SJTPO. The agency seeks to use the information for planning, and targeting specific signals and intersections for upgrades and replacement.

For an RFP issued to support its regional signal timing initiative,  SJTPO included a list of specific intersections identified by the counties for possible improvements. Extensive outreach to counties and municipalities to acquire signal data and plans took place prior to the database assembly to minimize the field work needed. For all data acquisition requiring field work, the subcontractor created an application to minimize errors with data input. The participating counties gave data collectors the keys to their controller cabinets along with a permission note in case police questioned them during their field work efforts. The signals were classified by features such as signal location, mast arm, head, sign, and presence of pedestrian push buttons. Additional information collected included intersection features such as ADA ramps, crosswalks, etc.

A look at SJTPO’s map and reviewer application for data input. (Source: Tracy, 2017)

Traffic data was also collected at identified intersections, including turning movement counts, queue lengths, delays, and travel times. This information could be used for traffic simulation modeling, performance measurement of intersections, and  revised signal timing plans. Extensive photography of the signals and intersections complemented the data set and provided visual aids. In total, 431 signals, including 258 traditional traffic signals and 173 beacons, were logged in the database across the 3 counties. The signal inventory was completed in 2017 and each county updates the database when a signal or intersection receives upgrades.

The traffic signal inventory database has created a variety of benefits for SJTPO and the region’s residents. One of the most noticeable benefits for local agencies has been access to data to target specific signals for upgraded technology, such as vehicle detection cameras and GPS clocks for signal coordination, or installation of new signals. The database can help identify intersections for bicycle and pedestrian facility improvements and greater accessibility for individuals with disabilities, such as wheelchair ramps and improved crosswalks. Signal upgrades benefit residents by improving traffic flow, and allowing for implementation of remote signal monitoring and signal maintenance at a regional, rather than local, level. Finally, the database reinforces knowledge preservation to ease any transitions in the event of staff turnover.

For other agencies considering a similar database, a Signal Inventory configuration is available via Collector for ArcGIS and performs similar functions as the SJTPO in-house application. Additional information on the process for assembling the SJTPO’s Traffic Signal Inventory Database can be found in a webinar (see below)  hosted by the Mid-Atlantic Geospatial Transportation Users Group.

Sources:

Chicago Metropolitan Agency for Planning. “Highway Traffic Signal Inventory: Draft Proposal.” CMAP, October 29, 2015. https://www.cmap.illinois.gov/documents/10180/481346/RegionnalSignals_Proposal_20151029_forRTOC.pdf/3aef6a03-a792-44ed-9515-11496c9c25f8.

South Jersey Transportation Planning Organization. “Request for Proposals: Regional Signal Timing Initiative.” SJTPO, July 13, 2017. https://www.sjtpo.org/wp-content/uploads/2017/03/SJTPO-RFP-Regional_Signal_Timing_Initiative.pdf.

Tracy, Andrew. October 30, 2017. The South Jersey Regional Traffic Signal Improvement Program. Presentation. https://www.sjtpo.org/wp-content/uploads/2017/11/CAC-10-30-2017-Andrew-Tracy-Signals.pdf.

Tracy, Andrew, Colleen Richwald, David Braig, and Matthew Duffy. October 12, 2017. https://www.youtube.com/watch?v=mMO7-NYuXZ0.

NJ STIC 2019 Fall Meeting

The NJ State Transportation Innovation Council (NJ STIC) held its 2019 Fall Meeting on November 19, 2019 in the NJDOT Multi-Purpose Room. The STIC Meeting Agenda was distributed to the attendees along with several handouts that provide examples of NJ STIC innovative initiatives and how STIC incentive funding grants have been used.

After his Welcome and Opening Remarks, Asst. Commissioner Michael Russo and Assistant Division Administrator for the FHWA NJ Office Valeriya Remezova informed attendees that the New Jersey STIC was one of three STICs nationwide to receive an AASHTO 2019 STIC Excellence Award. FHWA's Center for Accelerating Innovation and the AASHTO Innovation Initiative partner to promote innovations and recognize excellence within a STIC. The STIC Excellence Award recognized the NJ STIC for:

“…developing a culture of innovation with broad stakeholder participation, shared metrics, and an engaged leadership. The STIC established processes to identify and move new technologies into practice, including an online portal to solicit potential ideas. The STIC also created three teams—Infrastructure Preservation, Safety, and Mobility and Operations—to champion innovations. A new web page features information on the STIC's innovation initiatives and a searchable innovation database. New Jersey's STIC is advancing unmanned aerial systems for bridge inspection and traffic incident monitoring, including developing guidance and specifications. To improve motorist and responder safety, the STIC is promoting the use of crowdsourcing applications to notify the public where NJDOT Safety Service Patrol vehicles are working on roadsides."

Following a brief celebratory award presentation, the FHWA's Helene Roberts provided a recap of the topics discussed during the national STIC meeting held on October 24th, 2019.  The meeting was recorded and pre-meeting presentation slides from the national meeting are available through the FHWA Center for Accelerating Innovation portal for National STIC meeting recordings.

Tom Harman, Director of the FHWA Center for Accelerating Innovation, provided an engaging presentation, Towards a Culture of Innovation, inviting participants to consider seven key attributes of an innovator. His discussion of innovation explored key elements of why and how an innovation may be adopted, or diffused, within an organization or community.  He also highlighted some possible barriers, or challenges, that key opinion leaders and leadership may wittingly or unwittingly place that impede the adoption of innovation within a large-scale organization. He pointed to select state DOTs that are leading the way among STICs nationally in promoting a favorable culture for adopting innovations, noting how agencies and individuals can be differentiated in part by their tolerance for the risk of failure and the time it takes to adopt an innovation.

Mr. Harman’s talk touched upon various Federal program funding vehicles available within the Center for Accelerating Innovation, highlighted select innovations that are being widely adopted throughout the nation, and shed some light on the "innovations of interest" currently being considered for innovation funding in the next round (i.e., EDC-6), or through some other renamed or rebranded program vehicle. He encouraged attendees to share their ideas for possible future innovations.

Mr. Harman was also joined by Karyn Vandevoort, Program Manager Analyst from FHWA’s Pennsylvania Division who helped facilitate discussion among the NJ STIC participants during Mr. Harman's talk as well as offered some remarks on the proceedings of a recent conference on innovation held in Pittsburgh.

Ms. Roberts from the FHWA NJ Division Office also provided a brief update of the status of New Jersey's progress on Every Day Counts (EDC-5) Innovative Initiatives. Short presentations were given by the three Core Innovation Area (CIA) Teams—Safety, Infrastructure Preservation, and Mobility & Operations—reporting on the activities planned and underway. More detail on the innovative initiatives can be accessed here.

Amanda Gendek, Manager of the NJDOT Bureau of Research, described recent communications and technology transfer efforts to raise awareness of the NJ STIC and its mission, including several recent Lunchtime Tech Talks, webinars and a video product.  The recently completed video, Drone Technology at NJDOT, was also shown to the attendees.   The video highlights some of the accomplishments of the UAS Program and how the adoption of the technology delivers benefits that are changing how DOT performs various operations.

The meeting closed with a Roundtable discussion that highlighted how the NJ STIC is evolving and using its outreach and communications tools (e.g., website, videos, trainings and workshops, and Tech Talk events) to further disseminate innovative practices among its diverse set of stakeholders.

The schedule of STIC meetings for 2020 was presented.  The Winter Meeting is scheduled for February 5, 2020.

The NJ STIC Fall Meeting Presentations can be found in sections below.

Welcome; Award; FHWA Update; Roundtable Recap
CIA Team Update: SAFETY
CIA Team Update: Infrastructure Preservation
CIA Team Update: Mobility and Operations
Guest Speaker Tom Harman
Video: Drone Technology at NJDOT
Outreach & Coordination Efforts; Roundtable

Tech Talk! Webinar: The Connected Job Site

On November 14, 2019, FHWA sponsored an innovation exchange webinar, "The Connected Job Site," that was live broadcast by the NJDOT Bureau of Research as part of its Tech Talk! series, for NJDOT staff at NJDOT Headquarters in the Foran Building Training Room.

With the recent influx of new technologies such as smartphones, tablets, and drones, and their growing and widespread availability, many ingenious applications have been developed for their effective deployment in construction and operations and maintenance activities in transportation. These technologies have allowed for real-time project monitoring, improved communication among team members, documentation stored on the cloud, and more efficient online scheduling. During this webinar, attendees learned about what exactly connected job sites are, and how various local agencies from around the country have started to utilize these technologies in innovative ways.

FHWA launched the webinar with a short presentation, Ten Examples of Connected Technologies, that highlighted examples of tools and technologies found on the connected job site. The primary objective behind the adoption of these connected technologies is to save time and money and improve safety in operations.  Hardware like smartphones, tablets, laptops, wearable technology and various vehicles and equipment have streamlined communications and planning in performing field work, while software solutions like 3D Modeling and Building Information Modeling (BIM) have improved the accuracy and efficiency of digital representation for physical facilities and infrastructure design. Virtual reality (VR) technologies have also started to find applications in the field, allowing professionals to safely experiment and test ideas in an artificial environment and bring products and concepts to life through visualizations.  Using VR in conjunction with drone technology, for example, has allowed maintenance crews to safely examine parts of bridges that were previously hazardous to inspect. The advent of unmanned aerial vehicle systems, in general, has provided the ability to garner visual information at a lower cost than traditional methods, while keeping workers out of harm’s way.

Connected job sites do not always have to deploy new technologies; sometimes they just re-purpose applications of older technologies in conjunction with new ideas. GPS systems have been around for decades, but when used with new software they are immensely effective in improving efficiency.  Two case examples of this were provided by the local public agencies who participated in the webinar.

Township staff can review actual snow plow routes to improve cost-effective coverage and verify citizen complaints

The Township of Edison’s presentation, Improve Fleet Operations Through the Use of GPS and Telematics, provided by the New Jersey municipality’s Information Technology Manager, described some benefits and challenges of the installation of GPS tracking devices on its vehicle maintenance fleet.  During snow events, the Township was able to monitor the entire routes taken by its snow plow trucks and the specific segments where the plows were used.  Once the monitoring systems were in place, the Township found that it had the capability to more effectively evaluate individual citizen complaints of streets not being plowed adequately.  For example, the Township could check its mapped records of fleet route deployment during storm events, and see if the complaints were "true" and then determine whether a specific snow removal job needed to be repeated.  More broadly, the tool allowed the agency to ascertain whether designated routes were being followed by operators and whether the priority routes themselves were efficient and effective in both design and operation.

This capability had the added benefit of reducing the Township’s liability for alleged property damage. In fact, the Township found that some 50 percent of the claims that asserted that snow plows were hitting parked vehicles could not be substantiated after checking the GPS location of the snowplow trucks and their route history. Insurance claims and payouts were reduced by some 60 percent due to this capacity to technically validate the potential merits of a claim. The Township also found that it was able to improve efficiency in route designs, leading to less wear and tear on equipment, less use of salt and brine, and a reduction in person-hours and overtime costs.

The Township touched upon tool features that improved the monitoring of vehicles for preventative maintenance. As vehicles systems were now connected to a central hub, needed repairs were identified more quickly and systematically, and less dependent on individual driver reports of faults in a vehicle's operation.  Eventually, low use and high maintenance cost vehicles were better identified and retired, allowing for an overall fleet reduction of 35 percent which, in turn, has reduced costs for fuel, insurance, parts and labor.

For Lauderdale uses available individual vehicle operations measures to improve safety and support preventative maintenance progam for its fleet.

The City of Fort Lauderdale’s presentation, How to Improve Fleet Sustainability, jointly given by the City’s Program Manager for Fleet Services and their Automotive and Equipment Specialist, described several features and benefits of their fleet management program, including the use of geofencing. A geofence is a virtual perimeter dynamically generated for a real-world geographic area around a point location, or a predefined set of boundaries. It is typically used for security purposes and to better track people and equipment. Fort Lauderdale used geofencing to help preserve its infrastructure, as it was able to monitor overweight trucks using historic bridges; with this real time technology, they were able to reduce over-weight vehicles crossing the bridge by nearly 90 percent.

Vehicle tracking had the side benefit of making their drivers operate more safely.  The City found that its personnel were less likely to go over the speed limit if they were monitored, and “harsh events” such as braking and sharp turns were also reduced.  Examples of some of the specific and aggregate dashboard performance measures that can be monitored for equipment usage were highlighted.

In the dialogue following both presentations, it was clear that the adoption of the connected technologies changed the way business is being performed. Notably, the tools and performance measures permit increased tracking of the workforce on-the-job.  The presenters acknowledged that it can raise concerns about the level of monitoring available to the local public agency's management team.  However, according to the presenters, the implementation of the systems has generally improved the safety and efficiency of daily operations and contributed to improved maintenance and longevity of their fleets.

While the webinar shared just a couple of case examples primarily focused on fleet management, the FHWA hosts stressed that the future of connected job sites will only grow as the “internet of things” becomes more complex. Everything from automated vehicles, intelligent compaction, drones, and RFID scanners will continue to find new applications, and new ways to save money and enhance safety.

The Connected Job Site webinar is one in a series of Innovation Exchange webinars sponsored by the Center for Local Aid Support (CLAS) in the Federal Highway Administration's Office of Innovative Program Delivery. Through Innovative Exchange webinars, CLAS seeks to bring cutting-edge transportation leaders to the table to share ideas and out of the box innovative practices that have proven results.  More information about this webinar, upcoming webinars, and webinars available on demand can be found here.

How SJTPO Refined Their Congestion Management Process with Crowdsourced Data

Through the Everyday Counts (EDC) program, FHWA identifies and deploys established but underutilized innovations through a state-based model, with the goals of streamlining project delivery, improving roadway safety, decreasing traffic congestion, and incorporating automation. The fifth round of EDC kicked off in 2019 and included Crowdsourcing for Operations as one of ten initiatives.

As described by FHWA, "When combined with traditional data, crowdsourcing helps agencies efficiently implement proactive strategies that improve incident detection, traffic signal retiming, road weather management, traveler information, and other operational programs" (EDC-5). Crowdsourced operations data can include traffic, transit, bicycle, pedestrian, construction, and weather information collected in real-time by intelligent transportation systems (ITS) infrastructure and archived for planning use. One example of this traffic data is time and vehicle location collected via GPS probe-based sources, such as vehicles and smartphones. Through NJDOT and the Metropolitan Planning Organizations (MPOs), New Jersey has institutionalized the practice by incorporating crowdsourced data into multiple operational programs since 2008.

Congestion Management Process

An example of PDA Suite's Performance Chart tool displaying archived operations data for speed. Photo source: Tracy, 2019.

The South Jersey Transportation Planning Organization (SJTPO), the MPO that represents Atlantic, Cape May, Cumberland and Salem Counties, revised its Congestion Management Process (CMP) last year, with formal adoption in November 2018. A CMP is defined by FHWA as “a systematic and regionally-accepted approach for managing congestion that provides accurate, up-to-date information on transportation system performance and assesses alternative strategies for congestion management that meet State and local needs.” Metropolitan areas larger than 200,000 people are required to develop and implement a CMP as part of their overall transportation planning process for their region.

An effective CMP will help a region pinpoint congested roadways, determine multimodal performance measures, develop congestion management strategies and implementation methods, and assess the efficacy of the implemented strategies. While FHWA does not strictly define how to implement a CMP, they do provide a CMP Guidebook with an eight-step Process Model which SJTPO followed:

  1. Develop Regional Objectives for Congestion Management
  2. Define CMP Network
  3. Develop Multimodal Performance Measures
  4. Collect Data/Monitor System Performance
  5. Analyze Congestion Problems and Needs
  6. Identify and Assess Strategies
  7. Program and Implement Strategies
  8. Evaluate Strategy Effectiveness.

Along with the 2020 Regional Transportation Plan update, two important pieces of legislation drove SJTPO’s motivation to overhaul their CMP: Moving Ahead for Progress in the 21st Century (MAP-21) of 2012 and the Fixing America’s Surface Transportation (FAST) Act of 2015. Both of these laws established requirements for performance-based planning and programming by MPOs. Performance-based planning and programming consists of the following steps: identifying a transportation system’s needs and problems, prioritizing projects and programs for investment, and monitoring impacts of the projects. SJTPO revised the CMP methodology using recently acquired real-time and archived travel time data to establish performance measures for the extent and severity of congestion throughout the region. The archived operations data provides a more holistic picture of system performance, creates more relatable and user-friendly measures, and enables more sophisticated modelling.

PDA Suite's Bottleneck Ranking tool displays here all bottlenecks found on a specific date range by time of day, visualized by maximum queue length in miles. Photo source: Tracy, 2019.

Under a contract with NJDOT, the University of Maryland Center for Advanced Transportation Technology Laboratory (CATT Lab) provided all three New Jersey MPOs with access to real-time and archived data via the Probe Data Analytics Suite (PDA Suite). The PDA Suite is a web-based platform that consists of a range of data visualization and retrieval tools for real-time and archived probe data. The vehicle probe data is provided by multiple third-party vendors, including INRIX, HERE, and TomTom, that collect it via smart phone navigation apps. These companies anonymously aggregate the data which is then used by the PDA Suite tools to calculate metrics such as real-time speed data, travel time index, travel time reliability, queue measurements, statewide bottleneck ranking, and corridor congestion charts, among others.

An overview of the tools available in the PDA Suite. Photo source: Tracy, 2019.

Agencies can use the tool to download reports, create interactive maps and graphics, and download raw data for external analysis. The performance measurement data is available at both the corridor and regional level, with 1,556 roadway segments covered in the SJTPO region. SJTPO has used PDA Suite’s Bottleneck Ranking Tool to create congestion screening lists for all of their counties; the lists are then screened for outliers and confirmed with independent data sources. SJTPO will then meet with county and municipal stakeholders to gather their input to prioritize locations and develop a problem statement. So far, SJTPO has found PDA suite valuable for quantifying seasonal congestion, which traditionally is difficult to define. Compared to traffic counts, operations data has wider spatial and temporal coverage.

Lessons Learned

While this data has been incredibly valuable to SJTPO, the agency has learned there are several drawbacks when it comes to working with crowdsourced big data. False positives may occur that identify congested areas when a roadway segment has a low sample size of probe vehicles, or there is a typical traffic signal delay or an inaccurate calculation of historical reference speed. Additionally, there are many ways to parse and analyze a dataset, which can lead to different results. To accurately represent the travel experience, organizations need to develop and use consistent methodology.

Looking forward, SJTPO plans to continually update their CMP. The document will evolve with additional insight from internal documents and studies (including the 2020 Regional Transportation Plan), changes to planning guidelines, and shifts in regional demographic and fiscal resources. In 2020, a Congestion Management Process Activity Report will be issued to summarize findings to be incorporated in the 2045 Regional Transportation Plan Update.

Sources:

CATT Lab. “Probe Data Analytics Suite.” CATT Lab. University of Maryland, 2019. https://www.cattlab.umd.edu/?portfolio=vehicle-probe-project-suite.

FHWA. “Crowdsourcing for Operations.” Center for Accelerating Innovation. U.S. Department of Transportation Federal Highway Administration, October 22, 2019. https://www.fhwa.dot.gov/innovation/everydaycounts/edc_5/crowdsourcing.cfm.

FHWA. “Congestion Management Process (CMP).” Organizing and Planning Operations. U.S. Department of Transportation Federal Highway Administration, February 11, 2019. https://ops.fhwa.dot.gov/plan4ops/focus_areas/cmp.htm.

SJTPO. “Congestion Management Process.” Congestion Management Process (CMP). South Jersey Transportation Planning Organization, 2019. https://www.sjtpo.org/CMP/.

SJTPO. “Congestion Management Process: Methodology Report.” Congestion Management Process (CMP). South Jersey Transportation Planning Organization, 2018. https://www.sjtpo.org/wp-content/uploads/2019/03/CMP-Report-2017.pdf.

Tracy, Andrew. “The Use of Real-Time and Archived Operations Data for Congestion Planning and Incident Management.” TransAction 2019. April 17, 2019. https://www.njdottechtransfer.net/wp-content/uploads/2019/11/SJTPO-TransAction-2019-Operations-Data-slides.pdf.

Spotlight: New Technology Evaluations

The New Technologies and Products (NTP) Unit in NJDOT’s Division of Bridge Engineering and Infrastructure Management reviews and evaluates new technologies and products submitted by manufacturers, vendors and suppliers. The unit is currently evaluating over 50 products for possible use at NJDOT to address needs related to safety, pavement, drainage, bridges and structures, among other categories.

NJDOT defines a new technology as “any product, process, or material used in the construction and maintenance of roadways and bridges that is not covered by existing NJDOT standard specifications or construction details, thereby requiring a formal evaluation for approval.” Products may receive a formal evaluation if they are finished and marketed, and address high priority needs.

The unit maintains the New Technologies and Products database of tested products from 2002 to the present. The database displays the category, the name of the product with a link to the product webpage, the company and the status of the evaluation. The NTP database status code legend is available on the NJDOT New Technology Evaluations webpage. Products may be actively undergoing testing, in a demonstration phase, or specification development phase, or in other stages of evaluation.

If, through the evaluation process, a technology or product is found acceptable for use on NJDOT projects, development and implementation of a standard specification, construction detail, or design guideline is still needed through a baseline document change.

Evaluation typically takes two to three years, although technical information and testing data from other testing agencies may expedite the process. Proposals for use of a new technology on a specific project, and recurrent use of an alternate or non-standard item on several projects, can lead to acceptance as a standard item.


EDC-5 STEP – Safe Transportation for Every Pedestrian

On October 30th the NJDOT Bureau of Research hosted the Lunchtime Tech Talk! Event on “EDC-5 STEP: Safe Transportation for Every Pedestrian.” This event featured Peter Eun, a Transportation Safety Engineer with the Federal Highway Administration’s Resource Center’s Safety & Design Technical Service Team in Olympia, Washington. Mr. Eun discussed recent initiatives from FHWA regarding improvements in pedestrian safety and accessibility.

According to the National Highway Traffic Safety Administration, while 2018 featured a decline in overall fatalities on our roads, there was an increase of pedestrian fatalities, highlighting the increased need for action. Considering that over 72% of pedestrian fatalities occur at non-intersection locations, Mr. Eun focused much  of his presentation on cost-effective countermeasures that can be systemically applied to reduce these crashes and save lives.

In his talk, he described how roadway configuration, traffic volumes, and posted speed limits inform the selection of appropriate countermeasures. By way of example, he referred to the Crosswalk Markings section of the Manual on Uniform Traffic Control Devices (MUTCD Section 3B.18):

Crosswalk Visibility Enhancements

Crosswalk Visibility Enhancements

“new marked crosswalks alonewithout other measures designed to reduce traffic speeds, shorten crossing distances, enhance driver awareness of the crossing, and/or provide active warning of pedestrian presence, should not be installed across uncontrolled roadways where the speed limit exceeds 40 mph and /or either has 4 or more lanes without a raised median or island and ADT of 12,000 or more, or 4 or more lanes with raised median island and ADT of 15,000 or more”.

Setting the foundation for countermeasures,  Mr. Eun cited grave statistics from research on how increasing speeds lead to greater serious injuries or fatalities for pedestrians and warned of a diminishing “cone of vision” at higher speeds as visual field and peripheral vision narrows. He shared a provocative safety video to convey how even small differences of speed can affect the ability of drivers to react and avoid crashes to the detriment of pedestrians.

Describing them as the “Spectacular Seven”, Mr. Eun highlighted the following countermeasures:

  • Rectangular rapid flashing beacons (RRFBs) are active (user-actuated) or passive (automated detection) amber LEDs that use an irregular flash pattern at mid-block or uncontrolled crossing locations. They significantly increase driver yielding behavior.
  • Leading pedestrian intervals (LPIs) at signalized intersections allow pedestrians to walk, usually 3 to 4 seconds, before vehicles get a green signal to turn left or right. The LPI increases visibility, reduces conflicts, and improves yielding.
  • Crosswalk visibility enhancements, such as crosswalk lighting and enhanced signage and markings, help drivers detect pedestrians–particularly at night.

    Pedestrian Refuge Islands

    Pedestrian Refuge Islands

  • Raised crosswalks can serve as a traffic calming measure and reduce vehicle speeds.
  • Pedestrian crossing/refuge islands allow pedestrians a safer place to stop at the midpoint of the roadway before crossing the remaining distance. This is particularly helpful for pedestrians with limited mobility.
  • Pedestrian hybrid beacons (PHBs) provide positive stop control for higher-speed, multilane roadways with high vehicular volumes. The PHB is an intermediate option between a flashing beacon and a full pedestrian signal.
  • Road Diets can reduce vehicle speeds and the number of lanes pedestrians cross, and they can create space to add new pedestrian facilities such as pedestrian crossing/refuge islands.

Using case examples from all over the country, Mr. Eun discussed several example situations where these countermeasures could be used, as well as the benefits to implementing them and the difficulties that may be encountered during implementation. Since expecting pedestrians to travel significantly out of their way to cross a roadway is unrealistic and counterproductive, improvements must be made to make crossings more accessible and more safe. By focusing on uncontrolled locations, agencies can address a significant national safety problem and improve quality of life for pedestrians of all ages and abilities.

Click for presentation

Mr. Eun then addressed a systemic approach to identifying safety issues and appropriate STEP countermeasures. Using this systemic approach, agencies can focus on countermeasures that address risk rather than specific locations. Once a risk factor characteristic of a number of crashes has been identified, agencies can be proactive and address that risk wherever it appears within the system. A system-based approach acknowledges crashes alone are not always sufficient to determine what countermeasures to implement, particularly on low-volume local and rural roadways where crash densities are lower, and in many urban areas where there are conflicts between vehicles and vulnerable road users (pedestrians, bicyclists, and motorcyclists). As such, systemic safety analysis does not require extensive data or complex analysis methods to be effective, just the desire to make the biggest safety impact with limited resources.

Resources

View the presentation: Eun Peter (2019). Every Day Counts so STEP up (Safe Transportation for Every Pedestrian).

View the Australian Safety PSA Video: