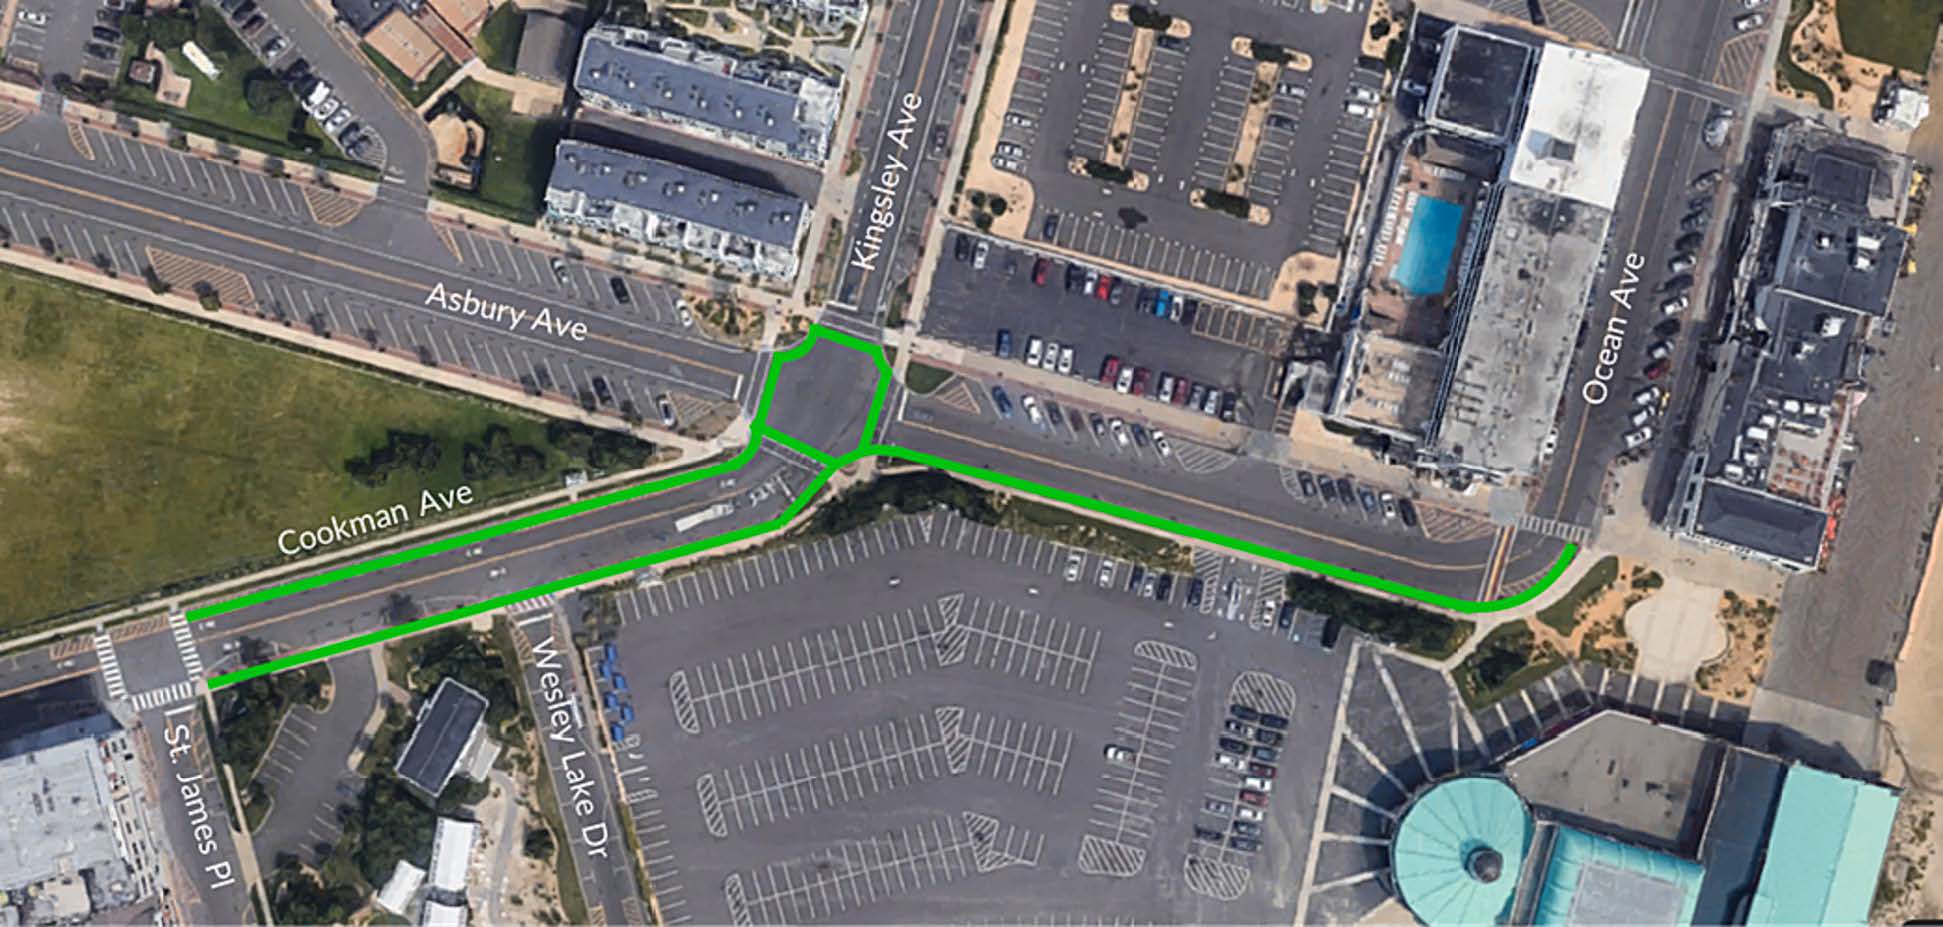
We had the opportunity to speak with Swathi Malluru, a PhD candidate at Rowan University and recipient of the 2024 NJDOT Research Showcase Best Poster Award. Her research focuses on sustainable pavement rehabilitation, including the Full-Depth Reclamation (FDR) and Cold In-Place Recycling (CIR) processes that were the subject of the performance evaluation recognized with the Best Poster Award. In this interview, Ms. Malluru discusses her journey in transportation engineering, from her background in sustainable materials to her work optimizing stabilizers for FDR and CIR. She hopes that her research can provide economic and environmental benefits and shares how it could shape future NJDOT policies.
Q. Congratulations on receiving the Best Poster Award at the 2024 NJDOT Research Showcase. Could you tell us about your prior educational and research experience, and how you came to be a PhD student at Rowan University?
A. First of all, I would like to thank you for your time. I pursued my master’s in Transportation Engineering from the Indian Institute of Technology. At the university, I learned about pavement materials, specifically pavement rehabilitation techniques and pavement design analysis. Then, I worked on a steel slag aggregates project. In this project, I completely replaced the conventional natural aggregates with steel slag aggregates in hot mix asphalt mixture and evaluated the performance to understand if slag could function as an alternative to the conventional natural aggregates. This motivated me to do further work in sustainability and that’s how my research journey started.
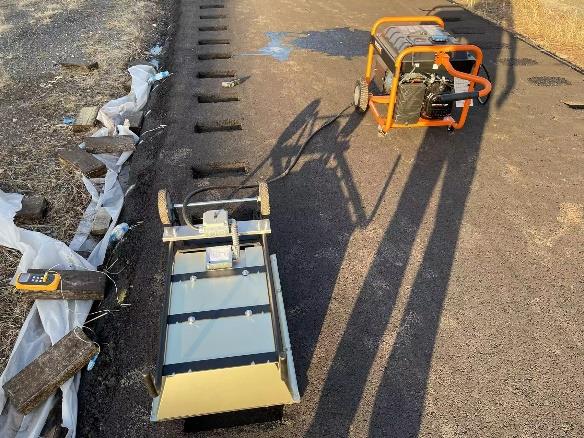
What drew me to Rowan University was the Center for Research and Education in Advanced Transportation Engineering Systems (CREATES), which deals with diverse research projects, and has a lot of facilities for conducting research on pavement materials. CREATES provides facilities where we can conduct our laboratory tests and evaluate the performance of various mixes. In the laboratory, we do everything in controlled conditions that may not exactly simulate field conditions but provide a good opportunity for a researcher to understand the behavior of a particular material and mix under different circumstances. CREATES also facilitates test sections and conducts Accelerated Pavement Testing (APT) using the Heavy Vehicle Simulator (HVS) to evaluate the field performance of the asphalt mixtures.
Q. What sparked your interest in sustainability related to pavement materials and rehabilitation?
A. I come from an industry background. After my master’s, I worked in construction for Larsen & Toubro and later as a highway designer for Jacobs. I worked on the geometric design of Texas Department of Transportation (TxDOT) projects. Based on my experience, I found that, especially in developed countries, roads have mostly been constructed. The future is in widening, rehabilitation, and maintenance of the existing roads. Additionally, we see that transportation is the largest global contributor to carbon emissions. These factors convinced me to focus on researching environmentally friendly and cost-effective pavement materials for sustainable development.
Q. The research in your poster focused on Full Depth Reclamation (FDR) and Cold In-Place Recycling (CIR). Can you describe some of the environmental or economic benefits that these processes provide?
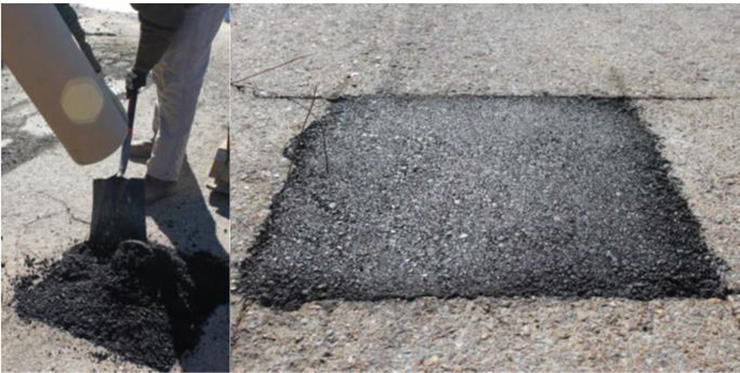
A. This project was funded by NJDOT Pavement Support Program (PSP) and led by Dr. Ahmed Saidi from CREATES, Rowan University. Cold In Place Recycling and Full Depth Reclamation are two rehabilitation techniques of deteriorated asphalt pavements. In the conventional process, whenever the pavement is highly distressed, we completely remove the materials and lay a new pavement stretch in that particular location. This process utilizes a Hot Mix Asphalt (HMA) mixture that requires asphalt, high mixing temperatures and large amounts of energy consumption, producing emissions. Production of HMA also involves a lot of volatile organic compounds, which can significantly impact the environment.
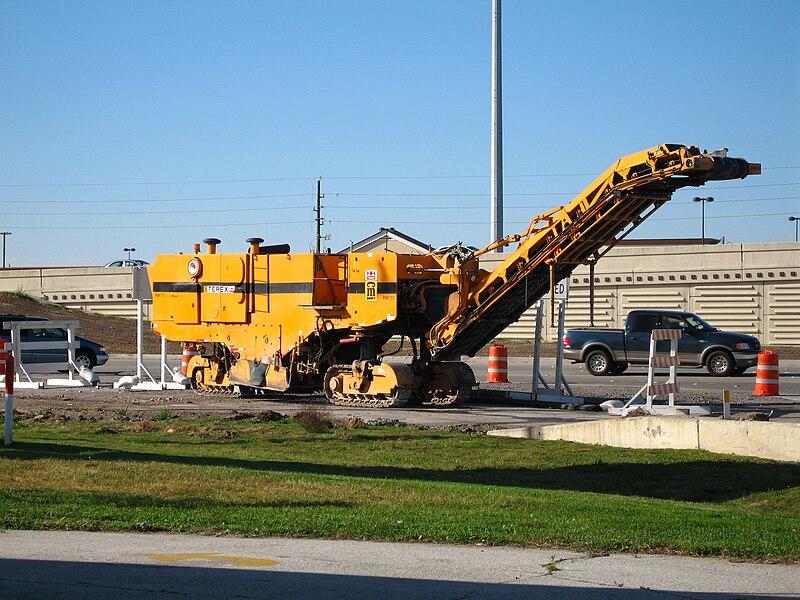
By replacing the process with a FDR or CIR, we can conserve the materials and reduce emissions. In FDR, the existing pavement is milled up to the unbound soil layers (at a depth up to 14 inches) and then laid into a single layer through pulverization and stabilization with additives. CIR involves reclamation of asphalt layer (at a depth up to 4 inches) and stabilization with additives. In this scenario, we see very little emissions, and it is also very quick. In our few trial stretches, which included some NJDOT projects, we observed that we could save $10,000 to $50,000 per mile. This is a huge achievement in cost savings and time savings, and is environmentally friendly. These are the benefits we get from implementing FDR and CIR.
Q. For the first two tasks in the research project, you conducted a literature review and a survey of different state DOTs. What did you find through these two tasks, and how did it prepare you for the lab tests?
A. We went through the various guidelines of different state DOTs and other state agencies. From this literature review, we observed that early on, state guidelines mentioned only the usage of cement for the FDR. But some states like Pennsylvania and Illinois started implementing the use of bituminous stabilizers to improve the performance of FDR. Through the state DOT literature review and the survey questionnaire, we learned more about the properties of emulsions and cement, the properties of RAP gradation, the types of cement that we have to select, and also how to cure and compact samples. We learned all these aspects of FDR and CIR from the literature review and the survey questionnaires, and then we tried to incorporate all these elements.
Q. You concluded with the research that 5 percent cement, or 3 percent emulsion, 1 percent cement and 3 percent water worked best for FDR, and 2 percent emulsion, or 1.5 percent foamed bitumen for CIR. How many different combinations did you try and how significantly did these combinations outperform the alternatives?
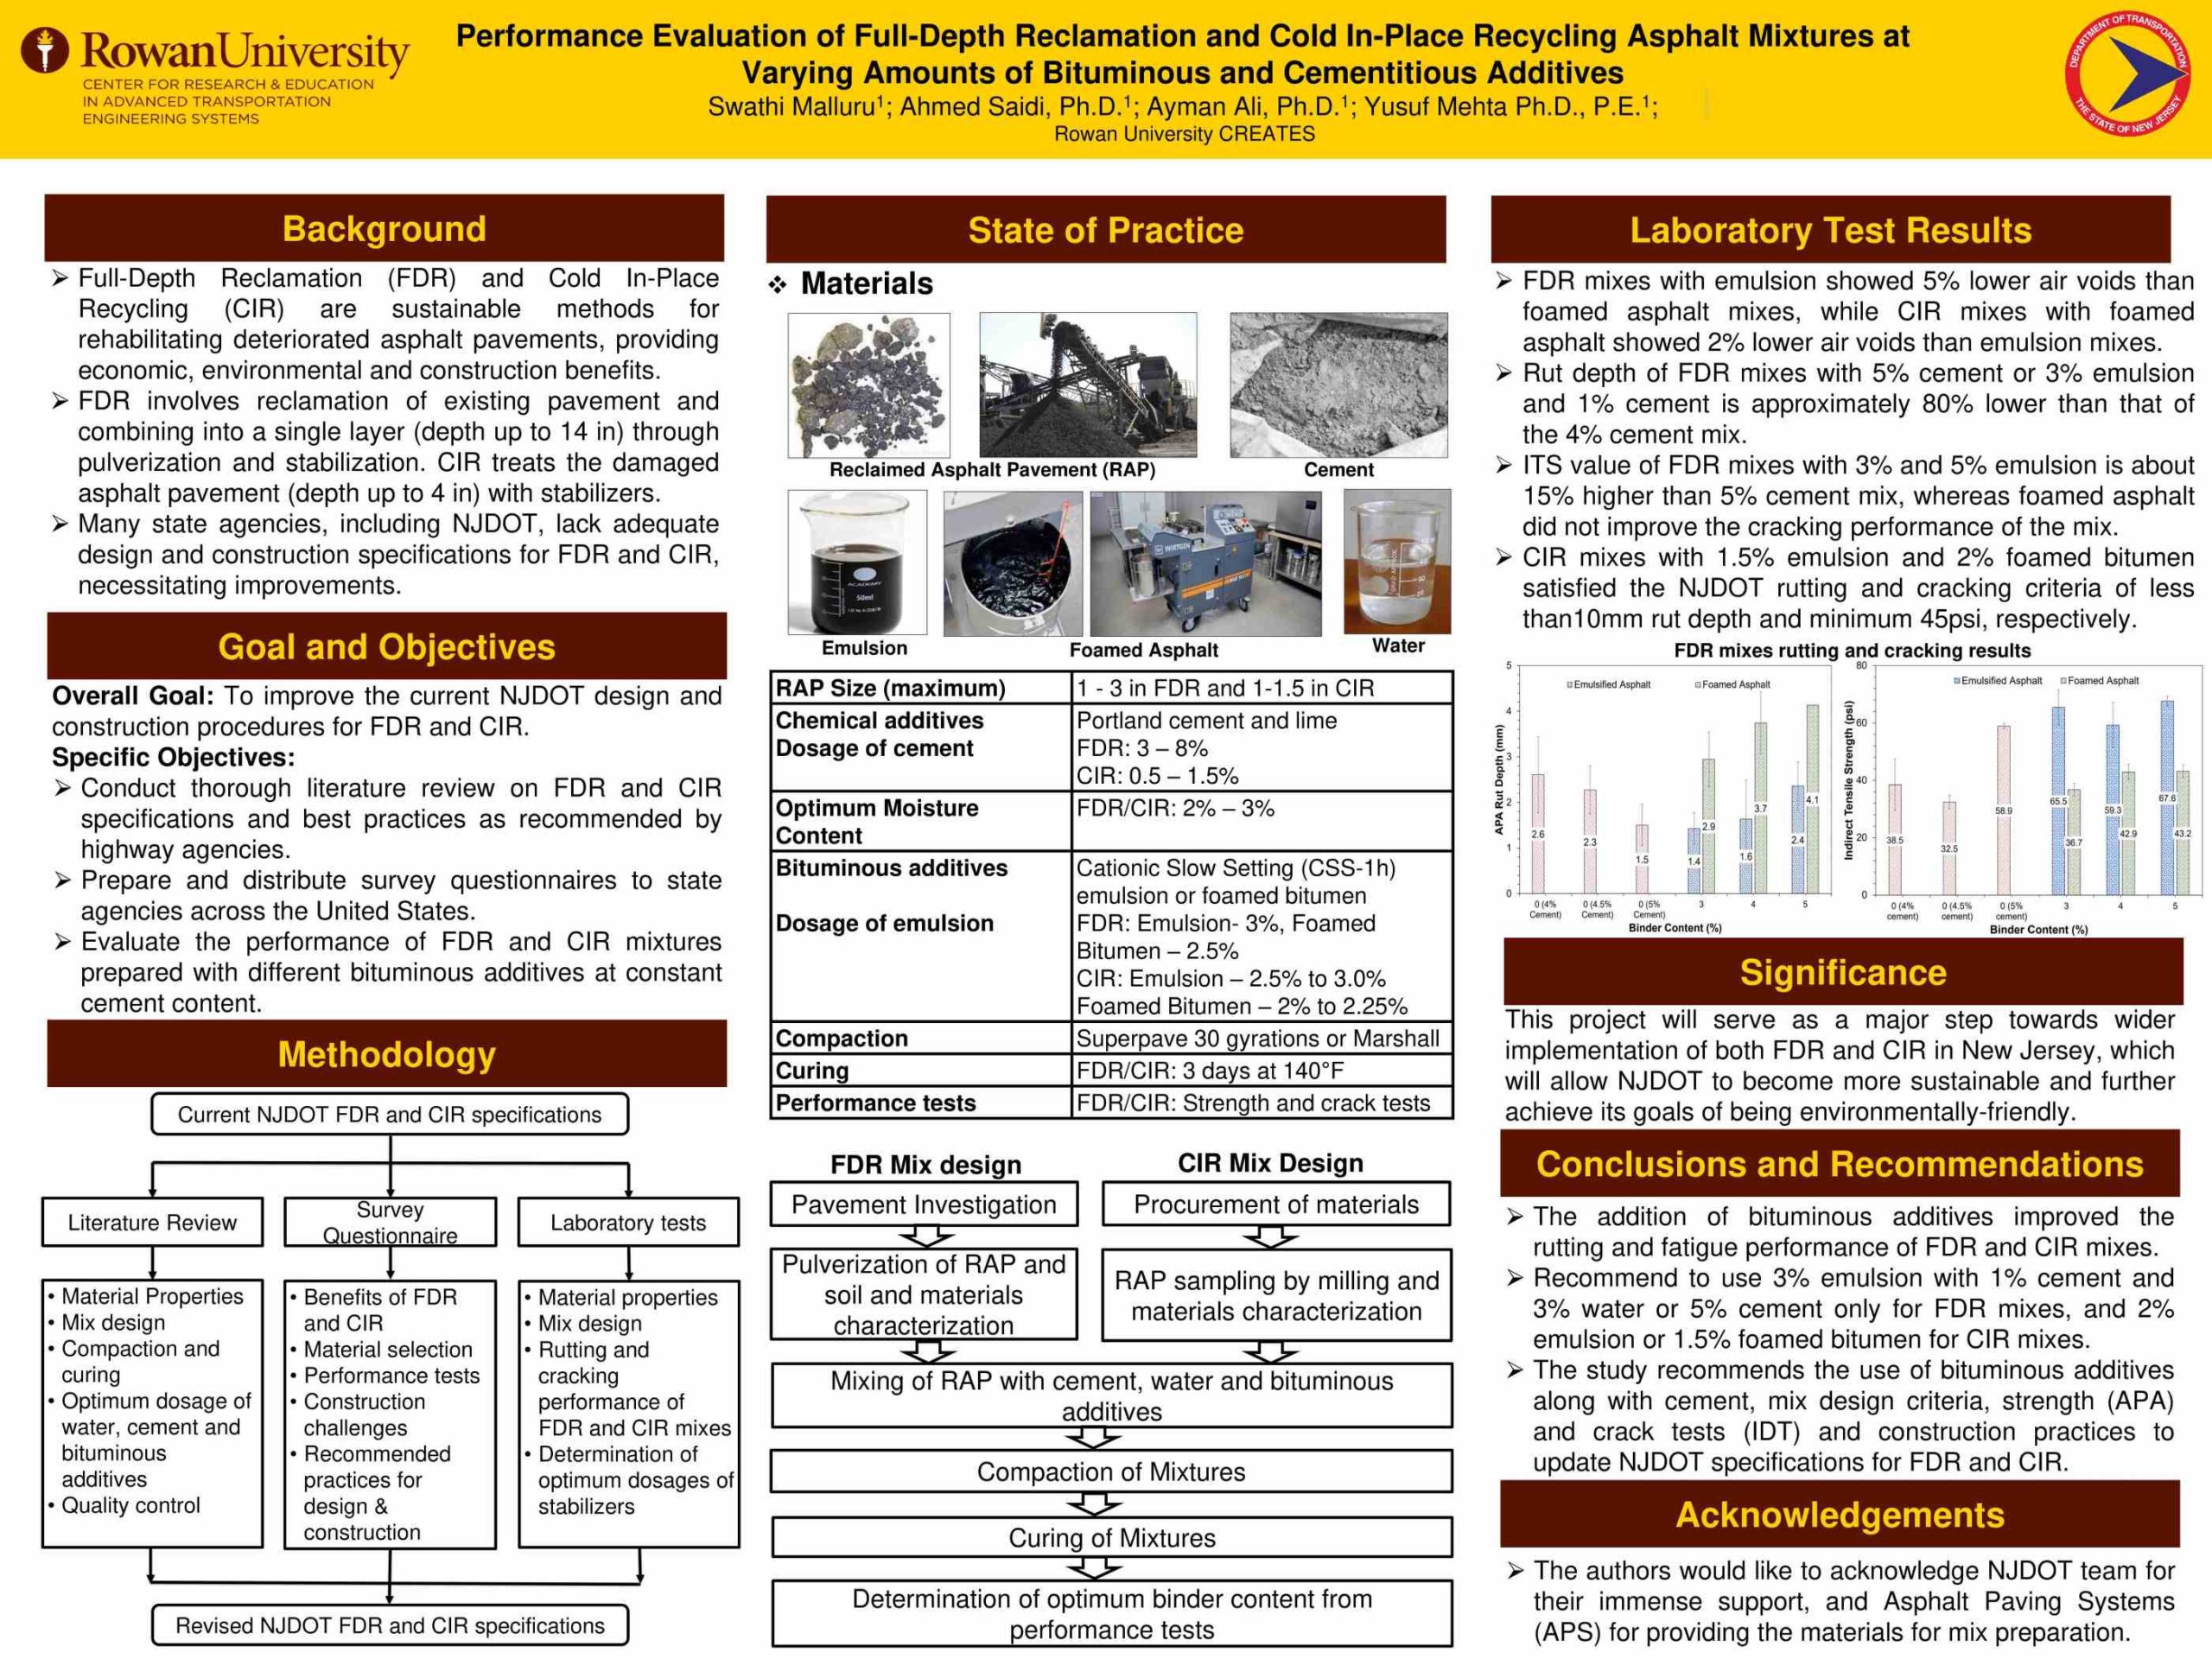
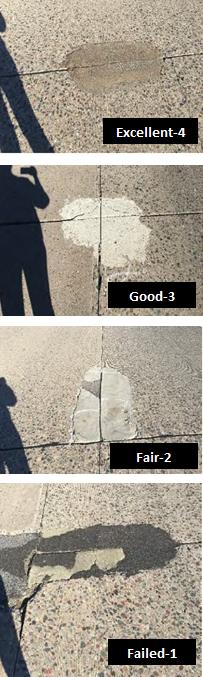
A. Based on the performance criteria from the literature review, we tried to understand what the optimum dosage should be. We considered three different stabilizer material types for FDR: a section with only cement varying from 4 to 5 percent with a 0.5 increment; a mix consisting of emulsion varying from 3 to 5 percent; and foamed bitumen varying from 3 to 5 percent. We decided to utilize these dosages based on the literature review. From the laboratory test, we observed that the 3 percent emulsion gave less rut depth and better fatigue performance compared to alternatives. Similarly, when we added 5 percent cement or 3 percent emulsion, we found it gave an equal performance.
Q. Did you experience any challenges during the lab tests?
A. Based on what we learned in the literature review, we were able to match the results and confirm it. Emulsions, and the inclusion of bituminous additives, can improve the performance of these mixtures. The challenges were during the mixing and compaction, but we managed to rectify those challenges over time.
Q. What additional research do you think should be conducted based on your findings from this project?
A. We have to conduct further work on the impact and performance of FDR and CIR and also evaluate any other alternatives that can be used as stabilizers. Currently, we are proposing FDR and CIR guidelines for minor roads, but maybe, if we try to improve and enhance its performance, we can extend it to the interstate highways and roads of higher priority. That is a major area for future research.
Q. What kind of impact do you hope this research will have on NJDOT construction and design policy moving forward?
A. I hope it helps NJDOT optimize cost savings, reduce labor, and construction time and, especially, aid in NJDOT becoming more environmentally friendly. This will help reduce emissions compared to using the conventional overlay method and help NJDOT achieve its sustainability goals.
Q. Moving toward your personal research, is there any kind of research that you specifically want to focus on going forward, or would it be something similar to this as you progress through your doctoral path?
A. After this, I want to try to conduct a test trial to evaluate the performance of FDR and conduct a life cycle assessment. And try to test the impact of low temperatures on the performance of FDR. Will there be a low temperature cracking effect from freezing? I would also like to work on developing design guidelines for the implementation of FDR and CIR throughout NJDOT.
Q. What are your career goals and aspirations for after you complete your PhD?
A. After my PhD, I would like to work in the industry, so I can implement my research and work to find solutions for major problems.