The New Jersey Department of Transportation Bureau of Research convened a Lunchtime Tech Talk! Webinar on Automating the Traffic Signal Performance Measures for NJDOT Adaptive Traffic Signal Control Systems on June 29, 2021. The presentation was led by Dr. Peter Jin, of Rutgers-CAIT, Dr. Thomas Brennan, from the College of New Jersey, and Kelly McVeigh from NJDOT’s Mobility Engineering Unit. The three touched upon Phase I research on Real-Time Traffic Signal Performance Measurement and continuing research underway in Phase II to adapt NJDOT’s existing signaling technology to take advantage of innovative methods in optimizing traffic controls.
Kelly McVeigh, of NJDOT, began the event by introducing the Automated Traffic Signal Performance Measures (ATSPM) and Adaptive Traffic Signal Control Systems (ATSC) concepts. According to McVeigh, Automated Traffic Signal Performance Measures are a suite of measures that help transit agencies to make use of data in optimizing signal timings. ATSPM consists of a dataset of time-stamped events-visually represented through charts-that demonstrate the signal’s performance. For example, how much time the signal is set to green when vehicles are present. The technology, McVeigh said, was “a powerful tool in the toolbox for traffic engineers to monitor performance and even make changes, if agency procedures allow.” ATSPM was first introduced by FHWA as part of the fourth round of the Every Day Counts Initiative (EDC-4).
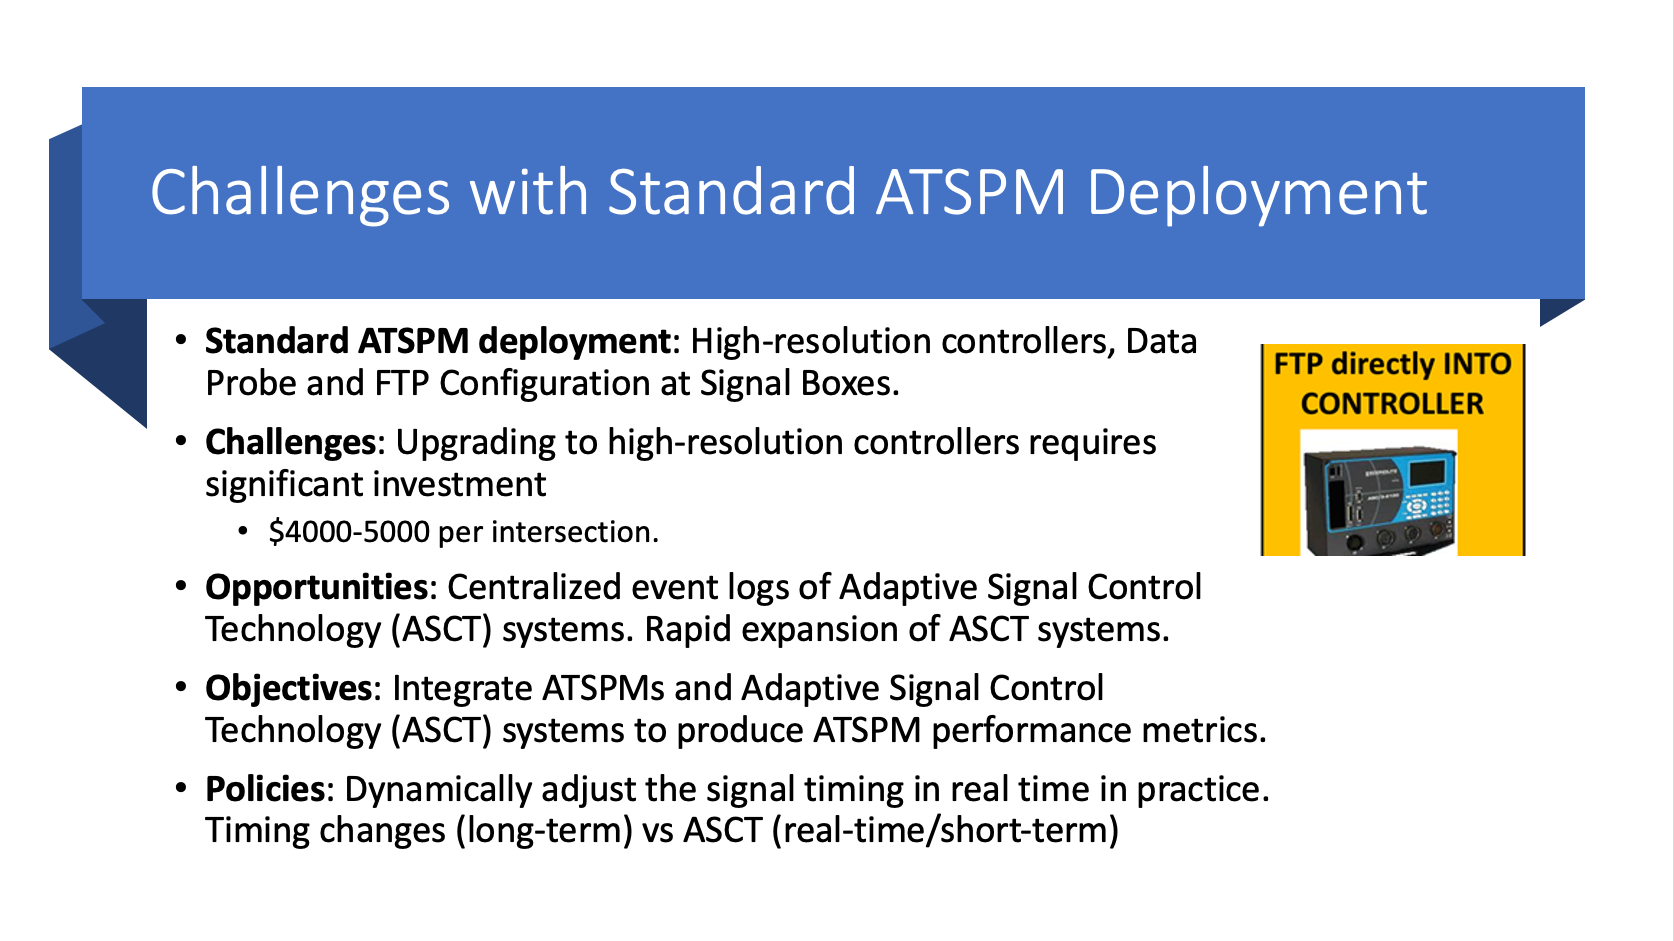
McVeigh explained that, while there is already a well-documented system in place to support ASTPM implementation, NJDOT is focusing on adapting existing systems that are already equipped to capture data. Adaptive Traffic Control Systems (ATSC) are installed in nearly 20 percent of NJDOT’s roughly 2,500 signals statewide, and collect data on both traffic controllers and detectors, such as signal performance and vehicle queuing. However, as Dr. Jin then detailed, ATSC data is presently incompatible with ATSPM. In addition, some signals are connected to the centralized network, while others remain isolated. The solution was to develop a means of converting the data, rather than installing new infrastructure.
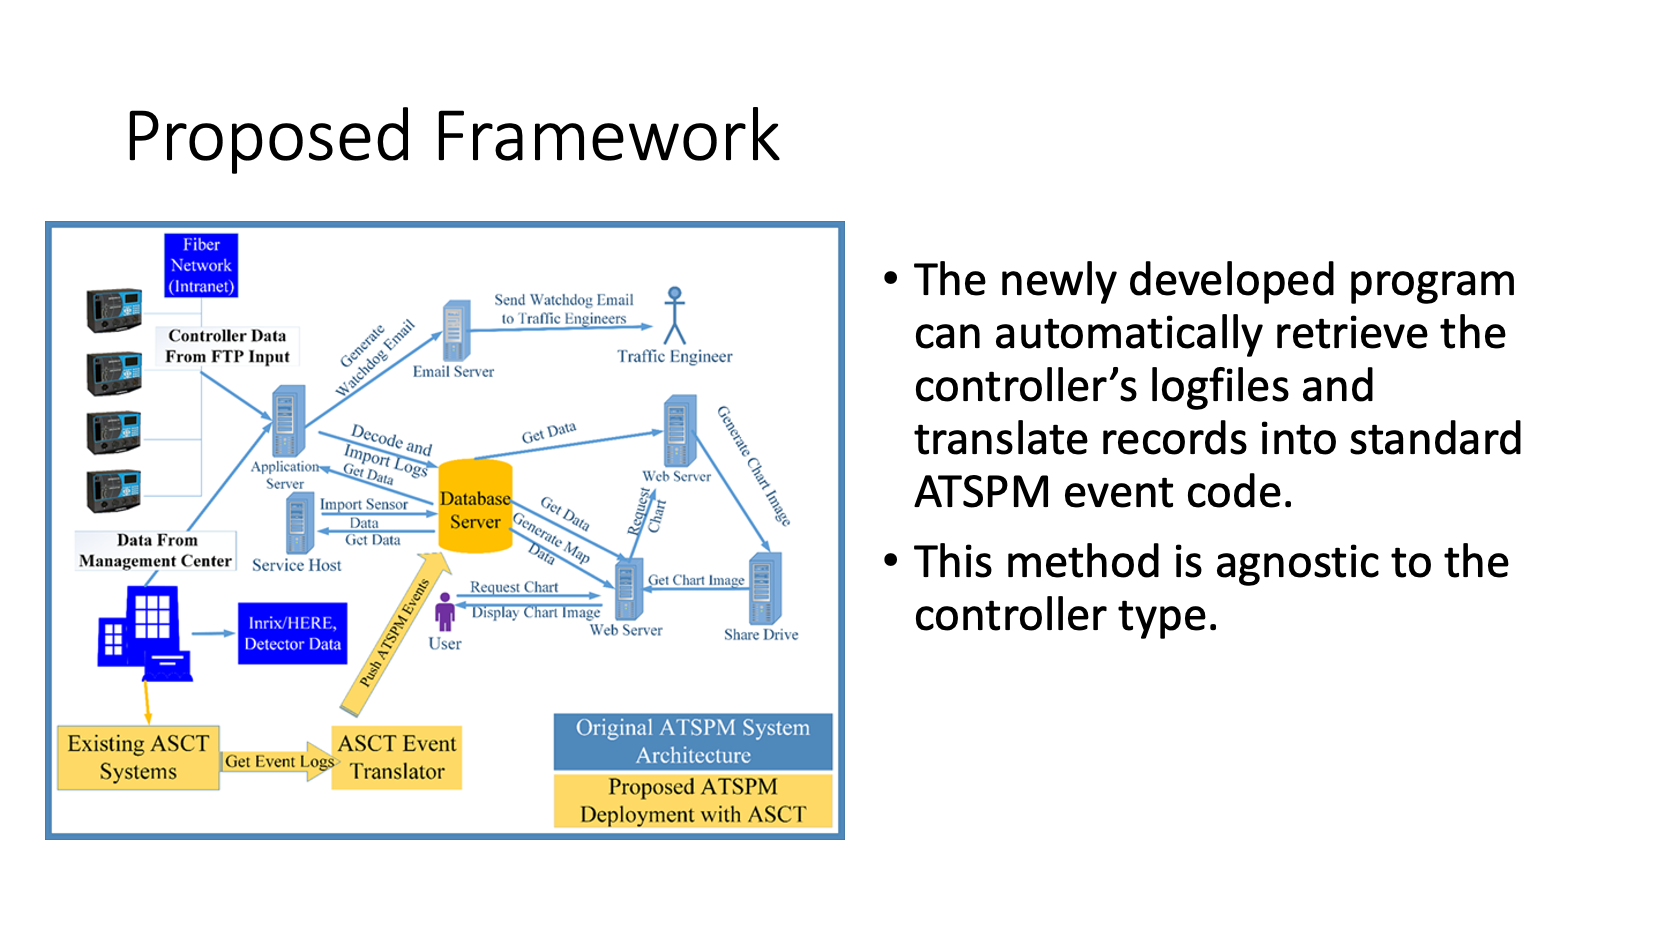
A team of students from Rutgers, The College of New Jersey, and Rowan University worked with Dr. Jin to bridge data from ATSC to ASTPM. The proposed solution is a program that automatically retrieves traffic controller event logs and then translates them into ASTPM event code, a method that is agnostic to controller type. This allows for a wide variety of data to be collected, and then viewed and optimized using standard ASTPM methods.
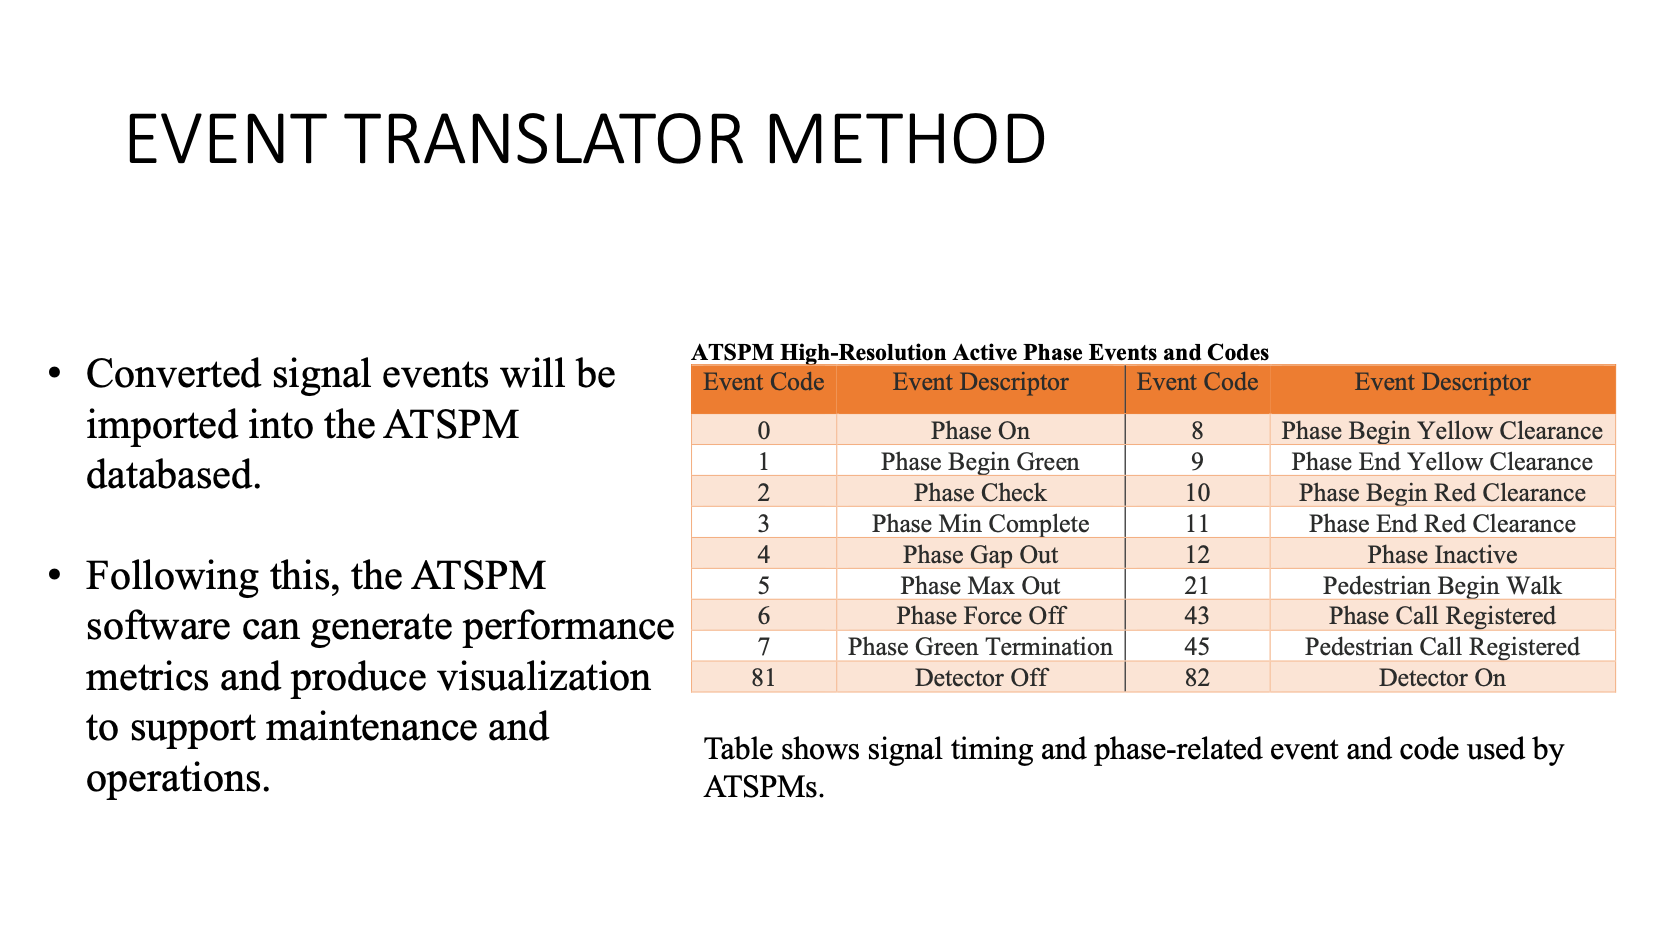
Data translation works by taking ATSC logs, such as “Phase Begin Green” stamped with a timecode, and converting that to a numeric code, in this case, “1.” A computer program reads through the SCATS log and assigns certain datapoints to traffic events, such as a gap, which would be coded as “4.” At the conclusion of Phase 1, the team has been able to convert all major events to ASTPM metrics. Going forward, they are working on using geolocated video data to reconstruct stopping data, allowing for more refined information that enables real-time traffic signal adjustments.
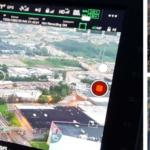
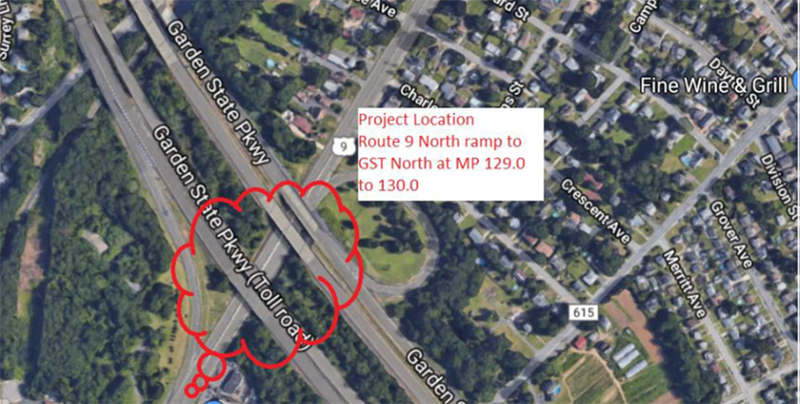
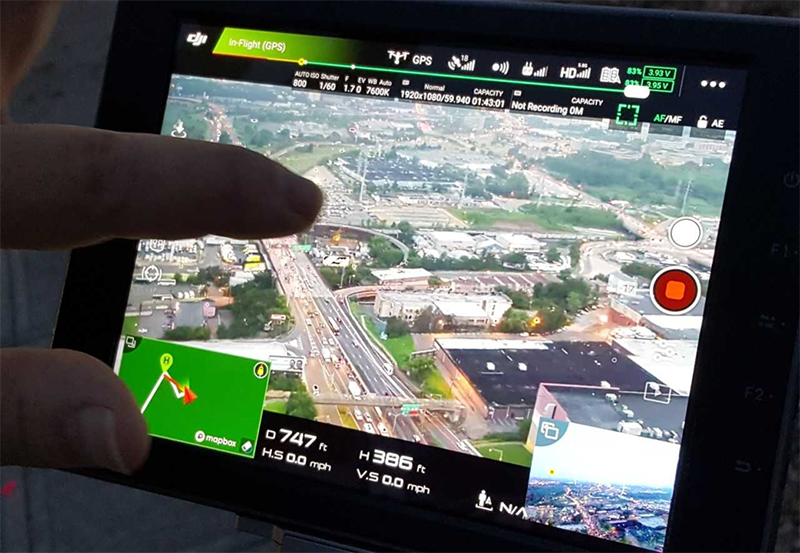
Many locations on NJDOT’s network are not properly equipped to convey upstream information on vehicles, particularly during the red phase. The ingenious solution is to locate a “Stop-Bar” within the signal detector that registers when vehicles have begun queuing. This data is then correlated with spatial Google Maps data that precisely locates the vehicles’ position. Information from the Autoscope video-based tracking technology is then used to calculate the vehicle’s trajectory, using the Shockwave Theory of traffic flow. The benefit of such a method is better data on how vehicles approach a red signal, which can then be optimized through ASTPM.
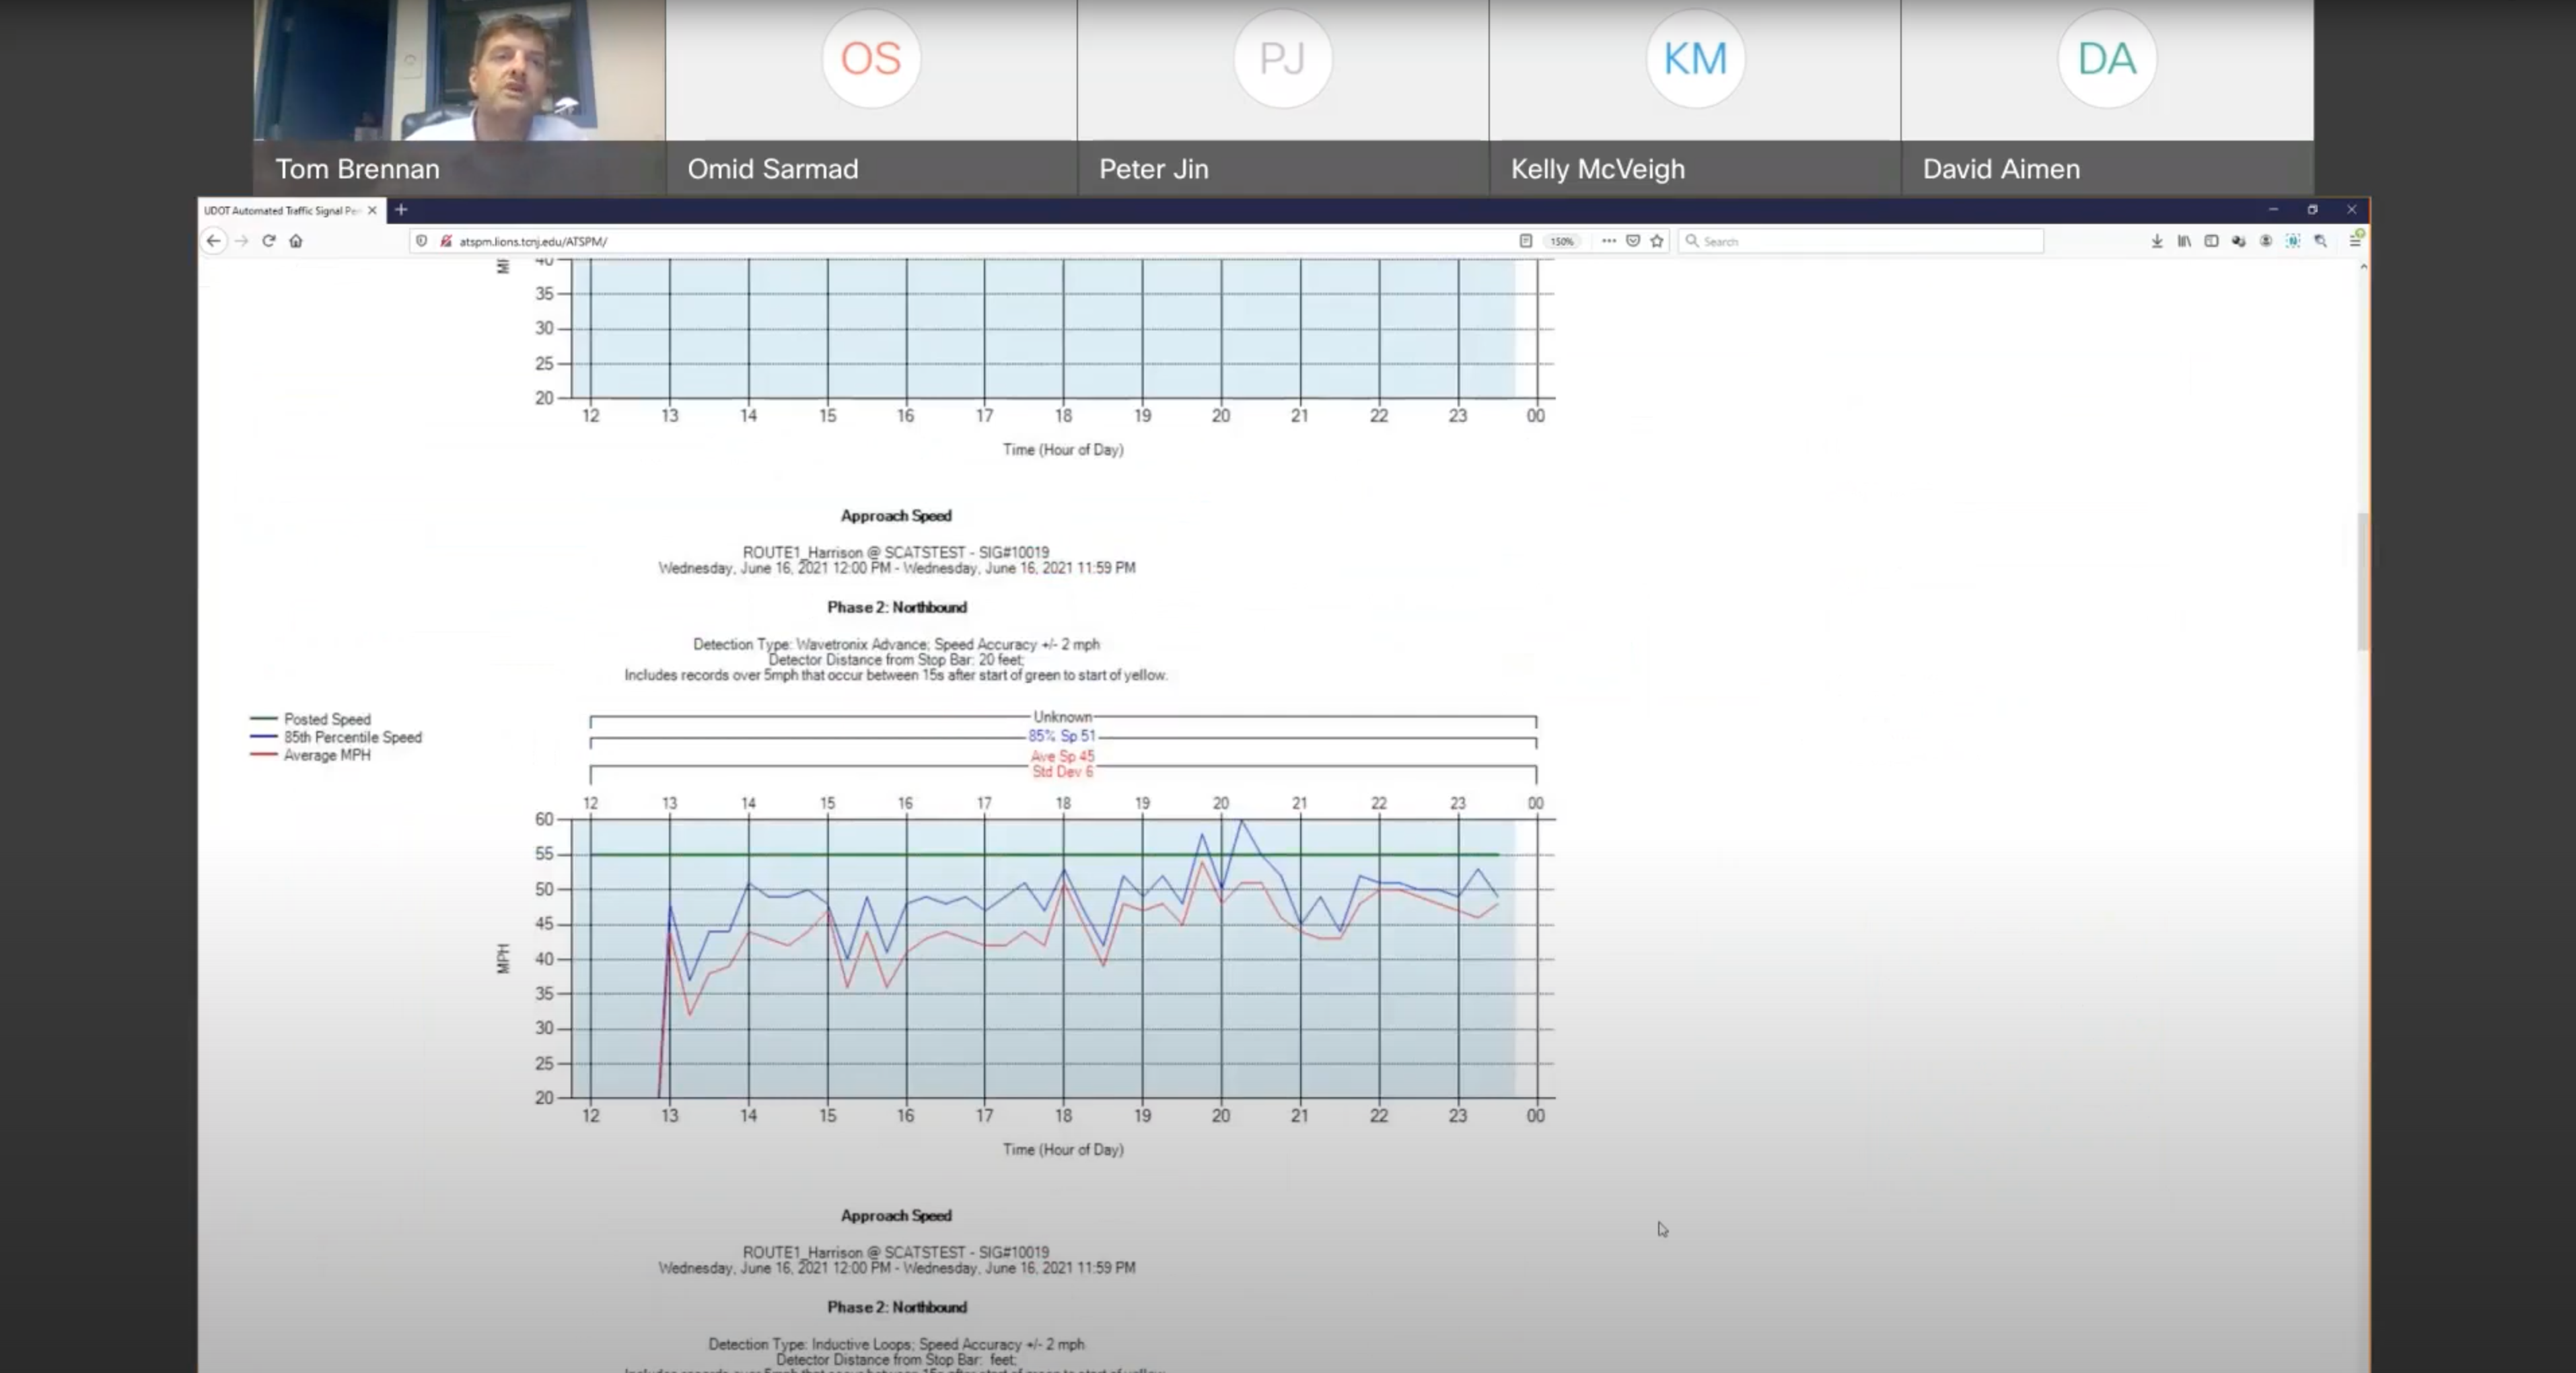
Dr. Brennan then demonstrated the technology in action, sharing his screen to show the ATSPM Server and its variety of tools. He selected a sample intersection, US-1 and Harrison Street near the Millstone River, and brought up a chart showing the Purdue Phase Diagram (PCD). The PCD is a means of graphically representing the number of vehicles passing through an intersection with respect to phase time. In an ideal situation, vehicles should arrive on green, instead of red, when they will have to wait. Another chart represented the traffic split by time of day and duration of the phase. When the technology is fully implemented, such data should be uploaded every 15 minutes, allowing for near real-time monitoring.
From the ATSPM data, Dr. Brennan showed that one signal had an 82 percent Arrive on Green (AoG) score. Metrics such as this could be used for the development of data-driven policy. The dashboard charts also showed vehicle density for when the signal was about to turn red-the timing of which could be adjusted to lighten the number of vehicles queuing.
It was clear that the conversion of ATSC data to ATSPM dramatically expanded the potential of every intersection in which it is equipped. The dashboard could be used to model changes in traffic flow, such as if a road diet were implemented, or if traffic from a major highway was diverted through the intersection. Safety benefits include data on red light violations that can be tabulated and used as justification for future improvements. One day data from connected vehicles could be integrated, too.
At the end of the presentation, Dr. Jin summarized their work: the team had innovated in converting raw data to ASTPM protocols that could then be used to boost signal performance and traffic flow optimization. This translation method avoids the intensive infrastructure cost of upgrading signals to ASTPM standards, saving money. An in-development model using Stop-Bar data will soon allow for real-time signal adjustment, letting traffic engineers tweak signal timings for optimal flow. At NJDOT, they are in the final stage of deploying this technology permanently on an agency server for future widespread use.
At the end of the event, several attendees asked questions through the platform’s chat feature.
Q. Inrix data does not provide individual probe data, how is it accounted for in the results?
Dr. Brennan: We’re not able to get individual vehicles, but it aggregates vehicle speed within one-minute increments. This then feeds that into ASTPM as if it were a single detector. Everything is within a confidence interval of 85 percent. The beauty of this software is that as long as you convert your information into the right format, you can put it in there.
Q. How do you control and change the cycle length tool?
Mr. McVeigh: Part of the adaptive system algorithm is to update cycle lengths in real time, based on the data being received. We can also provide guidance to the system on thresholds, on minimum and maximum lengths for cycles throughout the day. This is all for adaptive systems-coordinated systems use modeling to update their lengths. The tool used primarily at NJDOT is Synchro.
Q. How did the COVID-19 pandemic affect the data collection on Route 1?
Dr. Brennan: Because the researchers were working to calibrate a tool, the volume of traffic on the roadway did not affect their work.
Q. What are the biggest obstacles that you are facing in advancing this innovation around the state?
Mr. McVeigh: The first obstacle is ensuring that various datasets can be interfaced properly, because the ATSC system is providing data that is not necessarily compatible with ASTPM functions.
Dr. Brennan: There are also issues with code syntax, such as when SCATS is updated and logs data differently. Thanks to the graphical nature of the project, it is easy to see when this is happening.
Q. Did you face any issues in reconciling the Google Maps data with the CCTV data?
Dr. Jin: I think it was more with the video conversion. Google Maps provided good distance information that was then converted to become compatible with the video data. The critical step was coordinating these pixel coordinates to actual coordinates.
Q. What percentage of the adaptive signals are implemented on state highways?
Mr. McVeigh: Right now we have 118 adaptive signals in operation. Out of almost 2,600 signals in the state, a little under 20 percent of signals in the state are equipped with this technology.
Q. With multiple data sets fed into the system, how does it filter to avoid repetitions or duplicates?
Dr. Jin: We do have to filter the data that is fed in, and also have developed the logic that shows which line confirms the event occurred, and which line shows the starting point of the event. This is part of the translator work. In terms of different data sources, we were able to coordinate pretty well.
Q. Do you have any suggestions based on your research to help county and local governments advance the implementation of ASTPMs?
Mr. McVeigh: It’s a very powerful tool, make sure you have the practice to enable it to be used properly. From a technical standpoint it’s relatively straightforward, but the big thing is knowing how you want to use it-could be really effectively used as an empirical optimization tool. It all depends on the agency’s ability to do that.
Dr Jin: It is important to start knowing what is currently available, whether there is new construction or existing controllers, to see whether can deploy original ASTPM or these adaptive measures.
Dr. Brennan: It’s important to have strong IT support for these conversion activities. It’s not impossible, but necessary to have the support in place.
A recording of the webinar is available here, (or see right).
Resources
Federal Highway Administration. Automated Traffic Signal Performance Measures. https://ops.fhwa.dot.gov/arterial_mgmt/performance_measures.html
NJDOT Tech Transfer. (2018, December). What is an Automated Traffic Signal Performance Measure (ATSPM)? https://www.njdottechtransfer.net/automated-traffic-signal-performance-measures/
NJDOT Tech Transfer. (2020, June 12). Development of Real-Time Traffic Signal Performance Measurement System. https://www.njdottechtransfer.net/2020/06/12/development-of-rttspms/