

Interview with 2024 Research Showcase “Outstanding University Student in Transportation Research Award” Winner
Traffic safety and mobility, two critical areas in transportation engineering, both require the collection and analysis of large data sets to produce proactive and comprehensive solutions. Transportation engineers have started to increasingly focus on using innovative...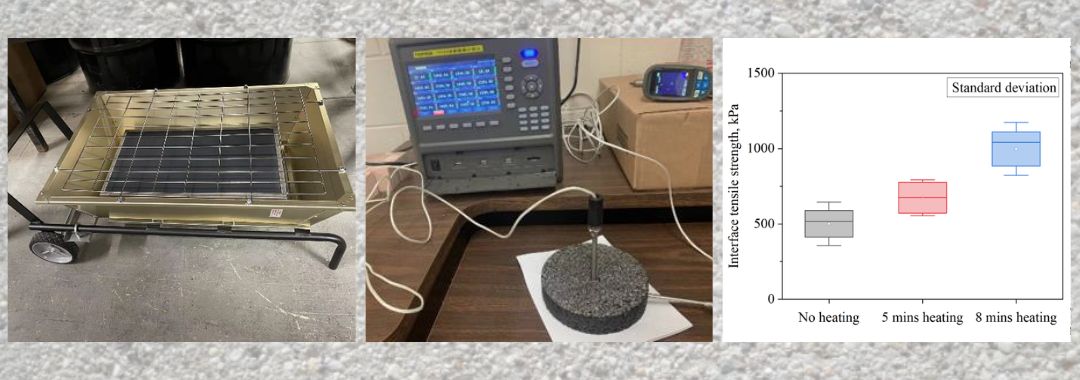
Research Spotlight: Innovative Pothole Repair Materials and Techniques
A recently completed NJDOT research study, Innovative Pothole Repair Materials and Techniques, tested several new techniques and materials that could improve the cost-effectiveness of pothole repairs in New Jersey. Phase I of the research project, led by Professors...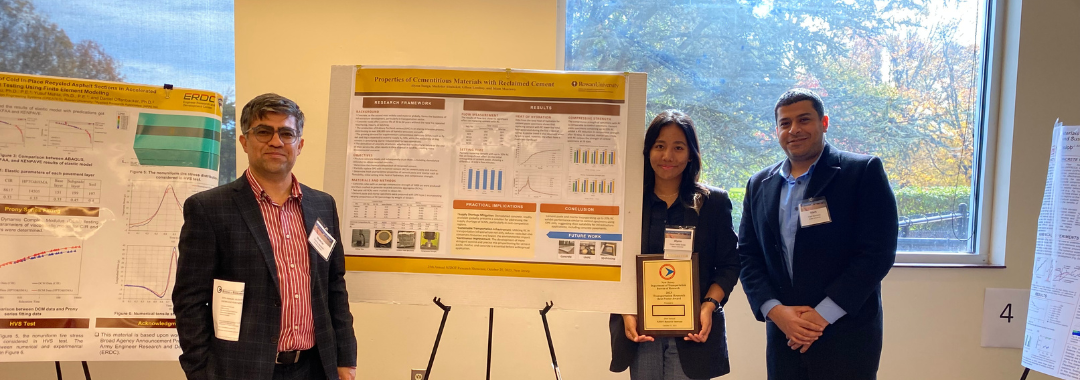
Interview with “Best Poster Award” Winner at 2023 Research Showcase: “Properties of Cementitious Materials with Reclaimed Cement”
Concrete production is energy intensive, and requires materials that are both challenging, and expensive to acquire. Material engineers are seeking alternative materials that are more cost-effective and carbon-friendly, but also operate successfully as road and...
Testing Biometric Sensors for Use in Micromobility Safety
Biometric sensors have long been used in cognitive psychology to measure the stress-level of individuals. These sensors can measure a variety of human behaviors that translate as stress: the movement of eyes, stress-induced sweat, and heart rate variability. Recently,...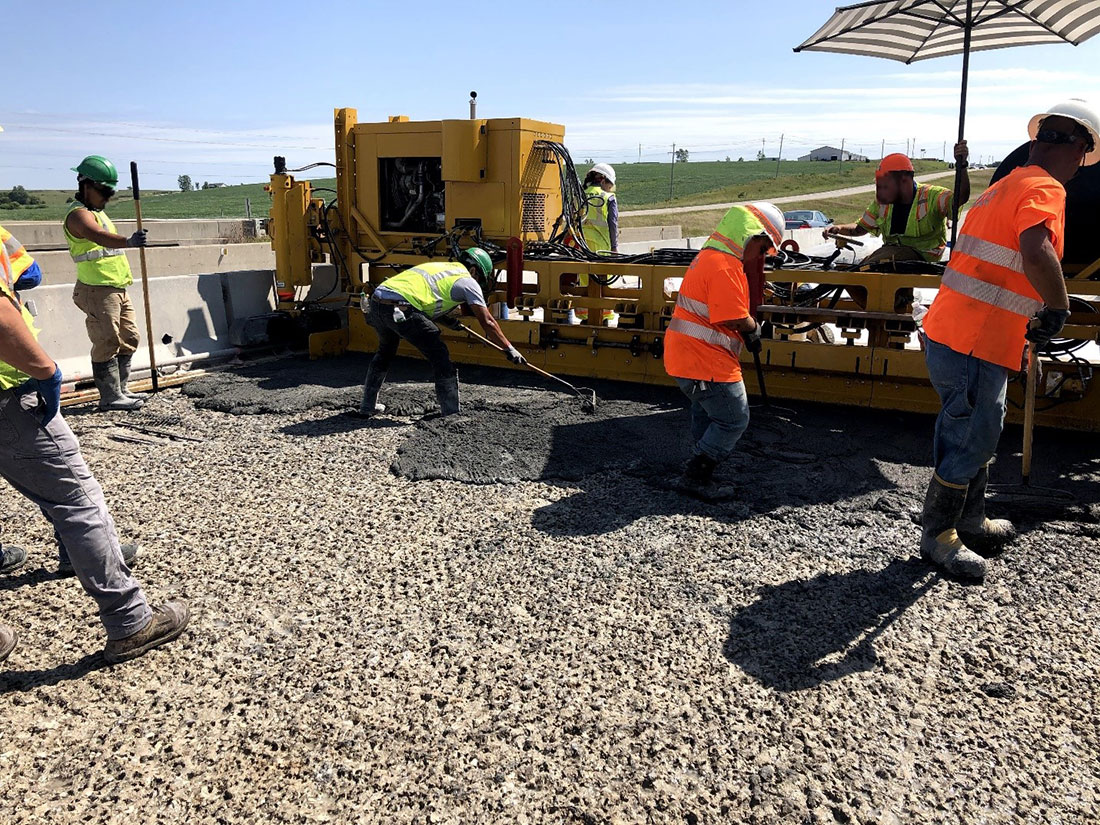
Ultra High-Performance Concrete (UHPC) Applications in New Jersey – An Update
UHPC for Bridge Preservation and Repair is a model innovation that was featured in FHWA’s Every Day Counts Program (EDC-6). UHPC is recognized as an innovative new material that can be used to extend the life of bridges. Its enhanced strength reduces the need for...
 |