The following is a list of research published by the Transportation Research Board (TRB) between September 1, 2021 and October 31, 2021. Current articles from the TRB may be accessed here.
Early, effective, and continuous public involvement brings diverse viewpoints and values into the decision-making process. Transportation agencies can increase meaningful public involvement in planning and project development by integrating virtual tools into their overall public involvement approach. Public involvement tools and practices have expanded and shifted dramatically over the past decade due to changes in communications, technology, and lifestyles. Transportation professionals cannot expect the public to come to the transportation agency's events; practitioners must reach them in their everyday lives–online, at home, and in chosen gathering spaces.
FHWA published a series of mini VPI documentaries in 2023 to explore transportation agencies' varied use of VPI tools and strategies:
The Evolution of VPI: MPO Perspectives. Strafford Regional Planning Commission and Miami-Dade Transportation Planning Organizations discuss the changed approaches of VPI from the lens of MPOs.
Engaging Traditionally Underserved Communities describes considerations and strategies for engaging traditionally underserved populations when using VPI tools; a discussion of public meetings and NEPA-required public hearings for underserved communities; and includes a questions and answer session.
CASE STUDIES. FHWA has developed video case studies that highlight how transportation agencies are using virtual public involvement tools and techniques. This video series features short conversations with professionals involved in virtual public involvement efforts at their respective agencies. Agencies and topics featured in the Case Studies video are listed below.
PEER EXCHANGE WORKSHOPS. FHWA has been hosting in-person and online peer exchange workshops to provide a forum for sharing VPI strategies and practices. These peer exchanges bring experienced and less-experienced peers together to present and discuss their approaches to using specific VPI strategies. Various topics have touched upon project visualizations, online meetings, engaging traditionally underserved populations, and crowdsourcing approaches. The FHWA typically provides workshop summary reports, recordings, and other resources for each event.
Computer vision is an emerging technology in which Artificial Intelligence (AI) reads and interprets images or videos, and then provides that data to decision makers. For the transportation field, computer vision has broad implications, streamlining many tasks that are currently performed by staff. By automating monitoring procedures, transportation agencies can gain access to improved, real-time incident data, as well as new metrics on traffic and “near-misses,” which contribute to making more informed safety decisions.
To learn more about the how computer vision technology is being applied in the transportation sector, three researchers working on related projects were interviewed: Dr. Chengjun Liu, working on Smart Traffic Video Analytics and Edge Computing at the New Jersey Institute of Technology; Dr. Mohammad Jalayer, developing an AI-based Surrogate Safety Measure for intersections at Rowan University, and Asim Zaman, PE, currently researching how computer vision can improve safety for railroads. All researchers expressed that this technology is imminent, effective, and will affect staffing needs and roles at transportation agencies.
A summary of these interviews is presented below.
Smart Traffic Video Analytics (STVA) and Edge Computing (EC) – Dr. Chengjun Liu, Professor, Department of Computer Science, New Jersey Institute of Technology
Dr. Chengjun Liu is a professor of computer science at the New Jersey Institute of Technology, where he leads the Face Recognition and Video Processing Lab. In 2016, NJDOT and the National Science Foundation (NSF) funded a three and-a-half year research project The project led to the development of several promising tools, including a Smart Traffic Video Analysis (STVA) system that automatically counts traffic volume, and detects crashes, traffic, slowdowns, wrong-way drivers, and pedestrians, and is able to classify different types of vehicles.
“There are a number of core technologies involved in these smart traffic analytics.” Dr. Liu said. “In particular, advanced video analytics. Here we also use edge computing because it can be deployed in the field. We also apply some deep learning methods to analyze the video.”
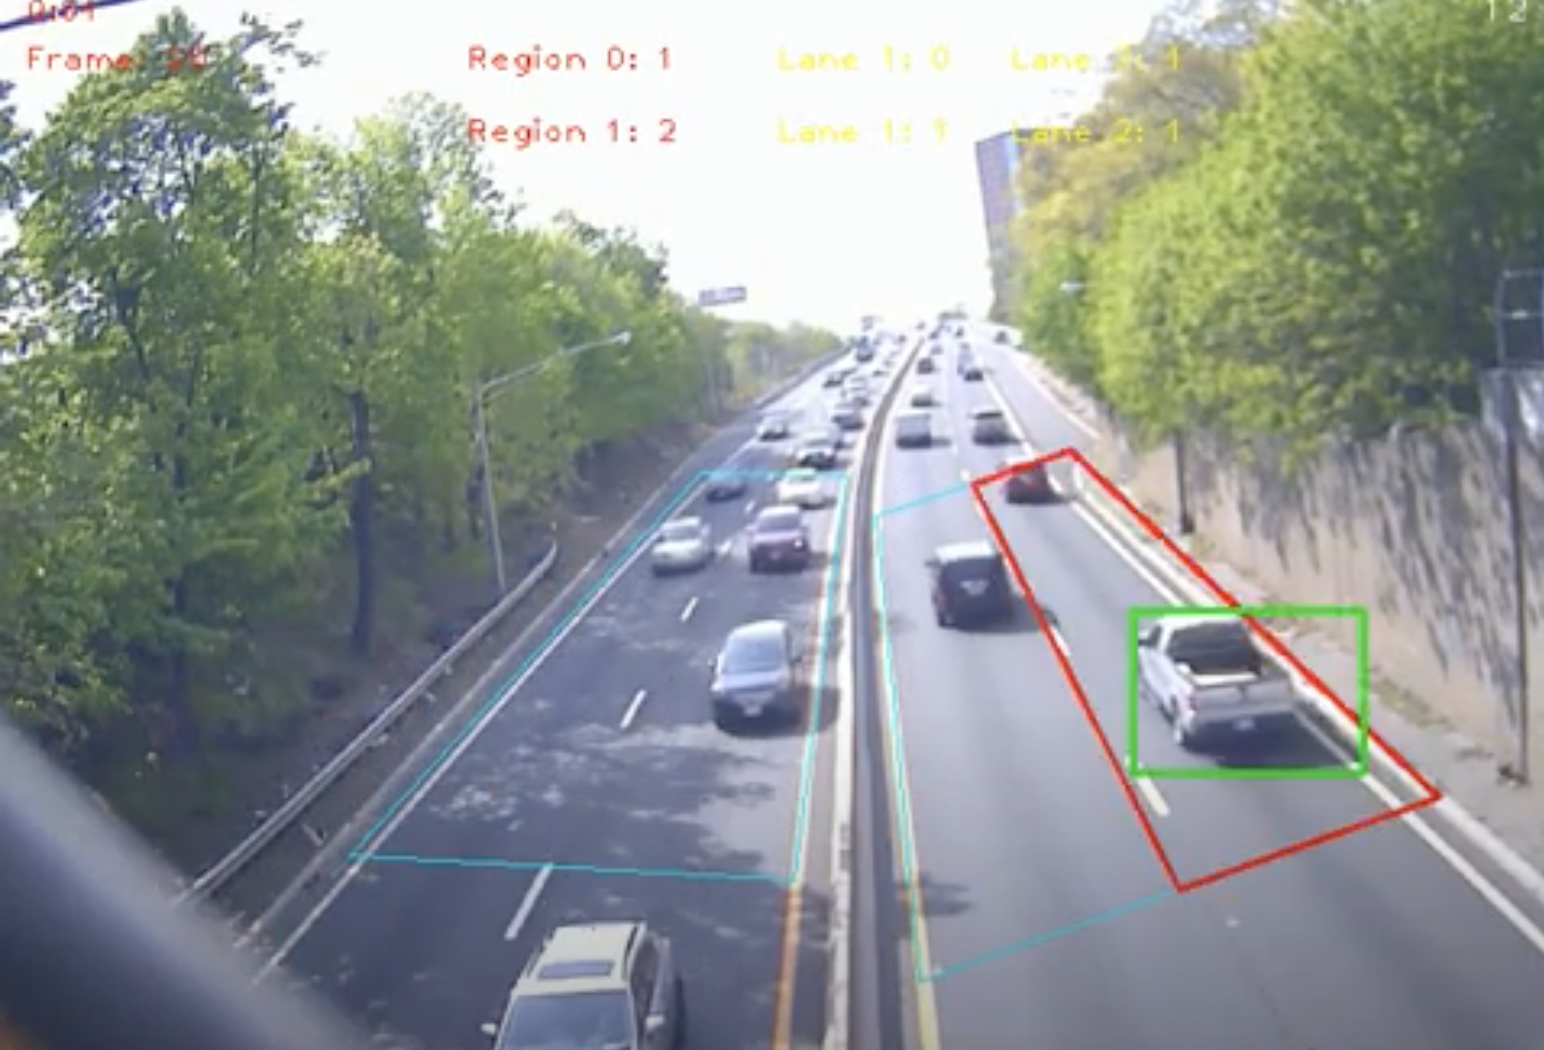
Figure 1. A video feed shows the AI identifying passing vehicles on I-280 in real-time. Courtesy of Innovative AI Technologies.
To test this technology, Dr. Liu’s team developed prototypes to monitor traffic in a real-world setting. The prototype consists of Video Analytics (VA) software, and Edge Computing (EC) components. EC is a computing strategy that seeks to reduce data transmission and response times by distributing computational units, often in the field. In this case, VA and EC systems, consisting of a wired camera with a small computer attached, were placed to overlook segments of both Martin Luther King Jr. Boulevard and I-280 in Newark. Footage shows the device detecting passing cars, counting and classifying vehicles as they enter a designated zone. Existing automated technologies for traffic counting had something in the realm of a 20 to 30 percent error rate, while Dr. Liu reported error rates between 2 and 5 percent.
Additional real-time roadway footage from NJDOT shows several instances of the device flagging aberrant vehicular behavior. On I-280, the system flags a black car stopped on the shoulder with a red box. On another stretch of highway, a car that has turned left on a one-way is identified and demarcated. The same technology, being used for traffic monitoring video in Korea, immediately locates and highlights a white car that careens into a barrier and flips. Similar examples are given for congestion and pedestrians.
“This can be used for accident detection, and traffic vehicle classification, where incidents are detected automatically and in real time. This can be used in various illumination conditions like nighttime, or weather conditions like snowing, raining, and so forth.” Dr. Liu said.
According to Dr. Liu, video monitoring at NJDOT is being outsourced, and it might take days, or even weeks, to review and receive data. Staff monitor operations via video monitors from NJDOT facilities, where, due to human capacity constraints, some incidents and abnormal driving behavior go unnoticed. Like many tools using computer vision, the STVA system can provide live metrics, allowing for more effective monitoring than is humanly possible and accelerating emergency responder dispatch times.
STVA, by automating some manned tasks, would change workplace needs in a transportation agency. Rather than requiring people to closely monitor traffic and then make decisions, use of this new technology would require staff capable of working with the software, troubleshooting its performance, and interpreting the data provided for safety, engineering, and planning decisions.
Dr. Liu was keen to see his technology in use, expressing how the private sector was already deploying it in a variety of contexts. In his view, it was imperative that STVA be implemented to improve traffic monitoring operations. “There is a potential of saving lives,” Dr. Liu said.
Safety Analysis Tool – Dr. Mohammad Jalayer, Associate Professor, Civil and Environmental Engineering, Rowan University
Dr. Mohammad Jalayer, an associate professor of civil and environmental engineering at Rowan University, has been researching the application of computer vision to improving safety at intersections. While Dr. Liu’s STVA technology might focus more heavily on real-time applications, Dr. Jalayer’s research looks to use AI-based video analytics to understand and quantify how traffic functions at certain intersections and, based on that analysis, provide data for safety changes.
Traditionally, Dr. Jalayer said, safety assessments are reactive, “meaning that we need to wait for crashes to happen. Usually, we analyze crashes for three years, or five years, and then figure out what’s going on.” Often, these crash records can be inaccurate, or incomplete. Instead, Dr. Jalayer and his team are looking to develop proactive approaches. “Rather than just waiting for a crash, we wanted to do an advanced analysis to make sure that we prevent the crashes.”
Because 40 percent of traffic incidents occur at intersections, many of them high-profile crashes, the researchers chose to focus on intersection safety. For this, they developed the Safety Analysis Tool.
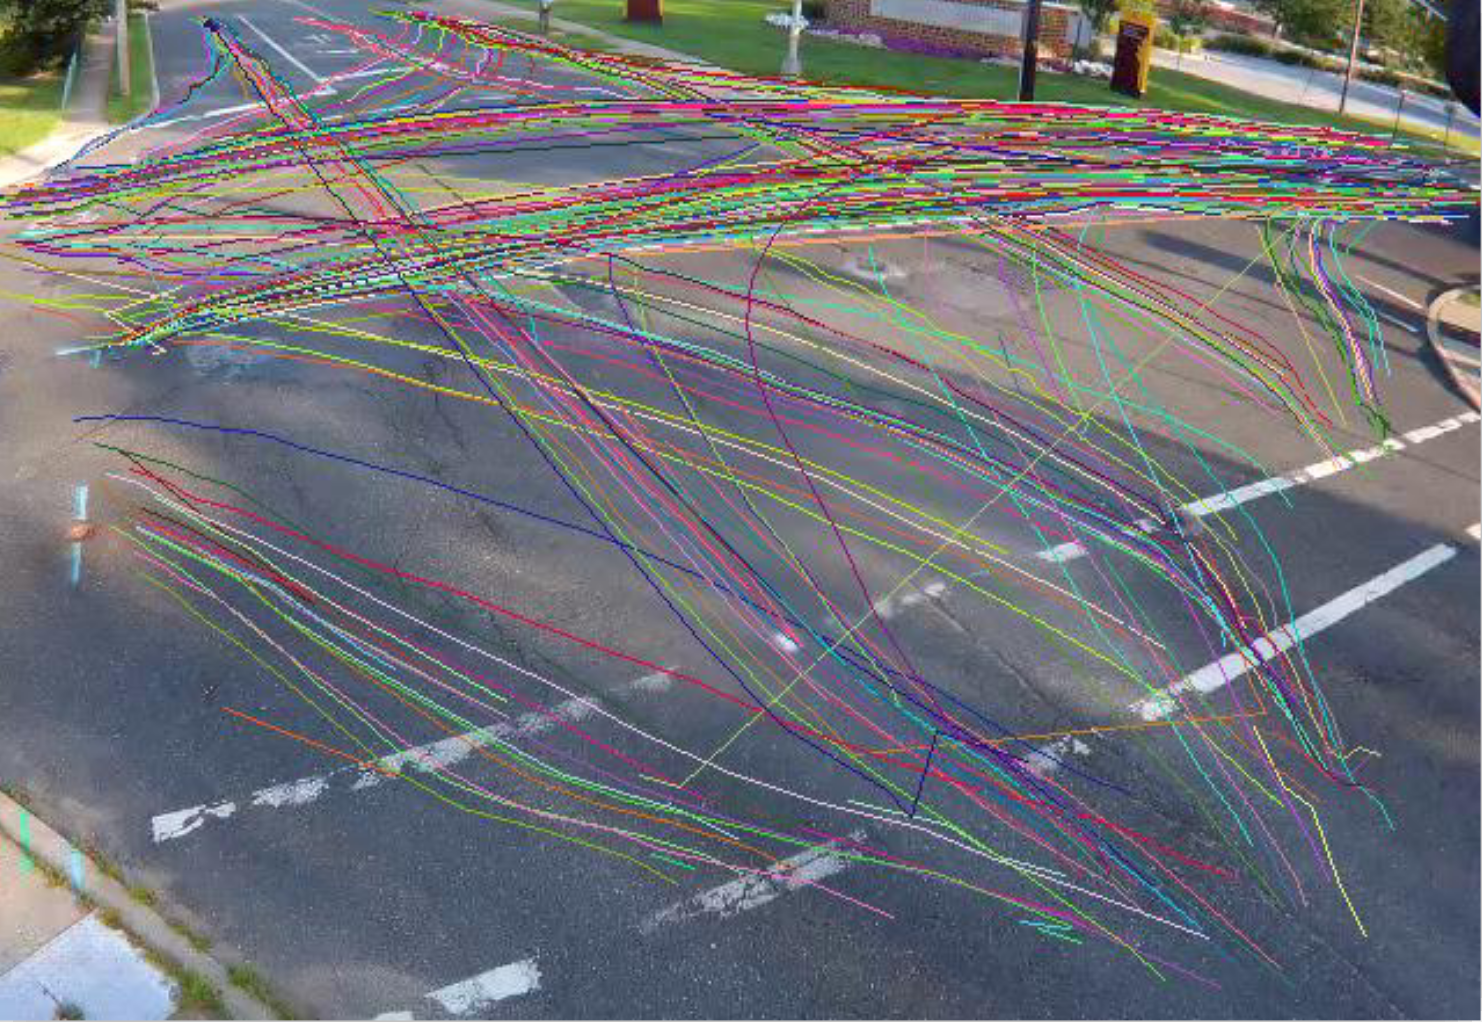
Figure 2. The Surrogate Safety Analysis in action, using user behavior to determine recurring hazards at intersections. Courtesy of Dr. Jalayer.
The Surrogate Safety Measure analyzes conflicts and near-misses. The implementation of a tool like the Surrogate Safety Measure will help staff to make more informed safety decisions for the state’s intersections. The AI-based tool uses a deep learning algorithm to look at many different factors: left-turn lanes, traffic direction, traffic count, vehicle type, and can differentiate and count pedestrians and bicycles as well.
The Safety Analysis Tool’s Surrogate Safety Measure contains two important indicators: Time To Collision (TTC), and Post-Encroachment Time (PET). These are measures of how long it would take two road users to collide, unless further action is taken (TTC), and the amount of time between vehicles crossing the same point (PET), which is also an effective indicator of high-conflict areas.
In practice, these metrics would register, for example, a series of red-light violations, or people repeatedly crossing the street when they should not. Over time, particularly hazardous areas of intersections can be identified, even if an incident has not yet occurred. According to Dr. Jalayer, FHWA and other traffic safety stakeholders have already begun to integrate TTC and PET into their safety analysis toolsets.
Additionally, the AI-based tool can log data that is currently unavailable for roadways. For example, it can generate accurate traffic volume reports, which, Dr. Jalayer said, are often difficult to find. As bicycle and pedestrian data is typically not available, data gathered from this tool would significantly improve the level of knowledge about user behavior for an intersection, allowing for more effective treatments..
In practice, after the Safety Analysis Tool is applied, DOT stakeholders can decide which treatment to implement. For example, Jalayer said, if the analysis finds a lot of conflict with left turns at the intersection, then perhaps the road geometry could be changed. In the case of right-turn conflicts, a treatment could look at eliminating right turns on red. Then, Jalayer said, there are longer-term strategies, such as public education campaigns.
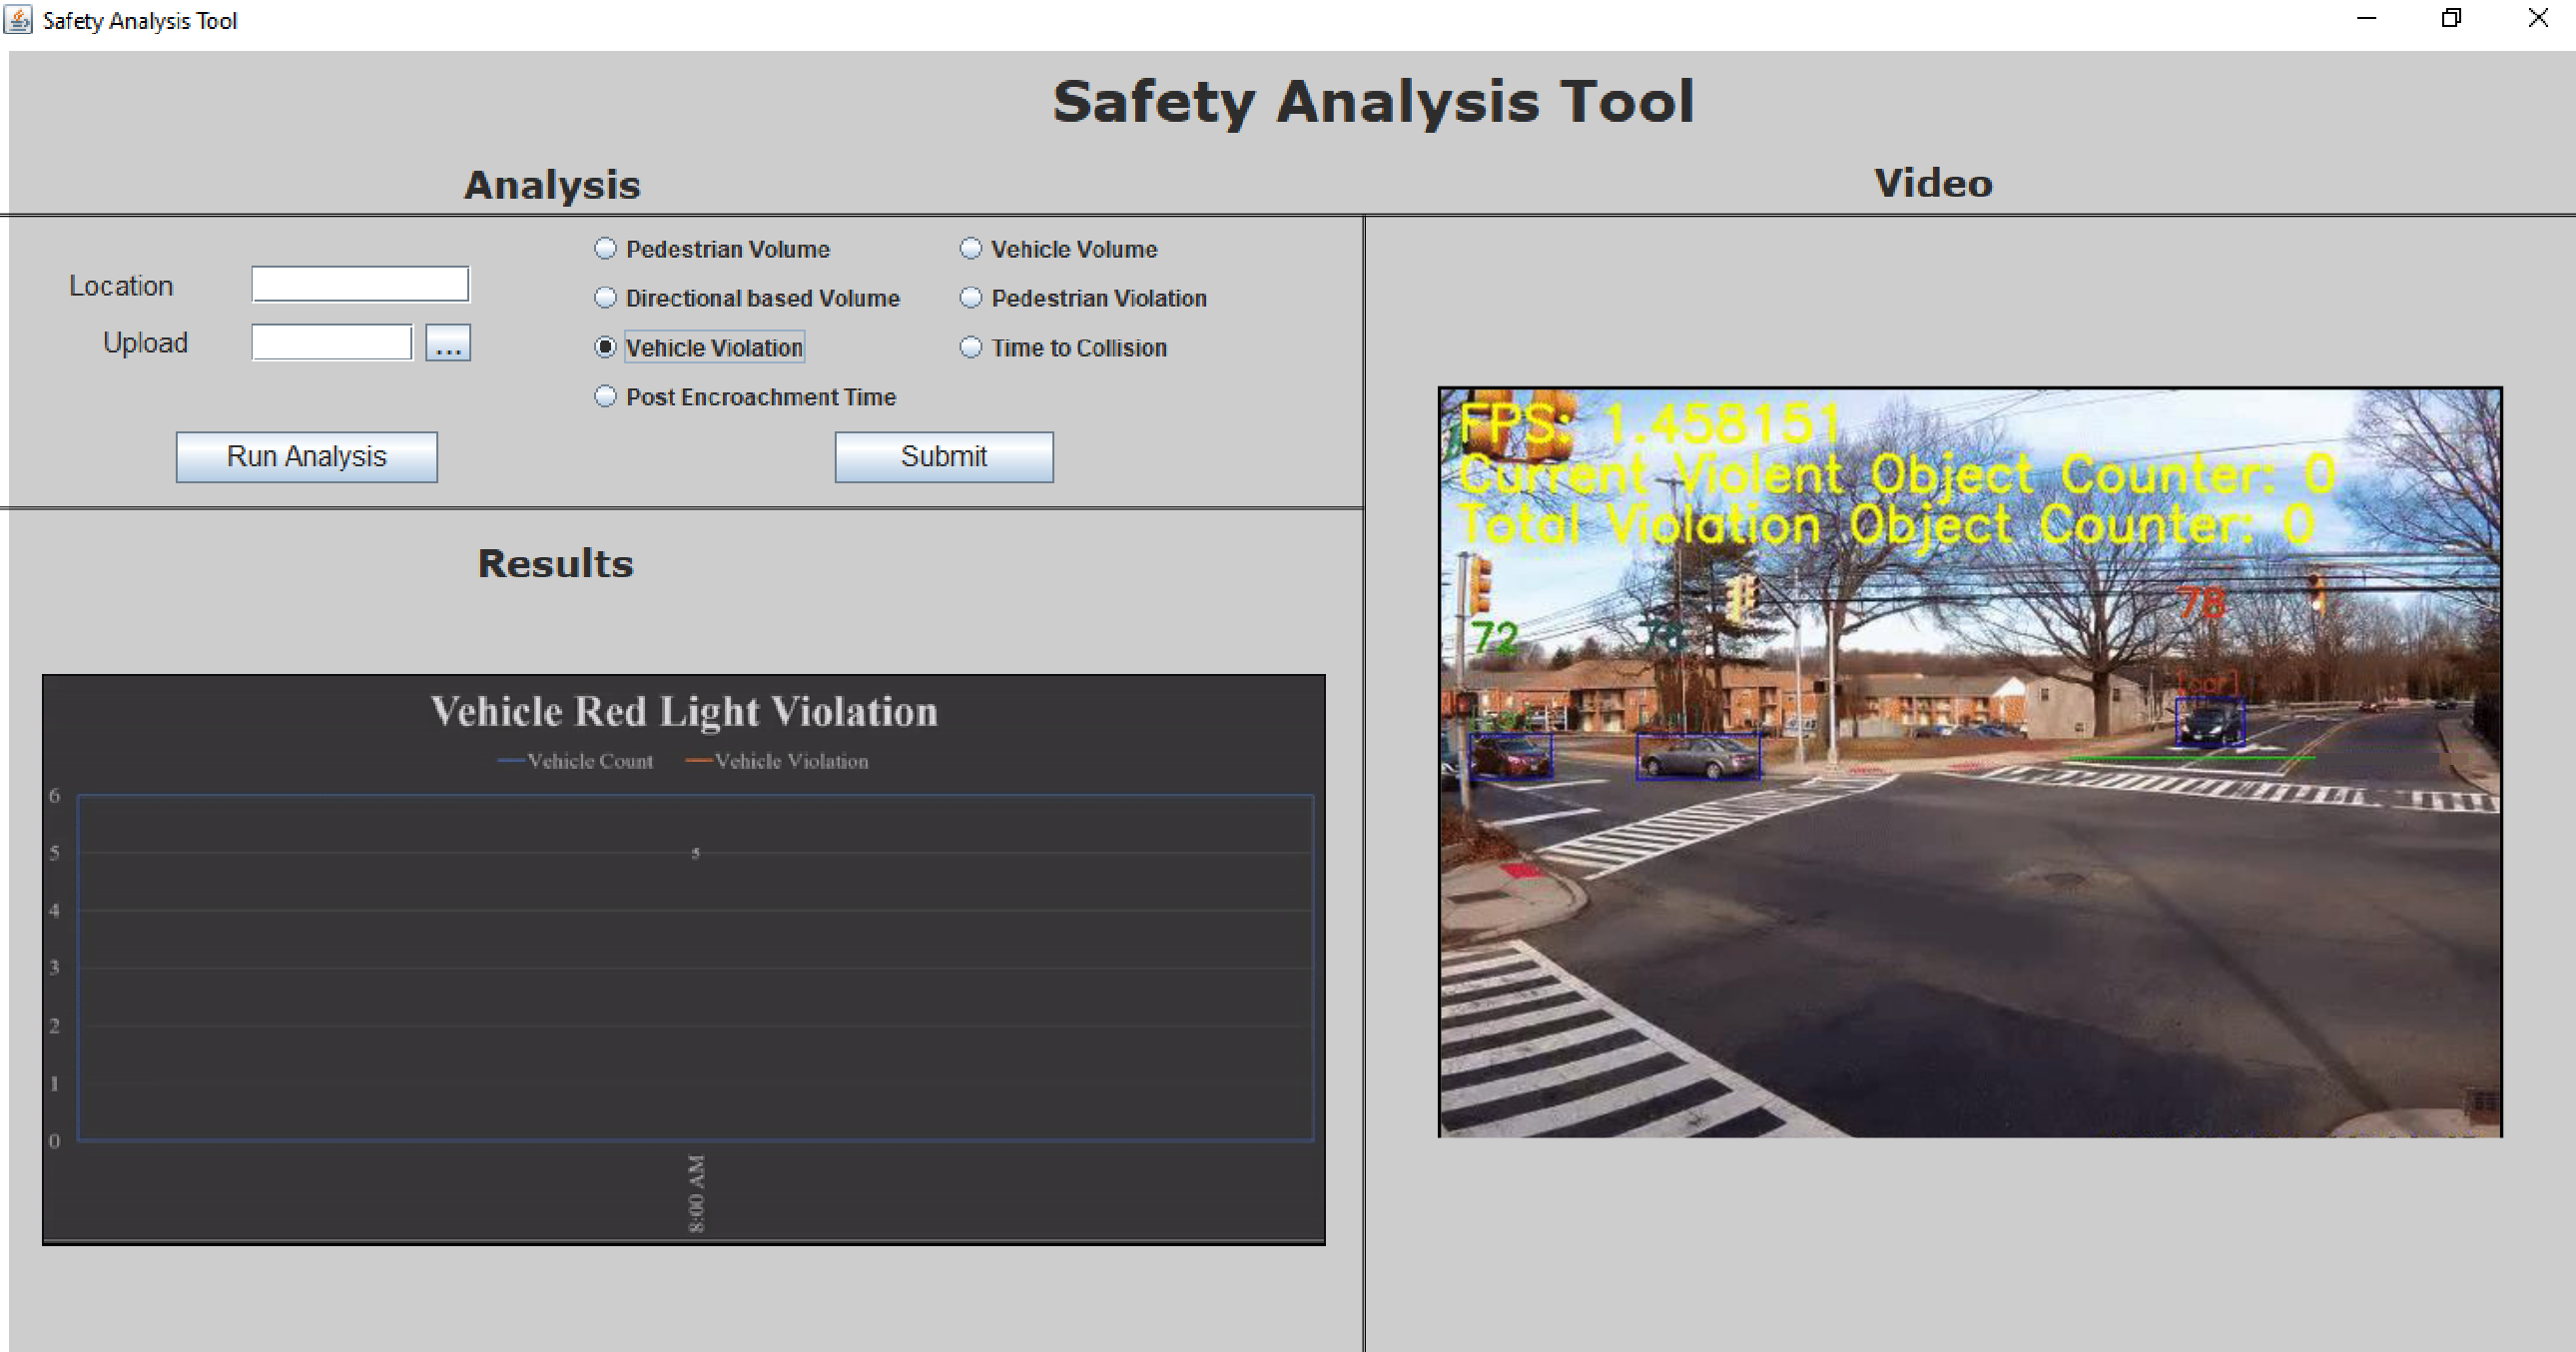
Figure 3. The Safety Analysis tool user interface, which can run various analyses of traffic video, such as vehicle violations, or pedestrian volume. Courtesy of Dr. Jalayer.
For the first phase of the project, the researchers deployed their technology at two intersections in East Rutherford, near the American Dream Mall. For the current second phase, they are collecting data at ten intersections across the state, including locations near Rowan and Rutgers universities.
Currently, this type of traffic safety analysis is handled in a personnel-intensive way, with a human physically present studying an intersection. But with the Surrogate Safety tool, the process will become much more efficient and comprehensive. The data collected will be less subject to human error, as it is not presently possible for staff to perfectly monitor every camera feed at all times of day.
This technology circumvents the need for additional staff, removing the need for in-person field visits or footage monitoring. Instead of staff with the advanced technical expertise to analyze an intersection’s safety in the field, state agencies will require personnel proficient in maintaining the automated equipment.
Many state traffic intersections are already equipped with cameras, but the data is not currently being analyzed using computer vision methods. With much of the infrastructure already present, Dr. Jalayer said that the next step would be to feed this video data into their software for analysis. There are private companies already using similar computer-vision based tools. “I believe this is a very emerging technology, and you’re seeing more and more within the U.S.,” Dr. Jalayer said. He expects the tool to be launched by early 2022. The structure itself is already built, but the user interface is still under development. “We are almost there.” Dr. Jalayer said.
AI-Based Video Analytics for Railroad Safety – Asim Zaman, PE, Project Engineer, Artificial Intelligence / Machine Learning and Transportation research, Rutgers University
Asim Zaman, a project engineer at Rutgers, shared information on an ongoing research project examining the use of computer analytics for the purpose of improving safety on and around railways. The rail safety research is led by Dr. Xiang Liu, a professor of civil and environmental engineering at Rutgers Engineering School, and involves training AI to detect trespassers on the tracks, a persistent problem that often results in loss of life and serious service disruptions. “Ninety percent of all the deaths in the railroad industry come from trespassing or happen at grade crossings,” Zaman said.
The genesis of the project came from Dr. Liu hypothesizing that, “There’s probably events that happen that we don’t see, and there’s nothing recorded about, but they might tell the full story.” Thus, the research team began to inquire into how computer vision analysis might inform targeted interventions that improve railway safety.
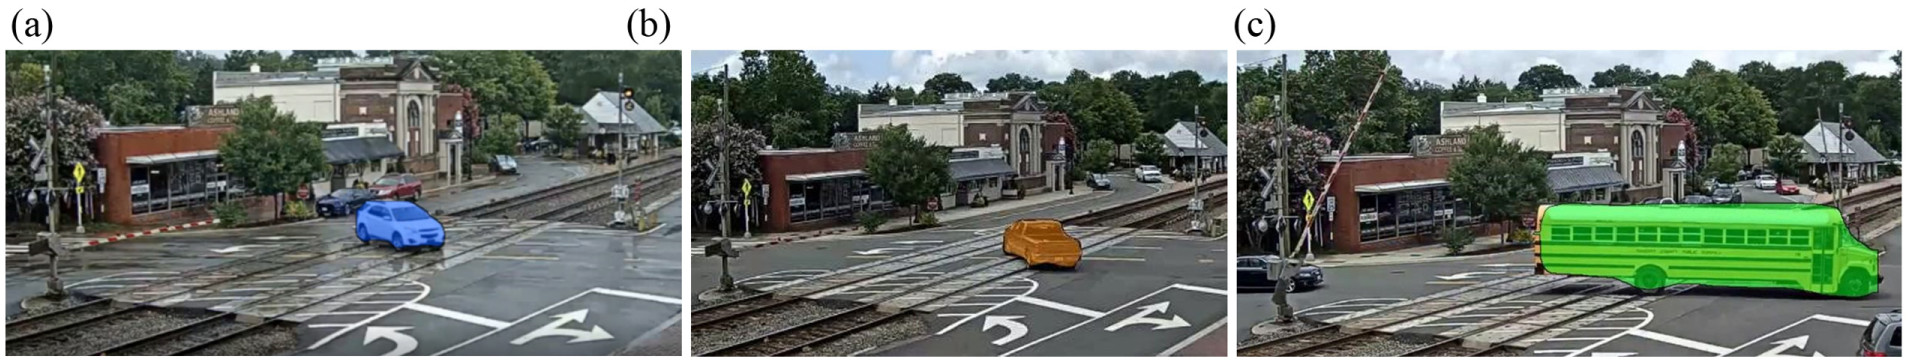
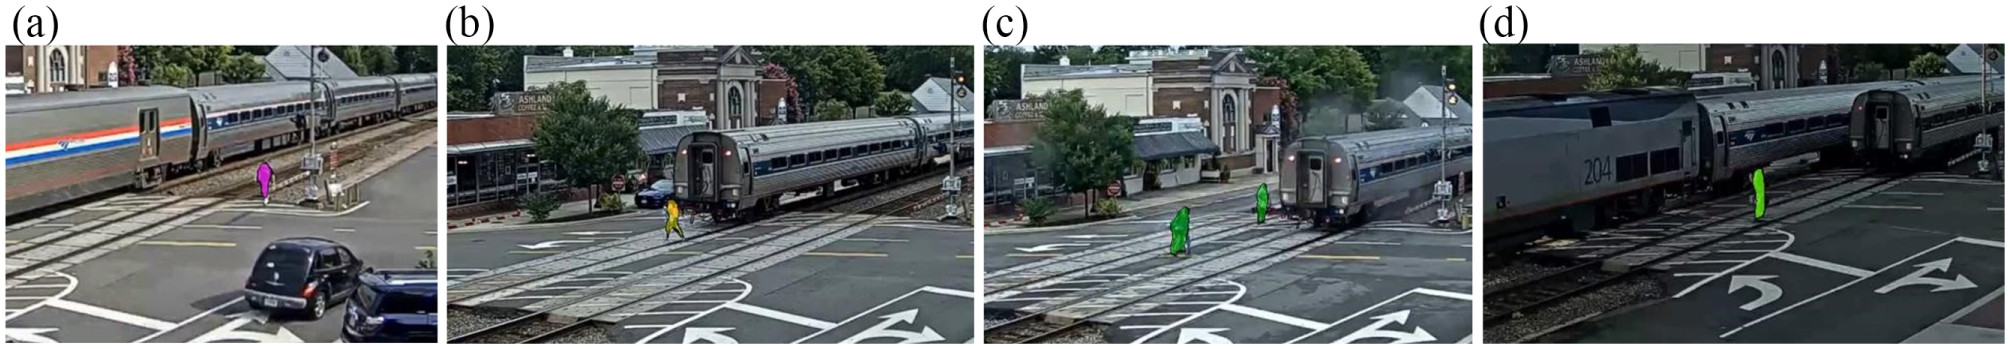
Figure 4. The color overlay of vehicles trespassing on railways demonstrates that the AI has successfully detected them. Courtesy of Zaman, Ren, and Liu.
Initially, the researchers gathered some sample video, a few days’ worth of footage along railroad tracks, and analyzed it using simple artificial intelligence methods to identify “near-miss events,” where people were present on the tracks as a train approached, but managed to avoid being struck. Data on near-misses such as these are not presently recorded, leading to a lack of comprehensive information on trespassing behavior.
After publishing a paper on their research, the team looked into integrating deep learning neural networks into the analysis, which can identify different types of objects. With this technology, they again looked at trespassers, using two weeks of footage this time. This study was effective, but still computationally-intensive. For their next project, with funding from the Federal Railroad Administration (FRA), they looked at the efficacy of applying a new algorithm, YOLO (You Only Look Once), to generate a trespassing database.
The algorithm has been fed live video from four locations over the past year, beginning on January 1, 2021, and concluding on December 31. Zaman noted that, with the AI’s analysis and the copious amounts of data, the research can begin to ask more granular questions such as, “How many trespasses can we expect on a Monday in winter? Or, what time of day is the worst for this particular location? Or, do truck drivers trespass more?”
Figure 5. Similar work shows AI identifying and flagging pedestrian trespassers. The researchers are currently working on using unreported “near-miss” data to improve safety. Courtesy of Zaman, Ren, and Liu.
After the year’s research has concluded, the researchers will study the data and look for applications. Without the AI integration, however, such study would be time-consuming and impractical. The applications fall under the “3E” categories: engineering, education, and enforcement. For example, if the analysis finds that trespassing tends to happen at a particular location at 5pm, then that might be when law enforcement are deployed to that area. If many near-misses are happening around high school graduation, then targeted education and enforcement would be warranted during this time. But without this analysis, no measures would be taken, as near-misses are not logged.
Currently, this type of technology is in the research stage. “We’re kind of in the transition between the proof of concept and the deployment here,” Zaman said. The researchers are focused on proving its effectiveness, with the goal of enabling railroads and transit agencies to use these technologies to study particularly problematic areas, and determine if treatments are working or if additional measures are warranted. “It’s already contributing, in a very small way, to safety decision making.”
Zaman said that the team at Rutgers was very interested in sharing this technology, and its potential applications, with others. In his estimation, these computer analytics are about five years from a more widespread rollout. He notes that this technology would be greatly beneficial as a part of transportation monitoring, as “AI can make use out of all this data that’s just kind of sitting there or getting rinsed every 30 days.”
Applying computer vision to existing video surveillance will help to address significant safety issues that have persistently affected the rail industry. The AI-driven safety analysis will identify key traits of trespassing that have been previously undetected, assisting decision makers in applying an appropriate response. As with other smart video analytics technologies, the benefit, lies in the enhanced ability to make informed decisions that save lives and keep the system moving.
Current and Future Research
The Transportation Research Board’s TRID Database provides recent examples of how automated video analytics are being explored in a wider context. For example, in North Dakota, an in-progress project, sponsored by the University of Utah, is studying the use of computer vision to automate the work of assessing rural roadway safety. In Texas, researchers at the University of Texas used existing intersection cameras to analyze pedestrian behavior, publishing two papers on their findings.
The TRID database also contains other recent research contributions to this emerging field. The article, “Assessing Bikeability with Street View Imagery and Computer Vision” (2021) presents a hybrid model for assessing safety, applying computer vision to street view imagery, in addition to site visits. The article, “Detection of Motorcycles in Urban Traffic Using Video Analysis: A Review” (2021), considers how automatic video processing algorithms can increase safety for motorcyclists.
Finally, the National Cooperative Highway Research Program (NCHRP) has plans to undertake a research project, Leveraging Artificial Intelligence and Big Data to Enhance Safety Analysis once a contractor has been selected. This study will develop processes for data collection, as well as analysis algorithms, and create guidance for managing data. Ultimately, this work will help to standardize and advance the adoption of AI and machine learning in the transportation industry.
The NCHRP Program has also funded workforce development studies to better prepare transportation agencies for adapting to this rapidly changing landscape for transportation systems operations and management. In 2012, the NCHRP publication, Attracting, Recruiting, and Retaining Skilled Staff for Transportation System Operations and Management, identified the growing need for transportation agencies to create pipelines for system operations and management (SOM) staff, develop the existing workforce with revamped trainings, and increase awareness of the field’s importance for leadership and the public. In 2019, the Transportation Systems Management and Operations (TSMO) Workforce Guidebook further detailed specific job positions required for a robust TSMO program. The report considered the knowledge, skills, and abilities required for these job positions and tailored recommendations to hiring each position. The report compiled information on training and professional development, including specific training providers and courses nationwide.
Conclusion
Following a brief scan of current literature and Interviews with three NJ-based researchers, it is clear that computer vision is a broadly applicable technology for the transportation sector, and that its implementation is imminent. It will transform aspects of both operations monitoring, and safety analysis work, as AI can monitor and analyze traffic video far more efficiently and effectively than human staff. Workplace roles, the researchers said, will shift to supporting the technology’s hardware in the field, as well as managing the software components. Traffic operations monitoring might transition to interpreting and acting on incidents that the Smart Traffic Video Analytics flags. Engineers, tasked with analyzing traffic safety and determining the most effective treatments, will be informed by more expansive data on aspects such as driver behavior and conflict areas than available using more traditional methods.
The adoption of computer vision in the transportation sector will help to make our roads, intersections, and railways safer. It will help transportation professionals to better understand the conditions of facilities they monitor, providing invaluable insight for how to make them safer, and more efficient for all users. Most importantly, these additional metrics will provide ways of seeing how people behave within our transportation network, often in-real time, enabling data-driven interventions that will save lives.
State, regional and local transportation agencies will need to recruit and retain staff with the right knowledge, skills and abilities to capture the safety and operations benefits and navigate the challenges of adopting new technologies in making this transition.
Espinosa, J., Velastín, S., and Branch, J. (2021). “Detection of Motorcycles in Urban Traffic Using Video Analysis: A Review,” in IEEE Transactions on Intelligent Transportation Systems, Vol. 22, No. 10, pp. 6115-6130, Oct. 2021. https://ieeexplore.ieee.org/document/9112620
Ito, Koichi, and Biljecki, Filip. (2021). “Assessing Bikeability with Street View Imagery and Computer Vision.Transportation Research Part C: Emerging Technologies. Volume 132, November 2021, 103371. https://doi.org/10.1016/j.trc.2021.103371
Liu, X., Baozhang, R., and Zaman, A. (2019). Artificial Intelligence-Aided Automated Detection of Railroad Trespassing. Transportation Research Record: Journal of the Transportation Research Board. https://doi.org/10.1177%2F0361198119846468
Cronin, B., Anderson, L., Fien-Helfman, D., Cronin, C., Cook, A., Lodato, M., & Venner, M. (2012). Attracting, Recruiting, and Retaining Skilled Staff for Transportation System Operations and Management. National Cooperative Research Program (No. Project 20-86). http://nap.edu/14603
Pustokhina, I., Putsokhin, D., Vaiyapuri, T., Gupta, D., Kumar, S., and Shankar, K. (2021). An Automated Deep Learning Based Anomaly Detection in Pedestrian Walkways for Vulnerable Road Users Safety. Safety Science. https://doi.org/10.1016/j.ssci.2021.105356
Shi, Hang and Liu, Chengjun. (2020). A New Cast Shadow Detection Method for Traffic Surveillance Video Analysis Using Color and Statistical Modeling. Image and Vision Computing. https://doi.org/10.1016/j.imavis.2019.103863
Zhang, Z., Liu, X., and Zaman, A. (2018). Video Analytics for Railroad Safety Research: An Artificial Intelligence Approach. Transportation Research Record: Journal of the Transportation Research Board. https://doi.org/10.1177%2F0361198118792751
Zhang, T. Guo, M., and Jin, P. (2020). Longitudinal-Scanline-Based Arterial Traffic Video Analytics with Coordinate Transformation Assisted by 3D Infrastructure Data. Transportation Research Record: Journal of the Transportation Research Board. https://doi.org/10.1177%2F0361198120971257
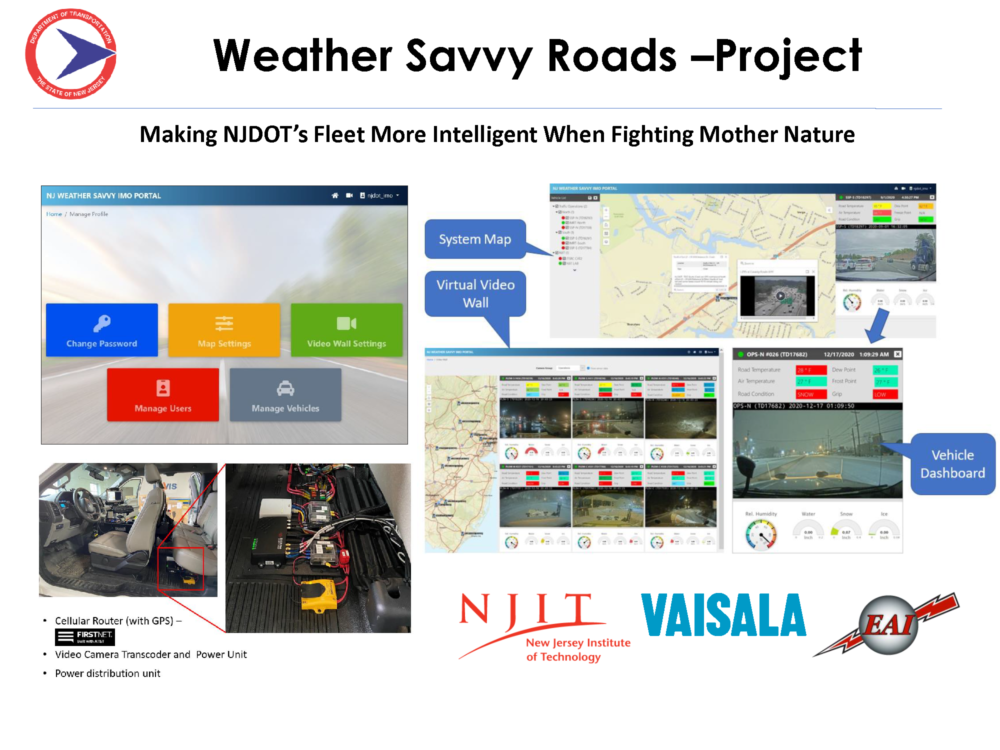
The Intelligent Transportation Society of New Jersey (ITS-NJ) recognizes outstanding projects or programs that employ or advance ITS technologies. This year NJDOT’s “Weather Savvy Roads” system, also known as the Mobile RWIS effort, received its 2021 Outstanding Project Award.
NJDOT’s Weather Savvy Roads Program was recently recognized by the Intelligent Transportation Society of New Jersey
NJDOT’s Weather Savvy Roads (WSR) program started with NJDOT’s Mobility Division applying for and receiving NJ’s first federal Accelerated Innovation Deployment (AID) grant. The concept was to procure and install mobile RWIS devices and dash cameras in 23 DOT snow-fighting vehicles statewide to view real time conditions and guide decisions for allocation of resources during a winter event.
The team is comprised of staff from NJDOT Mobility, NJDOT Operations, the NJIT ITS Resource Center, and technical partners from Vaisala and EAI. NJIT created a web-based platform where users could view a statewide map and data from the RWIS devices and video from the CCTV6 in real time.
The WSR project was also designed to continue NJDOT’s investigation into cellular strength along NJDOT’s road network. This effort was first evaluated during NJ STIC Incentive grant funded program using iCone devices on SSP trucks. Utilizing a cellular router carrying FIRSTNET cellular capability, the technical team at NJIT is evaluating the strength of this first responder-only focused cellular system to see the various levels of signal strength. The project has shown tremendous benefits after just one winter season with staff across multiple levels of the Department utilizing the web platform to make better informed decisions about staffing and contractor use.
To learn more about the project, click on the NJ Innovative Initiatives, Weather Responsive Management Strategies page, or watch a presentation to the NJ STIC by Sal Cowan, Senior Director of Mobility at NJDOT about the equipment installation and web interface efforts taken for the pilot project.
The FHWA is promoting the deployment of Digital As-Builts (DABs) in Round 6 of the Every Day Counts (EDC-6) Program. FHWA defines DABs as an accumulation of the data used during digital project delivery that provides a living record of built infrastructure for agencies’ future business needs. The latest FHWA Innovator, September/October, Issue 86, features a section on e-Ticketing and Digital As Builts that briefly defines the innovation and its benefits along with a short video of digital delivery efforts at Utah DOT.
During EDC-6, the NJ STIC has set forward goals for advancing Digital As-Builts, assessing the current stage of innovation as “development” and setting forward some near-term capacity-building actions.
This article reports on a brief Digital As-Builts Literature Scan and provides references to a select bibliography of research reports, strategic plans and other resource documents that may warrant closer inspection for innovation teams. The literature scan identifies some key definitions, benefits, emerging practices, recurring challenges and possible lessons when taking steps toward deployment of DABs.
Digital As-Builts Literature Scan
Introduction
A Digital As-Built (DAB) innovates by transferring what are typically 2D, paper records into digital, three-dimensional (3D) datafiles that can be regularly updated and shared with stakeholders throughout a project’s life cycle. This information becomes invaluable in the asset management and operations phase, in which it is crucial for agencies to have the most current, comprehensive data covering their facility’s construction. DABs can also be referred to as digital twins, intricate computerized copies of a road or bridge that simulate real-time conditions, allowing for predictive maintenance and more cost-effective mitigation projects.
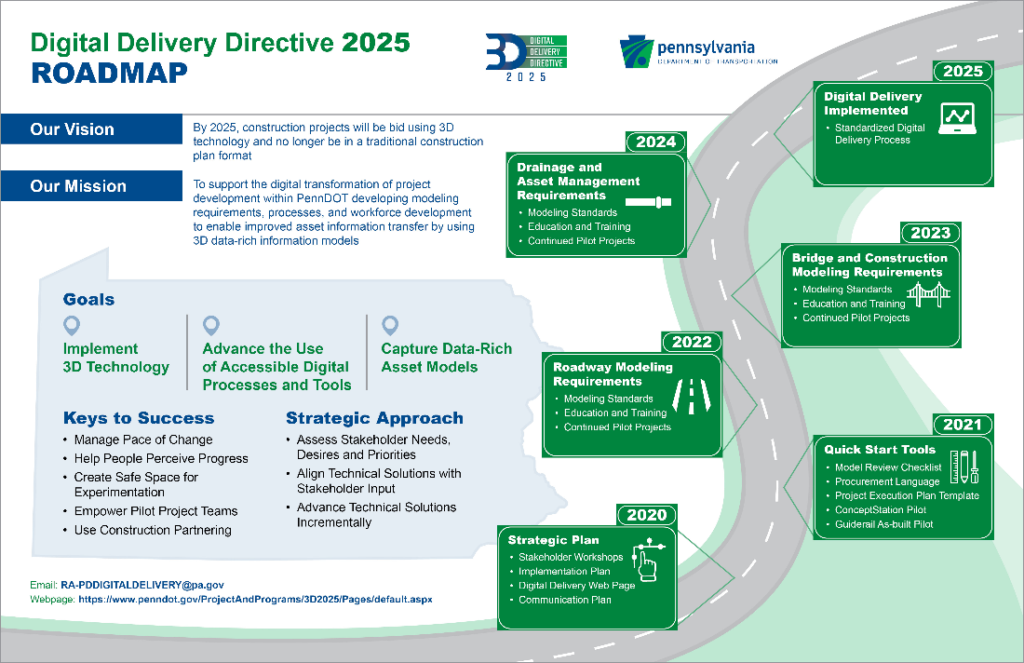
Across the country, state departments of transportation (state DOTs) are beginning to adopt DABs requirements for future road and bridge projects. The Pennsylvania Department of Transportation (PennDOT), for instance, has established ambitious agency goals that by 2035, all agency projects will be bid upon using 3D models—which will be updated throughout the project’s development through completion, and then stored in a centralized database (PennDOT, 2020).
While industry standard software and practices are still emerging, the research, experiences, and challenges from DOTs nationwide can assist in the identification of promising practices and planning the transition to DABs.
Benefits of Digital As-Builts
Digital As-Builts are digitized, detailed records of completed construction projects. These could encapsulate roadways, bridges, barriers, berms, and any other facilities. What is revolutionary about DABs is their capacity to be used as digital twins, sophisticated mock-ups of the actual structure that enable agencies to streamline maintenance and improvement projects. DABs are simple to store and distribute, reducing the time and material costs from producing traditional 2D as-builts. Created using Computer Aided Drafting and Design (CADD) software, and updated with real-world readings, such as laser-based LiDAR, DABs are versatile and, increasingly, trustworthy records.
DABs were selected as part of the FHWA’s EDC-6, featured for their advances in safety, time savings, and quality (FHWA, 2021). In addition to providing high quality records that can optimize maintenance and asset management, DABs can streamline the project development process by easily showing decision makers the location of existing infrastructure. The safety benefits come, in part, from shorter work interruptions of regular traffic flows.
DABs offer the capability to reliably retain information throughout the project process, as data is handed over from one department agency to another. A UC-Davis report, conducted on behalf of the California Department of Transportation (Caltrans), suggests that DABs can reduce the risk of lost information considerably (Advanced Highway Maintenance and Construction Technology Research Center, 2020). Another report, prepared for the Kentucky Transportation Cabinet (KYTC) by University of Kentucky researchers, found that digital documentation could significantly build trust in as-built records. In 2018, KYTC spent $217,000 on new forensic investigations because handmade, paper as-builts were deemed untrustworthy (Kentucky Transportation Center, 2019). But DABs, especially when well-updated and held to high standards of detail, can reduce the need for new surveys and ultimately lower costs.
DABs feed into an integrated workflow in which completed facility information is readily accessible for asset management and maintenance. This process is an element of Civil Integrated Management (CIM), and involves the entire lifecycle of a facility.
Existing Practices
Though many aspects of life have been affected by increasing digitization, the as-built record-keeping process in state transportation remains rooted in the analog era. It was apparent, from the literature reviewed, that the majority of state transportation departments are still using 2D, paper as-builts for facility specifications.
When DABs were being used, they were as pilot projects to demonstrate their efficacy. Or, when a part of agency practice, as in the case of Caltrans, implementation was inconsistent and without sufficient coordination (AHMCTRC, 2020). Similarly, in Kentucky, some records were being stored digitally but without a designated central repository, or as hardcopies in a State Library and Archives warehouse for storage (KTC, 2019), offering little use for ongoing maintenance. States like Michigan and North Carolina, while looking to transition to digital records, were still working on their digital strategies and have yet to implement them as practice (FHWA, 2019).
Some states have recently established regulations requiring DABs, such as the Colorado Department of Transportation (CDOT), which updated the State Highway Utility Accommodation Code in 2021 calling for 3D subsurface models showing the location of utility lines in CDOT’s Right-of-Way (Colorado Department of Transportation, 2021). New York has established a 3D, 4D, and 5D requirement for certain megaprojects (such as the new Kosciuzko Bridge), that tie contractor payments to a continuously-updated model that is then revised with as-built information (FHWA, 2014). And Nevada, while requiring digital contract documents, has yet to add an as-built component. (Nevada Department of Transportation, 2021).
Many DOTs are being spurred to action by technological innovations and by prior EDC rounds (FHWA, 2015) and by the current FHWA’s EDC-6 e-Ticketing and Digital As-Builts initiative.
Emerging Practices
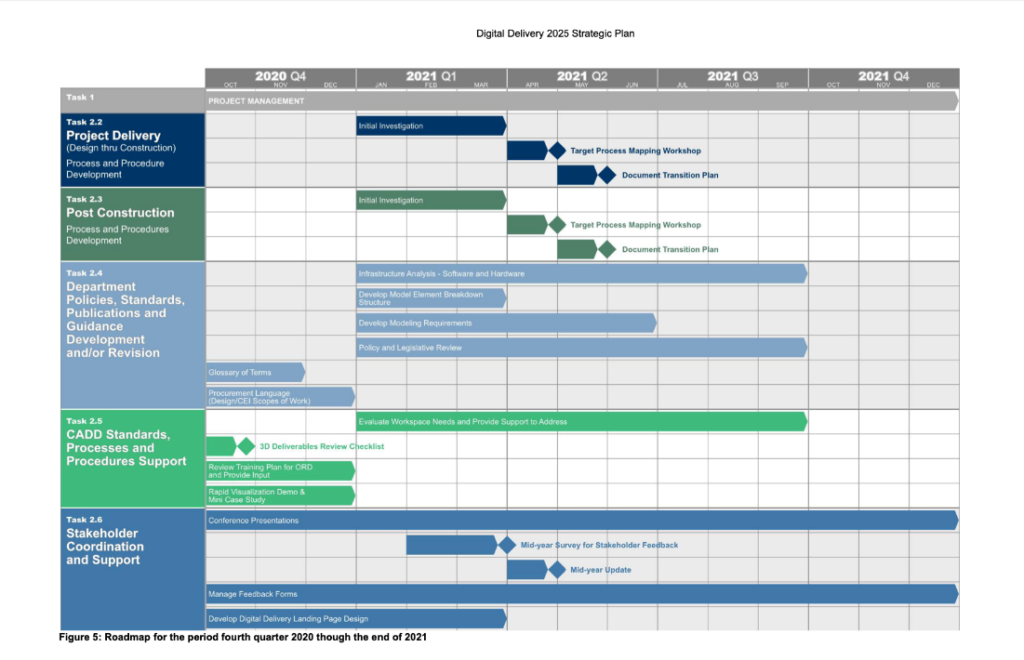
PennDOT appears at the leading edge in its development of a comprehensive DAB implementation plan, intending to adopt the digital delivery process as a department standard by 2025. For DABs, this involves a 5-year span spent developing standards and workflows for implementation. The planning process includes the functioning of various working groups for determining necessary infrastructure and modeling requirements, workspace needs, and training plans. Though PennDOT’s plan is still in progress, their Digital Delivery 2025 Strategic Plan offers a good example of a comprehensive, implementation document detailing steps the agency must take to make the transition to digital delivery (PennDOT, 2020).
Figure 1: Sample Digital Delivery Roadmap from PennDOT.
Agencies in other states are also piloting new standards. Many DOTs are planning to convert from paper records, and to capitalize on this transition by taking advantage of the new digital records in the asset management process.
The Utah Department of Transportation of Transportation (UDOT) has created a website describing the benefits of digital delivery, including the advantages of the use of Digital Twins (UDOT, 2021). UDOT’s site also contains sample deliverables packages for contractors, with technical specifications for roadways, drainage, and structures viewable in Bentley ProjectWise, and document management software used for DABs by several DOTs (e.g., Virginia, Washington, Kentucky, and others) (Virginia Department of Transportation, 2019).
Virginia is also working to establish new guidelines to support the Civil Integrated Management (CIM) process. The guidelines will set standards for Level of Detail (LOD) for 3D renderings, as some models can be inconsistent. Because they are intended to exist as exact records of the constructed facility, DABs are required to be the highest LOD (Level 400) (Virginia Department of Transportation, 2020).
Michigan and North Carolina are currently transitioning from 2D plan sheets to 3D models of contractual documents (FHWA, 2019). Both states plan to incorporate the records into asset and operations management over the project’s lifecycle.
NYSDOT, for a bridge reconstruction in the Catskill region, developed a 3D model for a contract document using Bentley iTwin Design Review software (CS Engineer Magazine, 2021). After the bridge is completed, the contractor is obligated to upload as-built information to the 3D model. This approach is being piloted in New York, but is not yet adopted practice.
In Minnesota, the state Department of Transportation (MnDOT), adopted special as-built requirements for certain regions in the state, starting in the Minneapolis-St. Paul Metropolitan area (FHWA, 2019). The agency also has a dedicated website with DAB specifications. For example, a barrier as-built report might include latitudinal and longitudinal X, Y, and Z coordinates, as well as a Plan ID referring back to the plan set.
Nearby, Iowa DOT has begun using geo-equipped devices from ESRI to capture vector and asset attribute data during the construction process (Iowa DOT Research, 2021). The geolocated data captures the location and geometry of facilities, and is then uploaded to a Microsoft SQL server. As opposed to developing a 3D model in the design process, and then updating it with as-built conditions, an after-the-fact approach captures three-dimensional as-built data outside of the Building Information Modeling (BIM) process.
Other states are exploring how they might apply these concepts to how they manage the planning, design, construction, and maintenance of their facilities. The literature resources reviewed made the benefits of DABs abundantly clear, and showed considerable progress being made, but they also identified challenges in the full-scale deployment of Digital As-Builts as standard practice.
Challenges
Several of the resources reviewed identified barriers for DOTs for implementing DABs. For Developing a Strategic Roadmap for Caltrans Implementation of Virtual Design Construction/Civil Integrated Management (2020), researchers surveyed Caltrans employees from various departments to learn more about the obstacles that the department faced. Similarly, University of Kentucky researchers surveyed Kentucky Transportation Cabinet (KYTC) staff, in Redefining Construction As-Built Plans to Meet Current Kentucky Transportation Cabinet Needs (2019). FHWA has also prepared reports on innovative digital records practices at various states that detail various challenges (FHWA, 2019).
These reports reveal some recurring themes on the challenges experienced by state DOTs that can be broken into two axes — Workflow and Workforce — as well as some solutions to surmount them.
Table 1: Examples of Workflow and Workforce Challenges and Solutions to DABs Implementation
Axes
Challenges
Solutions
Examples
Workflow
Inconsistent Implementation
Develop robust, time-tested workflows
PennDOT
Workflow
Siloization
Facilitate interdepartmental coordination on projects and data updates
Caltrans
Workflow
Compatibility
Extensively test software workflows for technical errors, such as incompatibility
PennDOT
Workflow
Standards
Create file, format, and procedural standards (i.e. designated Levels of Detail). Require compatible software infrastructure to support DABs
PennDOT, UDOT, VDOT, NDOT, CDOT
Workforce
Digital Competencies
Educate employees with ongoing trainings that ease into DAB process
PennDOT
Workforce
Compliance
Educate for and enforce DAB protocols
UDOT, MnDOT
For example, the Caltrans report made clear that the development of an agency-wide workflow was paramount. Without one, various divisions were inconsistent and ineffective at capturing, maintaining, and communicating about DABs. Caltrans Roadway Design and Structures Design divisions fell short in updating and sharing the existence of updates with one another (AHMCTRC, 2020).
Regarding particular software, files, and workstations, care must be taken in the workflow design process to ensure compatibility. In Caltrans case, the Roadway Design and Structures Design divisions were using incompatible 3D modeling software. Iowa DOT experienced a similar issue, in which 3D, geolocated models created using ESRI software were then unable to be meaningfully edited in Bentley MicroStation (Iowa DOT Research, 2021). In addition, Iowa DOT’s 3D models, designed as part of a BIM process for a bridge girder replacement project, could not be edited because of the file type. An audit of Kentucky’s Transportation Cabinet found that, though there was a central repository for digital records (Bentley’s ProjectWise), files were uploaded inconsistently (KTC, 2019). While NYSDOT had planned, during the construction of the new Kosciusko Bridge, to continuously update a 3D model to show newly built components, they experienced severe network capacity constraints that prevented them from doing so (FHWA, 2014). Upfront planning, interdepartmental collaboration and testing ensures that DABs potential is unleashed.
The second tier of challenges arise from issues with workforce adoption. An FHWA case study looking at digital record keeping at MnDOT highlights difficulty with securing buy-in from construction staff to comply with new DAB requirements (FHWA, 2019). The KYTC study singled out a lack of digital competencies from older employees as one barrier towards adopting these new technologies. Change is difficult to implement, but especially when staff have become accustomed to the same practice for decades.
Recommendations
For Workflow design, a considered and deliberative process is required. Agencies must convene working groups of stakeholders and learn about department-specific concerns and established processes. Several years may be required to design new DAB workflows that maximize the potential of the new technology, and ensure that the infrastructure is in place to support and encourage staff to follow these workflows.
PennDOT’s plan for implementing digital delivery is an instructive and thorough model document on the subject (PennDOT, 2020). The agency’s Digital Delivery Strategic Plan breaks tasks down into actionable steps, such as Task 2.3, Post Construction Process and Procedures Development, scheduled from Q2-Q3 of 2021, which will map out new requirements and a plan to realize the new processes. An agency wishing to avoid siloization would do well to consult the UC-Davis study that provides itemized, exact solutions.
Figure 2: Another visual representation of PennDOT’s Digital Delivery Roadmap.
Architects of the new DAB workflow should be careful to promote interdepartmental collaboration, as well as select compatible software that supports such a goal. Bentley Systems design, engineering, and review software—MicroStation, OpenRoads, and ProjectWise, principally—appear to be the most consistently used across the country (AHMCTRC, 2020). For determining a cohesive workflow, it is imperative that varying software have compatibility with one another—and that they are consistently used across the department.
For the issue of designated detail levels, both Minnesota and Virginia have developed tables with standards specifying when and where to make DABs as accurate as possible, such as whether to survey the constructed facility at a detail of one foot or one meter (FHWA, 2019). The overall objective of the department may help to guide the development process: how does the agency aim to utilize BIM technology? A representative DAB could help to dramatically increase the efficiency of future maintenance or upgrade projects, but only if the appropriate standards are first put in place.
The Workforce presents complementary challenges and solutions. A technology is only useful if it is appropriately deployed—part of the workflow design process should include consultation with staff on specific barriers they face in their daily adoption of the technology. What might be preventing them from doing so? What types of trainings are required to achieve core competencies? Interviewing staff stakeholders will also help to determine accountability measures that could be put in place, for both staff and contractors, to help ensure consistent compliance with new workflows (KTC, 2019).
Moving Forward
Digital As-Builts are a promising technological innovation that can reduce inefficiencies in the life cycle of a transportation facility. If appropriately deployed, DABs can maximize the value of a project, eliminating the need for new forensic investigations, and retaining information as it is handed off from one phase to the next. Many of the DOTs surveyed are considering and incorporating innovative practices into their DAB implementation. Both Caltrans and KYTC, for example, are studying the use of laser-based scanning technologies to develop geolocated 3D models post-construction. In the coming years, as DABs are adopted into practice, more case studies will become available for reference.
From the resources reviewed, it was apparent that Digital As-Builts are promising technology that can streamline record-keeping and save transportation agencies both time and money.
Federal Highway Administration (2021). e-Ticketing and Digital As-Builts. Federal Highway Administration. https://www.fhwa.dot.gov/innovation/everydaycounts/edc_6/eticketing.cfm
The following is a list of recently proposed and revised standards from ASTM from May 1, 2021 to August 1, 2021. Standard revisions have been sorted by their placement in the ASTM Book of Standards.
The following is a list of research published by the Transportation Research Board (TRB) between July 1st, 2021, and August 31st, 2021. Current articles from the TRB may be accessed here.
The BTS National Transportation Library maintains a Library Guide devoted to providing various 508 Accessibility Resources. The guide includes several valuable resources including accessibility policies, digital submission checklists for researchers, and recommended training resources. Click here to visit this resource.
The Transportation Research and Connectivity Pooled Fund Study (TPF-5(442)) has created several valuable resources on 508/Accessibility. Click here for this information.
This article first appeared in the FHWA’s EDC News Weekly Newsletter of August 26th, 2021 and featured NJDOT’s application of high performance thin overlays (HPTO) as a pavement preservation tool.
Targeted Overlay Pavement Solutions
Last week, we discussed a case study involving bonded concrete overlays, part of the Targeted Overlay Pavement Solutions (TOPS) toolbox. This week, we’ll look at how New Jersey has used high performance thin overlays (HPTO) successfully as a pavement preservation tool.
Since 2015, NJDOT has used HPTO on more than 1,000 lane miles to seal pavement and improve ride quality. Benefits include short road closures reducing impact on traffic, and addition of approximately 10 years of service life. Timing of the application is crucial. A Rutgers University study found applying HPTO to pavements while they are still in “good” condition more than doubles the service life compared to applying the product to pavements in “fair” condition.
Contractors who construct NJDOT projects have not reported constructability issues or complaints about the mix. NJDOT believes including performance requirements for the mixture, understanding treatment selection and application timing, and requiring project engineers to approve specifications are key factors in the success of HPTO as a pavement preservation tool.
Based on this research and evaluation of projects to date, NJDOT considers HPTO a cost-effective solution that provides a safe, smooth, crack and rut resistant surface that extends the life of the pavement and causes minimal impact on the road users and environment during construction.