Lunchtime Tech Talk! WEBINAR: Dredging, Dredged Material Management and the NJ Marine Transportation System

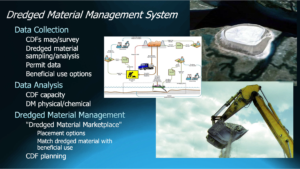
On May 12, 2020, the NJDOT Bureau of Research hosted a Lunchtime Tech Talk! Webinar on "Dredging, Dredged Material Management and the New Jersey Marine Transportation System.” W. Scott Douglas, Dredging Program Manager in NJDOT’s Office of Maritime Resources (OMR), discussed the dredging process, management of dredged material, OMR’s asset management system, and dredging case studies.

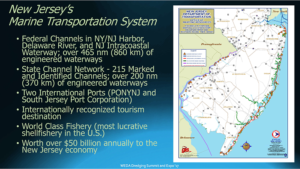
Mr. Douglas discussed the extent of New Jersey's Marine Transportation System, and its significance to the local, and larger economy.

Mr. Douglas described the New Jersey Marine Transportation System (MTS) that includes all infrastructure and equipment that connects land-based transportation assets to navigable water. The MTS supports a $50 billion industry that encompasses international and domestic freight, commercial fishing, recreational boating, travel and tourism, marine trades and ferries. NJDOT is directly responsible for maintaining some 200 of the 600 nautical miles of engineered waterways that provide safe navigation pathways to and from the shore-based infrastructure, and provides dredged material management services for another 150 nautical miles of Federal waterway. Since Superstorm Sandy, OMR is the State’s lead agency for these responsibilities, providing planning, design, procurement and construction services and coordinating the State’s waterway emergency response.

The system is divided into three regions: the New Jersey/New York Harbor (the third largest port in the country), the Delaware River, and the Atlantic Shore where NJDOT takes a larger role. Much of their work involves managing clean dredge materials in shallow draft areas where there is little land on which to place the dredged material. Mr. Douglas described the various aspects of the dredging process including bathymetric surveys, sediment sampling and analysis, and permitting, and went on to explain uses of dredged material.

As a natural part of the aquatic ecosystem, sediment is a resource. The Office of Maritime Resources works to reuse the material in various ways depending on the nature and composition of the sediment. Mr. Douglas offered several examples of reuse such as construction fill, beach replenishment, landfill capping, and brownfield redevelopment. The OMR is exploring the use of sediment to increase shoreline resiliency through marsh and dune restoration and other shoreline stabilization techniques, island creation, dredged hole replacement, and habitat creation.

The talk highlighted several facets of collecting, tracking, and dispersing dredged materials.

Mr. Douglas discussed his agency’s Maritime Asset Management tools developed to evaluate cost, conditions, and to help prioritize the Office’s work. Their Waterway Linear Segmentation database, comparable to the roadway Straight Line Diagrams, is a first in the nation for maritime asset management. OMR is assembling a dredged material database. Deployment of these tools is anticipated later this year. OMR’s Maritime Asset Management Systems comprises these two tools and produces plans based on current and future conditions, cost, and availability of dredge system management. The output is similar to the asset management reports used by highway and bridge engineers to assist management in decisionmaking.

Successes of the state’s channel dredging program include 54 channels cleared and 45 nautical miles of waterway opened. Mr. Douglas highlighted three dredging case studies including projects in the Port Jersey Channel, Shark River, and Upper Barnegat Bay. In 2020, OMR has four ongoing projects and four planned projects to open a total of 25 channels.

Participants posed questions via the Q&A feature. Mr. Douglas was asked what quality controls are in place before dredged material is moved. He noted that New Jersey has one of the most stringent systems in place in the country. NJDEP has a list of contaminants related to locations. They test both the sediment before it is moved, and the water, and a mixture of sediment water. If the material is stabilized and placed upland, it is exposed to lab testing and leachate tests on site. Another participant asked if dredging stirs up contaminants. Mr. Douglas replied that it can, and that the rigorous testing is designed to address the possibility. He noted the distinction between navigation dredging to clear a channel and environmental dredging conducted to clean contaminants from a waterway.

In response to a question concerning locations of island creation, Mr. Douglas stated that a group led by the US Fish & Wildlife Service is looking into potentially creating islands in Barnegat Bay.

A participant asked if dredged material could be used in new embankments and walls that NJDOT is building throughout the state. Mr. Douglas responded that the biggest barrier is cost. Straight fill is less expensive and easier to schedule; timing of highway projects with maritime projects has been difficult.

A participant wondered how the required dredge depth is verified once it is completed? Dredge depth is determined before dredging begins. Generally, channel depth has been determined for the entire state. Usually the depth changes only if conditions change, such as would be required with the introduction of larger vessels needing access to ports.

In response to a question concerning work continuing during the COVID-19 outbreak, Mr. Douglas noted that work is continuing and inspectors are on site every day following appropriate and requisite protocols.

The presentation given by Mr. Douglas can be downloaded here.

A recording of the webinar is available here, (or see right).
FHWA’s Ray Murphy Presents EDC-5 Weather-Responsive Management Strategies

On April 14, 2020, the NJDOT Bureau of Research hosted a Lunchtime Tech Talk! webinar on "EDC-5 Weather-Responsive Management Strategies." This event featured a presentation by Ray Murphy, ITS Specialist with the FHWA's Resource Center. Under Round 5 of the Every Day Counts (EDC) program, FHWA promotes Weather-Responsive Management Strategies (WRMS) to manage traffic and road maintenance during inclement weather to improve safety and reliability, and minimize environmental impacts associated with weather events. Weather affects: traffic safety, with 21 percent of the nearly 6 million roadway crashes in the past decade related to weather; mobility, resulting in reduced efficiency and productivity; and environmental impacts on watersheds, air quality, and infrastructure.

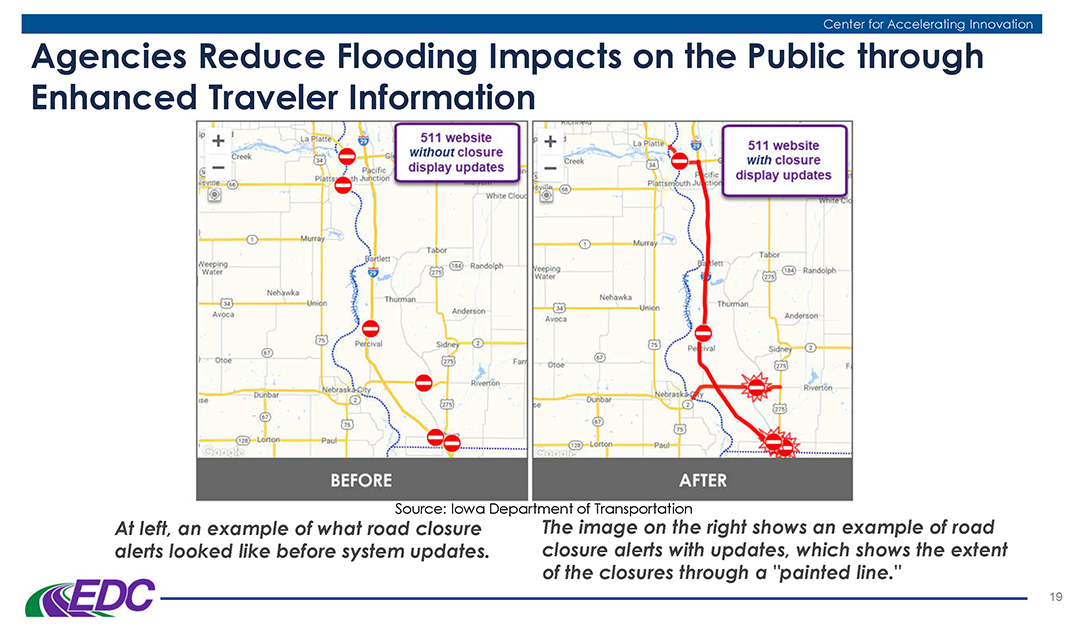
Mr. Murphy provided examples of weather responsive practices being tried by state DOTs, including an advanced traveler information notification deployed by Iowa DOT.

Mr. Murphy provided examples of weather responsive practices being tried by state DOTs, including an advanced traveler information notification deployed by Iowa DOT.

Mr. Murphy described the prior-round, EDC-4 innovation, Road Weather Management – Weather-Savvy Roads, that formed the basis for this EDC-5 initiative. The innovation promoted data collection including Pathfinder, a collaboration between the National Weather Service, state DOTs, and state support contractors to provide weather information and forecasts, and Integrating Mobile Observations (IMO) that collects weather and road condition data from instruments on agency fleet trucks.

Through WRMS, FHWA promotes the use of mobile data to support decision making. Benefits to agencies include improved safety, system performance and operations, and reduced costs and environmental impacts. Agencies can use Weather Responsive Management Systems to address diverse internal needs such as staffing, material use, and route optimization, and condition and performance reporting. Data sources include transportation agency fleets, private vehicles, third party entities, agency operators, road users and infrastructure. Some data is collected by in-vehicle sensors, video and camera images, and automatic vehicle location. Other data sources include fixed Roadway Information System (RWIS), National Weather Service, reports from road users and operators, mobile observations and connected vehicle data, among others.

The traveling public benefits through safer pre-trip and real-time route decision making based on enhanced traveler information, roadside messaging, variable speed limits, and road lane closures or restrictions. Unified, localized, and more accurate messaging gives the public increased confidence in the messaging and the agency.

Mr. Murphy addressed some common challenges that agencies face in adopting this innovation, such as a lack of connectivity in remote areas, the need for buy-in from agency leadership and from road crews, hesitance to adopt the innovation, and funding.

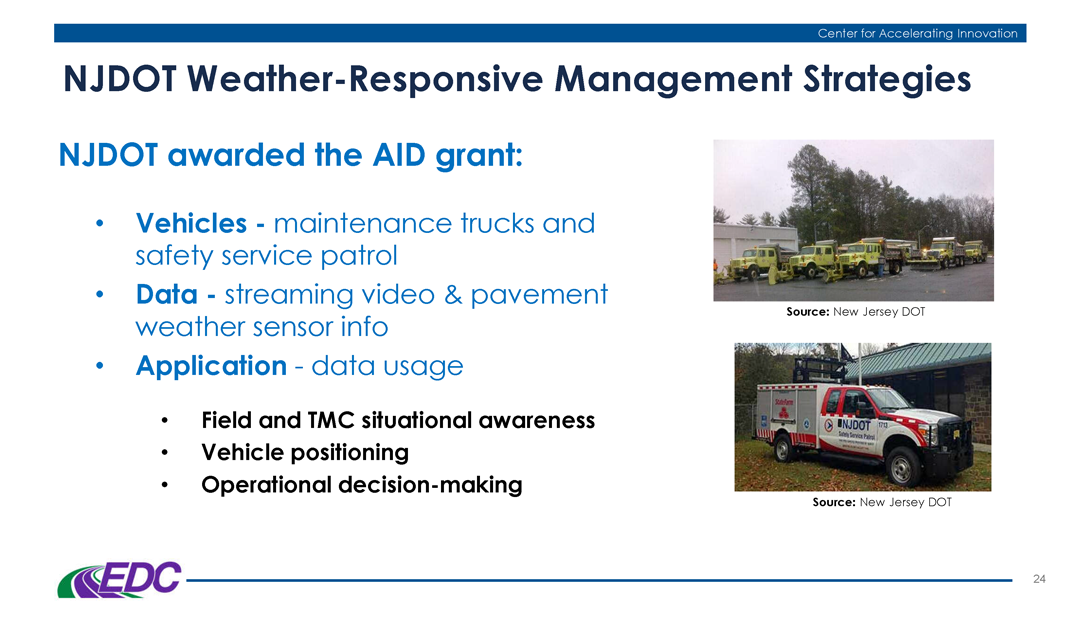
Mr. Murphy cited some of work that NJ DOT has accomplished in the field of Weather Responsive Management Strategies.

Mr. Murphy highlighted recent initiatives undertaken by NJDOT related to Weather Responsive Management Strategies that have been funded in part through FHWA innovation grants.

He noted that the State Transportation Innovation Council (STIC) Incentive Program and STIC Accelerated Innovation Deployment (AID) grants can help fund implementation of these technologies. NJDOT received a STIC incentive funding grant to support pilot testing of technology used by the Safety Service Patrols. NJDOT was also awarded an AID Grant from FHWA to support a weather savvy roads pilot program, installing video camera dashboards and sensors onto NJDOT maintenance trucks and safety service patrol vehicles to collect streaming video and weather / pavement information to support road weather management throughout the state.

Webinar participants had an opportunity to pose questions of Mr. Murphy. One participant asked about possible resistance to installation of automatic vehicle locators due to privacy concerns. Mr. Murphy noted that agencies must operate openly and inclusively when implementing this technology. Training and education can help users become more accepting of the technology.

A participant asked about the use of IMO data versus information gathered from a public entity such as WAZE. Mr. Murphy responded that the agency receives the IMO data directly and can oversee the accuracy of the data, but that information should come from multiple sources to create a robust dataset.

When asked what agencies consider the biggest challenges, and what arguments can be used to support this innovation, Mr. Murphy responded that funding is always a concern but that buy-in is often the larger issue. He emphasized the need for a champion who can demonstrate the benefits of the strategies through performance measures.

When asked if specific applications of WRMS were being considered for EDC-6, Mr. Murphy responded that various innovative practices were being considered and no decisions had been made yet.

A participant asked if these systems can be adapted to rockfall data. Mr. Murphy noted that visibility apps used with dust storms or fire events could be adapted for other weather events.

Mr. Murphy’s presentation offered several examples of DOTs nationwide employing these strategies. A participant asked if any states are quantifying the benefits of WRMS implementation. Mr. Murphy offered that Caltrans is one agency.

The presentation given by Mr. Murphy can be downloaded here.

More information on this innovation is available on the FHWA Weather Responsive Management Systems resources page.

A recording of the webinar is available here, (also to the right).

EDC-5 STEP – Safe Transportation for Every Pedestrian

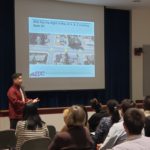
On October 30th the NJDOT Bureau of Research hosted the Lunchtime Tech Talk! Event on “EDC-5 STEP: Safe Transportation for Every Pedestrian.” This event featured Peter Eun, a Transportation Safety Engineer with the Federal Highway Administration’s Resource Center’s Safety & Design Technical Service Team in Olympia, Washington. Mr. Eun discussed recent initiatives from FHWA regarding improvements in pedestrian safety and accessibility.

According to the National Highway Traffic Safety Administration, while 2018 featured a decline in overall fatalities on our roads, there was an increase of pedestrian fatalities, highlighting the increased need for action. Considering that over 72% of pedestrian fatalities occur at non-intersection locations, Mr. Eun focused much  of his presentation on cost-effective countermeasures that can be systemically applied to reduce these crashes and save lives.

In his talk, he described how roadway configuration, traffic volumes, and posted speed limits inform the selection of appropriate countermeasures. By way of example, he referred to the Crosswalk Markings section of the Manual on Uniform Traffic Control Devices (MUTCD Section 3B.18):

Crosswalk Visibility Enhancements

Crosswalk Visibility Enhancements

“new marked crosswalks alonewithout other measures designed to reduce traffic speeds, shorten crossing distances, enhance driver awareness of the crossing, and/or provide active warning of pedestrian presence, should not be installed across uncontrolled roadways where the speed limit exceeds 40 mph and /or either has 4 or more lanes without a raised median or island and ADT of 12,000 or more, or 4 or more lanes with raised median island and ADT of 15,000 or more”.

Setting the foundation for countermeasures,  Mr. Eun cited grave statistics from research on how increasing speeds lead to greater serious injuries or fatalities for pedestrians and warned of a diminishing “cone of vision” at higher speeds as visual field and peripheral vision narrows. He shared a provocative safety video to convey how even small differences of speed can affect the ability of drivers to react and avoid crashes to the detriment of pedestrians.

Describing them as the “Spectacular Seven”, Mr. Eun highlighted the following countermeasures:

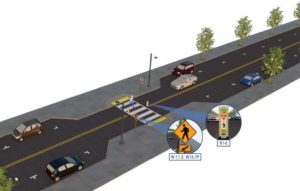
  • Rectangular rapid flashing beacons (RRFBs) are active (user-actuated) or passive (automated detection) amber LEDs that use an irregular flash pattern at mid-block or uncontrolled crossing locations. They significantly increase driver yielding behavior.
  • Leading pedestrian intervals (LPIs) at signalized intersections allow pedestrians to walk, usually 3 to 4 seconds, before vehicles get a green signal to turn left or right. The LPI increases visibility, reduces conflicts, and improves yielding.
  • Crosswalk visibility enhancements, such as crosswalk lighting and enhanced signage and markings, help drivers detect pedestrians–particularly at night.

    Pedestrian Refuge Islands

    Pedestrian Refuge Islands

  • Raised crosswalks can serve as a traffic calming measure and reduce vehicle speeds.
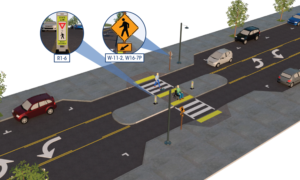
  • Pedestrian crossing/refuge islands allow pedestrians a safer place to stop at the midpoint of the roadway before crossing the remaining distance. This is particularly helpful for pedestrians with limited mobility.
  • Pedestrian hybrid beacons (PHBs) provide positive stop control for higher-speed, multilane roadways with high vehicular volumes. The PHB is an intermediate option between a flashing beacon and a full pedestrian signal.
  • Road Diets can reduce vehicle speeds and the number of lanes pedestrians cross, and they can create space to add new pedestrian facilities such as pedestrian crossing/refuge islands.

Using case examples from all over the country, Mr. Eun discussed several example situations where these countermeasures could be used, as well as the benefits to implementing them and the difficulties that may be encountered during implementation. Since expecting pedestrians to travel significantly out of their way to cross a roadway is unrealistic and counterproductive, improvements must be made to make crossings more accessible and more safe. By focusing on uncontrolled locations, agencies can address a significant national safety problem and improve quality of life for pedestrians of all ages and abilities.

Click for presentation

Mr. Eun then addressed a systemic approach to identifying safety issues and appropriate STEP countermeasures. Using this systemic approach, agencies can focus on countermeasures that address risk rather than specific locations. Once a risk factor characteristic of a number of crashes has been identified, agencies can be proactive and address that risk wherever it appears within the system. A system-based approach acknowledges crashes alone are not always sufficient to determine what countermeasures to implement, particularly on low-volume local and rural roadways where crash densities are lower, and in many urban areas where there are conflicts between vehicles and vulnerable road users (pedestrians, bicyclists, and motorcyclists). As such, systemic safety analysis does not require extensive data or complex analysis methods to be effective, just the desire to make the biggest safety impact with limited resources.

Resources

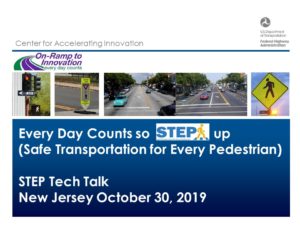
View the presentation: Eun Peter (2019). Every Day Counts so STEP up (Safe Transportation for Every Pedestrian).

View the Australian Safety PSA Video:

EDC-5 CHANGE: Collaborative Hydraulics (2.0) Advancing to the Next Generation of Engineering

On August 6th the NJDOT Bureau of Research hosted a Lunchtime Tech Talk! on “EDC-5 CHANGE: Collaborative Hydraulics (2.0) Advancing to the Next Generation of Engineering.” This event featured a presentation by Dr. Eric Brown, Senior Hydraulic Engineer, Geotechnical & Hydraulic Engineering, from the FHWA’s Resource Center. Under Round 5 of the Every Day Counts (EDC) program, Collaborative Hydraulics (2.0) provides the next-generation hydraulic modeling tools to improve the understanding of complex interactions between river or coastal environments and transportation assets, enabling better design, enhanced communication, and more efficient project delivery.

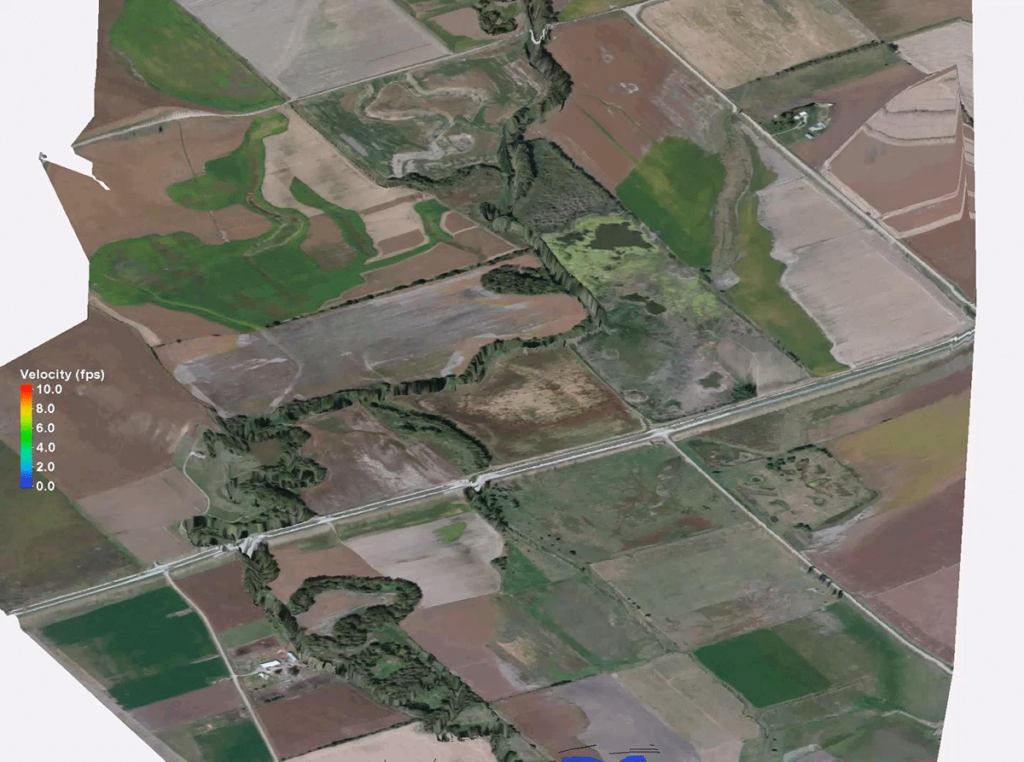
Example of 2D Modeling Results. Image credit: Nebraska DOT

Dr. Brown began his presentation by providing a background of the discipline of hydraulic engineering and its place within the Federal Highway Administration (FHWA). This included an overview of the hydraulic engineering team at FHWA, including specializations and technical expertise. The National Hydraulic Team provides its FHWA offices nationwide with assistance in the hydraulic discipline. This includes interpreting policies, publications, advancing new technologies, and recommending guidance when division offices are faced with unusual drainage problems.

Through the EDC-5 Initiative, FHWA has begun implementing its next-generation hydraulic modeling tools. Thanks to recent advances in computer hardware, modeling software, and data collection, 2-D modeling has become very efficient, intuitive, and accessible to engineers and designers. Not only are 2-D models more accurate, but they can be communicated easily to others in 3-D form.

Dr. Brown then introduced various tools that showcase FHWA’s capabilities. These included channel analysis, Weir analysis, detention basin analysis, riprap design, culvert assessments, and bridge scour analyses. These tools were then further highlighted through the hydraulic models FHWA utilizes with their newest software. These models were used to determine elevation, shear stresses, and flow velocities to assist with construction decisions.  Several other software were also highlighted, such as the US Army Corps of Engineers Hydrologic Engineering Center’s River Analysis System. This software allows the user to perform one-dimensional steady flow, one and two-dimensional unsteady flow calculations, sediment transport/mobile bed computations, and water temperature/water quality modeling. In particular, the ability for one- and two-dimensional unsteady flow simulation provided the user the greatest ability to perform analysis of water flow through open channels, floodplains, and projecting impact to construction projects.

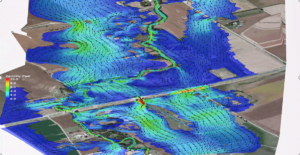
2D Modeling: SMS & SRH2D. Image credit: Nebraska DOT

With so many available tools and models, Dr. Brown’s discussion turned to his advice on what models were most appropriate for which situations. Dr. Brown recommended the 2-D modeling software for floodplains, tidal conditions, stream and river crossings with multiple bridges, and many other situations in which water was flowing in many different directions.  Through the use of various examples from across the country, Dr. Brown described how these 2-D models can provide more accurate designs with a more visually intuitive way of communicating their results.  Dr. Brown also demonstrated the ability of 2-D modeling in dealing with the aftermath of flood events; in one example after a flood had damaged the bridge deck and abutments, 2-D modeling was used to determine the amount of roadway and bridge overtopping flow to assist designers with the new roadway profile and scour protection.

This EDC-5 initiative has introduced dozens of DOTs around the country to these 2-D modeling tools. Dr. Brown highlighted these implementations from DOT’s in states like Alaska, Georgia, Nevada, and Montana. He then pitched the value of the model to NJDOT, not only in the power and strength of the tool, but in the ability that the use of cutting edge technology would provide NJDOT in its mission to attract and retain a high quality workforce.

Resources

View the presentation: Brown, E.R. (2019). New Jersey Department of Transportation Tech Talk: EDC-5 CHANGE and 2-D Modeling Considerations.

Making Work Zones Smarter: Data-Driven Decision Making

In honor of Work Zone Safety Awareness Week, the NJDOT Bureau of Research hosted a Lunchtime Tech Talk, “Making Work Zones Smarter: Data-Driven Decision Making” on April 11th.  Dr. Thomas M. Brennan from The College of New Jersey discussed his research using probe vehicle data – that is, anonymous vehicle speed data — to inform the development of work zone mobility performance measures and “Smart Work Zone” congestion management strategies.

Dr. Brennan described how probe vehicle data can be applied to work zone planning.

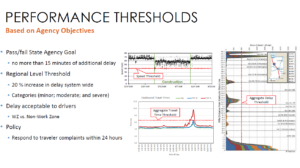
An important goal of Dr. Brennan’s research has been the development of mobility performance measures that align with the transportation agency’s goals to improve reliability and speeds and diminish delays, queuing, and user costs.   In his talk, Dr. Brennan demonstrated how probe vehicle data collected from a public agency or commercial vendor can be converted from its raw form into mobility performance measures and compelling visualizations for decision-makers to use in formulating appropriate work zone policies and procedures.

He outlined a case study design framework and the steps needed for analyzing work zone effects on mobility performance measures. He described the types of information needed to conduct a work zone mobility audit, including traffic flow and work zone activity data. Using anonymous vehicle speed data, information about traffic slowdowns within the designated area can be gathered.   With enough data points stored over time – and with the appropriate performance measures and visualizations – it is possible to evaluate whether a work zone is increasing congestion as a result of the roadway system, as a result of the type of construction being undertaken, or some combination of both.

Dr. Brennan described the research he has performed in work zones in both Indiana and New Jersey, including an example of road closures of Route 80 in New Jersey. He found that, by gathering speed data alone, one could make an informed observation on when road work was being done and the effects on the surrounding road system. The data measured the impacts of work zones before, during, and after a project’s completion, showing the total “life-cycle” effect of a work zone.

Dr. Brennan noted several types of decisions that state agencies must make to implement a data-driven approach to work zone management.   For example, state agencies will need to select the types of work zones to apply the information, determine appropriate performance measures, define appropriate criteria for “congestion” thresholds, establish the right level of geographic detail and frequency for monitoring and measuring performance, and identify strategies to manage poorly performing work zones.  High-level agency strategies must also be put in place for efficiently archiving the various data that is collected, defining appropriate agency-wide performance measures and standards, and whether to incentivize contractors based on mobility performance measures, among other considerations.

Visualization of performance thresholds for speed, delays travel times.

During the course of the talk, Dr. Brennan highlighted various ways in which probe vehicle data can be used to characterize the reliability, resiliency and congestion at the regional and granular level to inform work zone planning. He hopes to use traffic flow data and work zone activity data to develop a comprehensive guide on how best to predict future congestion. Such data would combine the type of work zone (e.g., lane closures, patching, ramp closures, etc.) with archived data showing how previous similar events had affected the road system. This information could be used to provide agencies with alternative designs for future work zones, and provide drivers with alternative routes, thereby improving the safety and capacity of a work zone for workers and travelers alike.

Resources

Brennan, T. (2019).  Making Work Zones Smarter: Data Driven Decision Making (Presentation)

Brennan, T. M., Venigalla, M. M., Hyde, A., & LaRegina, A. (2018). Performance Measures for Characterizing Regional Congestion using Aggregated Multi-Year Probe Vehicle Data. Transportation Research Record, 2672(42), 170–179. https://doi.org/10.1177/0361198118797190

Remias, S., T. Brennan, C. Day, H. Summers, E. Cox, D. Horton, and D. Bullock (2013). 2012 Indiana Mobility Report: Full Version.  https://docs.lib.purdue.edu/imr/4/


Orthotropic Bridge Deck Design

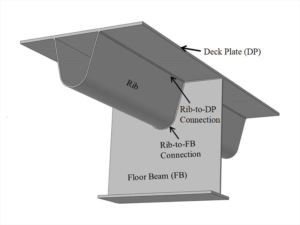
Steel orthotropic deck

On July 9th, Dr. Sougata Roy discussed the benefits of using orthotropic bridge decks, focusing on their design, fabrication, and construction. He addressed a room of NJDOT employees, highlighting significant projects that have utilized orthotropic bridge decks, including the first such bridge designed by NJDOT.

An orthotropic bridge deck is one in which a steel deck plate is supported by longitudinal ribs and transverse crossbeams. The ribs and crossbeams give the deck different stiffness in the transverse and longitudinal directions, allowing it to distribute weight effectively.

Dr. Roy first posited the advantages of using these bridge decks, emphasizing their light weight and structural efficiency, and their estimated life span of over 100 years. Orthotropic bridge decks are lighter due to the reduced need for concrete, which minimizes the total dead load carried by the rest of the structure. Estimates are that up to 25 percent of a bridge’s total mass can be saved by reducing the deck weight, and those weight reductions can extend to cables, towers, piers, and so forth. Orthotropic decks are prefabricated and their modular form allows for accelerated bridge construction and higher quality control. The bridges can be erected more quickly, thus minimizing the impact on New Jersey’s motorists. The maintenance requirements for orthotropic bridges are expected to be much lower as there would be no need to re-deck the bridges every few decades. While Dr. Roy acknowledged that there are high initial construction costs associated with orthotropic bridges due to the complex welds involved, such costs would be offset by the lower maintenance costs over the life of the bridge.

Dr. Roy suggested that the orthotropic bridge deck design could help address some of the state’s greatest transportation infrastructure needs related to bridge condition, maintenance, as well as overall traffic congestion. To demonstrate this, Dr. Roy used data from the Route 7 Wittpenn Bridge between Kearny and Jersey City, which is the first bridge constructed by NJDOT to use an orthotropic bridge deck.

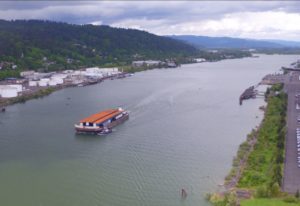
Bridge deck in transit to New Jersey

The 300-foot deck was shipped in one piece via the Panama Canal from Portland, Oregon and arrived at the Wittpenn Bridge in July, 2017. For an illustrated depiction of the Wittpenn Bridge deck’s trip to Kearny, see Oregon to New Jersey: The Journey of New Jersey Department of Transportation’s First Orthotropic Deck.

The current work on the bridge is proceeding quickly as the steelwork for the bridge is less impacted by cold weather than a typical concrete bridge deck would be. The new bridge will be twice as high as the current Wittpenn, and will feature wide lanes and shoulders.

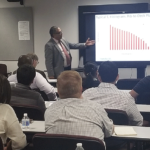
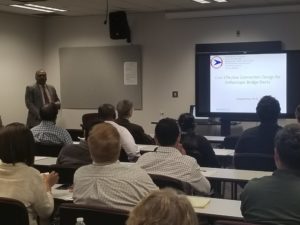
Dr. Sougata Roy presents Cost Effective Design for Orthotropic Bridge Decks

For related information, please view the report, Design and Fabrication of Orthotropic Deck Details. The objectives of the research were to verify the design and fabrication of the orthotropic deck details proposed for the lift bridge, for infinite fatigue life. Multi-level 3D finite element analyses (FEA) of the proposed deck were performed to determine the critical stresses at the connections, the corresponding load position, and the deck specimen. To develop cost-effective connection details, three variations of rib-to-floor beam and rib-to-deck plate connection details, including the influence of different fabrication parameters, were explored in full-scale, small-size mockups. Subsequently, the infinite life fatigue performance of the connection details were evaluated by laboratory testing of a full-scale prototype. The fatigue testing was conducted under simulated rear tandem axle loading of the American Association of State Highway and Transportation Officials (AASHTO) fatigue truck with adequate boundary condition. The prototype testing was runout after 8 million cycles, verifying the infinite life fatigue performance of the deck design.


RABIT: Automated Condition Assessment of Concrete Bridge Decks by Robotic System

Dr. Nenad Gucunski speaking at a recent Lunchtime Tech Talk!

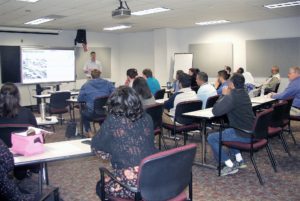
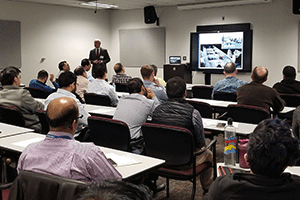
The April 6, 2018 Lunchtime Tech Talk featured Professor Nenad Gucunski, Director of the Center for Advanced Infrastructure and Transportation (CAIT) Infrastructure Condition Monitoring Program and chair of the Department of Civil and Environmental Engineering at Rutgers University. Dr. Gucunski spoke to a full room of NJDOT employees about the benefits of non-destructive bridge evaluation (NDE) technologies, as well as the latest advancements in the field.

The benefits of NDE are many, but ultimately the value is realized by its ability to help bridge owners make better-informed decisions regarding maintenance, repair, and rehabilitation of vital infrastructure.  New Jersey serves as the perfect laboratory for the development of such technologies, given the myriad of aging bridges in the state and the congestion that demands bridge evaluation be done quickly, but as safely as possible. Dr. Gucunski highlighted two of CAIT’s breakthrough platforms to achieve these goals, the RABIT™ and the BEAST.

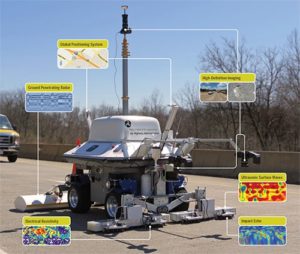
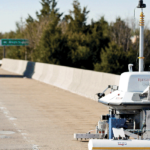
Equipped with ground penetrating radar, GPS, digital cameras, and other instrumentation to measure electrical resistivity and ultrasonic waves, the RABIT™ is a robot that can single-handedly perform in-depth bridge inspections. With these tools, the RABIT™ provides quantitative assessment of concrete bridge decks and presents the data in an intuitive manner with graphs that provide a comprehensive picture of bridge health. According to Professor Gucunski,

the RABIT

The RABIT

“In the past, we didn’t have a way to compile information on delamination, degradation, corrosion, precise location, visual, or load stress data all at once. Not only does RABIT™ help us validate data collected from individual machines, but it forms a meaningful picture of what’s happening inside the bridge deck in real time to help us arrest deterioration.”

This robot not only increases the speed in which data are collected and analyzed, but reduces the cost and traffic congestion associated with doing so. Most importantly, it improves the safety for workers who are no longer required to perform lengthy inspections in high traffic areas. Dr. Gucunski presented the results of various NDE surveys that had been completed by the RABIT™ from around the country, highlighting the demand and efficiency of such technologies. Furthermore the robot is able to not only evaluate the state of bridges, but can also perform minor rehabilitation repairs. When the robot sees delamination occur below the surface, it has the ability to bore a hole into the bridge and flood the cracking with a sealant that NJDOT employee Dr. Giri Venkiteela was instrumental in creating.

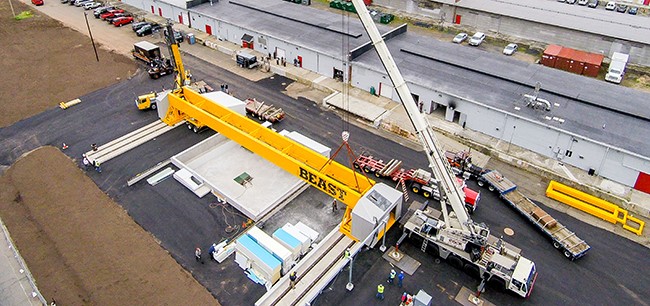
Dr. Gucunski also focused the spotlight on the BEAST, the next level of bridge deck evaluation. While the RABIT™ can be used to evaluate the current bridge inventory through safe and non-destructive means, the BEAST tackles the problem in a different way: by actively speeding up the impact and deterioration of bridges to give researchers a look how bridge systems will fare over in the future. The BEAST tests sample bridge with spans of up to 50 feet long and 28 feet wide using rapid-cycling temperature extremes, simulated precipitation, and a loading device that inflicts the same kind of beating as 24-7 heavy truck traffic. The BEAST “compresses time” and demonstrates decades of deterioration after only a few months. The BEAST offers a unique insight on the future performance of materials and structural components, supplying bridge owners information that could previously only be realized after decades of wear and tear. This technology not only helps with the design of bridges that have not yet been built, but  allows for a better understanding of how current bridges may fail and can identify the best rehabilitation and preservation techniques.

the BEAST

The BEAST

New Jersey’s infrastructure is amongst the oldest in the country, with over a third of our bridge systems deemed structurally deficient or in need of repair. Since it is logistically and financially impossible to repair every single bridge, these two technologies help expand the lifespan and performance of the bridges we have today.

Resources

View the presentation: Gucunski, N. (2018).  RABIT: Automated Condition Assessment of Concrete Bridge Decks by Robotic System

Below is a short video of the RABIT (Robotics Assisted Bridge Inspection Tool) in action (no sound).


Tech Talk Recap: Smart Cities and Transportation with Kenneth Leonard

On February 20, 2018, the fifth event in the Lunchtime Tech Talk series took place and featured speaker Kenneth M. Leonard, Director of the U.S. Department of Transportation Intelligent Transportation Systems (ITS) Joint Program Office. Leonard spoke to a full crowd of attendees including NJDOT personnel. Leonard, a recognized leader in the field of ITS, focused his presentation on the USDOT Smart Cities Challenge and the way connected cities and communities could become “smart”.

The Smart Cities Council has deemed a Smart City to be one that uses information and communications technology (ICT) to enhance its livability, workability, and sustainability. Leonard explained that connected infrastructure technology can support a smart community through such things as connected vehicles, sensor-based intelligent infrastructure, smart grids, data management and urban analytics, among others. He shared an example of components of a connected city, citing that “Transportation is critical to making a city work—in commuting to work, education, entertainment, as well as shipping and receiving products”.

Leonard highlighted the Columbus, Ohio demonstration project where a $140 million investment in Smart Columbus will create the Columbus Connected Transportation Network, which will include integrated data exchange, enhanced human services, and electronic vehicle infrastructure.

Leonard suggests that smart communities produce desired outcomes that include safety enhancements and efficiency in services. The Smart Columbus project has measurable outcomes, such as: enhanced safety through reduced truck accidents, increased mobility through minimized travel times, improved employment opportunity by reaching underserved communities, and improved air quality from reduced truck congestion and increased access to EV charging stations.

Columbus was selected as the 2016 winner of the USDOT Smart Cities Challenge competition, which included the participation of 77 cities nationwide. To read about the Smart Cities Challenge, please visit: https://www.transportation.gov/smartcity

Resources

View the presentation: Leonard, K. (2018). Smart Cities and Transportation.

You can watch a video of the presentation below.

Getting through the Green: Smarter Traffic Management with Adaptive Signal Control

NJDOT Assistant Commissioner for Transportation Systems Management, C. William Kingsland, spoke about Adaptive Signal Control (ASCT) during the third Lunchtime Tech Talk hosted by the Bureau of Research on November 29, 2017.

The Federal Highway Administration (FHWA) defines ASCT as technologies that capture current traffic demand data to adjust traffic signal timing to optimize flow in coordinated traffic signal systems.  FHWA established ASCT as one of its Every Day Counts Round One initiatives in 2011-2012. New Jersey has implemented ASCT through the work of the Traffic Management Systems unit.

Assistant Commissioner Kingsland pointed out that commuters anticipate the time it will take for their typical commute routine and that reliability in travel time is important; people do not like fluctuation in the time it takes to get from A to B. When there is reliability of travel time, people’s expectations are met. ASCT effectively reduces congestion and fuel consumption, thus reducing complaints and frustration.

The ASCT system continuously learns based upon the traffic that is out there and will respond to changes in traffic patterns. Thus, the ability to adapt to unexpected changes in traffic conditions will produce improved mobility through a given area. Furthermore, as connected vehicles become more prominent, the system has the ability to gather information through Vehicle-to-Infrastructure communication and provide timely data of vehicle spacing and signal timing.

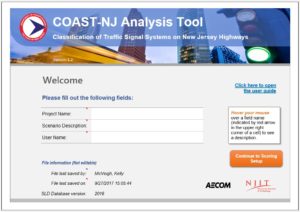
Assistant Commissioner Kingsland also provided some highlights about COAST- NJ, the management system developed by AECOM and the New Jersey Institute of Technology that is used to help decide where the ASCT systems will be placed. Using quantitative analysis, the tool ranks sections of corridors based on severity of congestion, variability of congestion, signal spacing, and traffic volume. COAST -NJ provides a classification system scoring process that encompasses 2,562 signalized intersections, 297 signalized arterial corridors, and 56 signal systems. It was officially released for use in March 2017.

During the Q&A portion of the Tech Talk, a member of the audience asked whether the system retains the collected traffic flow information to be able to look back to a certain date and time. The answer is that yes, it can. The issue, however, becomes length of records retention and where to store all of this information over the long-term.

In NJ, some of the NJDOT project locations with ASCT are along Route 130 (MP 69.79 to 74.51) with 15 intersections tied in; Route 168 (MP 6.79 to 9.72) with 11 intersections; and Route 32 (MP 0.0 to 1.20) with two intersections. Mr. Kingsland noted that Route 18 South in New Brunswick to East Brunswick is about to go online

Other agencies are also implementing ASCT. While not a NJDOT project, in the Meadowlands area there are 140 intersections tied into one ASCT system area managed by the Meadowlands Commission.

Mr. Kingsland was asked if rural areas with large distance between signals could possibly have cameras placed at intermediate sections between intersections. Kingsland replied that they certainly could, but the cost of such projects is prohibitive at this point in time.

Due to popular demand, Assistant Commissioner Kingsland presented this Tech Talk again on January 29, 2018.

Resources

Kingsland, W. (2017). Adaptive Signal Control—Getting Through The Green (Presentation).

CIPGA Works!

The Capital Investment Planning and Grants Administration (CIPGA) Works! Group hosts lunchtime talks on a variety of topics to brief staff on the mission, roles, and responsibilities of operating units.

Recent presentations are available below.

For more information, visit the CIPGA Works! site on NJDOT intranet.

Bicycle & Pedestrian Programs

Bureau of Research

Capital Investment Planning & Development

Capital Program Coordination

Environmental Resources

Freight Services

Local Aid & Economic Development

Maritime Resources

Multimodal Grants, Programs & Aeronautics

NJ State Transportation Innovation Council

Park & Ride Program

Performance Management

Roadway Data & Crash Records Unit

Statewide Planning

Technical Analysis Unit

Traffic & Technology Section

Transportation Data & Safety