
The Justice40 Initiative, referenced in Executive Order 14008, Tackling the Climate Crises at Home and Abroad, is a key element in the U.S. Department of Transportation (USDOT) efforts to recognize and address long-standing patterns of under-investment in disadvantaged communities. The Initiative seeks to deliver resources to communities that have been disproportionately burdened by the adverse effects of climate change, pollution, and environmental hazards.
The Justice40 Initiative seeks to understand persistent gaps in infrastructure investment and public services and remedy disparities by working toward the goal that at least 40 percent of the benefits from many grants, programs, and initiatives will flow to disadvantaged communities. Through this Initiative, the USDOT will encourage the nation’s transportation agencies to plan and prioritize projects that will benefit rural, suburban, tribal, and urban communities facing barriers to affordable, equitable, reliable, and safe transportation.
USDOT has developed tools that practitioners and decision makers can use to become better informed on how their state or region’s communities may experience persistent disadvantages. With this information at-hand, agencies are called upon to advance projects to address or mitigate the causes of these disadvantages and improve the conditions within these overlooked communities to promote livability and economic prosperity.
Equitable Transportation Community Explorer
The USDOT’s Equitable Transportation Community (ETC) Explorer, an interactive web application, explores the spatial patterns of cumulative burden experienced by communities. The ETC Explorer examines five components: Transportation Insecurity, Climate and Disaster Risk Burden, Environmental Burden, Health Vulnerability, and Social Vulnerability. See Table 1 for definitions of each of the underlying components.
Table 1. Definitions for the Disadvantage Components of ETC Explorer
| Components | Definitions |
| Transportation Insecurity | Transportation Insecurity occurs when people are unable to get to where they need to go to meet the needs of their daily life regularly, reliably, and safely. |
| Environmental Burden | The Environmental Burden component of the index includes variables measuring factors such as pollution, hazardous facility exposure, water pollution and the built environment. |
| Social Vulnerability | Social Vulnerability is a measure of socioeconomic indicators that have a direct impact on quality of life. |
| Health Vulnerability | The Health Vulnerability category assesses the increased frequency of health conditions that may result from exposure to air, noise, and water pollution, as well as lifestyle factors such as poor walkability, car dependency, and long commute times. |
| Climate and Disaster Risk Burden | Climate and Disaster Risk Burden reflects sea level rise, changes in precipitation, extreme weather, and heat which pose risks to the transportation system. |
These five components inform the development of a composite measure, the Disadvantaged Community Index, that defines census tracts as disadvantaged communities in the U.S. based on multiple dimensions of disadvantage. A score for each disadvantage component comprises several variables and information from several datasets. The index calculates cumulative disadvantage by normalizing the indicators associated with disadvantage, summing the percentile ranks of these indicators into components, and then summing the percentile ranks of the sums of each component to determine an overall score.
Figure 1 provides a graphical representation, including a list of the indicators for each component. The graphic shows how the indicators are used to inform each components score and how standardization techniques and percentile rankings are applied to derive a composite disadvantage score. USDOT considers census tracts to be “disadvantaged” if the overall index score places it in the 65th percentile (or higher) of all US census tracts.
The ETC Explorer Technical Documentation provides greater detail about how the data sources and methods were applied to create the individual indicators and standardize measures of disadvantage. The ETC Explorer relies upon an ArcGIS platform tool to observe spatial patterns and make comparisons at national, state, regional, and sub-state levels. Additional information is provided on the methodological assumptions and limitations of developing a tool with these capabilities.
The ETC Explorer was designed to complement the White House Council on Environmental Quality (CEQ) Climate & Economic Justice Screening Tool (CEJST). USDOT’s tool looks more deeply at the “Transportation Disadvantage” component of the CEJST, and the ETC Explorer’s Transportation Insecurity component. Both tools were developed to inform analyses and decision making to foster consideration of the transportation-related causes of disadvantage and how they can be remedied, in part, through future USDOT investments.
Past USDOT guidance noted that applicants for discretionary program funding have had the option of using CEJST or ETC Explorer when developing funding applications. State DOTs and Metropolitan Planning Organizations (MPOs) can use the ETC Explorer in developing their Statewide Transportation Improvement Programs (STIPs) and Transportation Improvement Programs (TIPs). USDOT also expects to use ETC Explorer as a consideration in setting policy and making funding decisions. Reference to the tool and how it can be used to consider equity in grant application criteria can be found in recently issued NOFOs.
Justice40 Covered Programs
In August 2022, the White House issued guidance on the breadth of the Federal programs that would be covered by Justice40 Initiative including seven areas of Federal investments covered by the Initiative: climate change, clean energy and energy efficiency, clean transit, affordable and sustainable housing, training and workforce development, remediation and reduction of legacy pollution, and clean water and wastewater infrastructure. In this guidance, USDOT noted that 39 programs, across five modes, totaling more than $204 billion in the Bipartisan Infrastructure Bill, are covered by the Initiative. USDOT indicated that other programs might be added or removed from coverage under Justice40. Table 2 provides a list of USDOT programs covered by Justice40.
Table 2. Justice40 Covered Program List
The Justice40 Covered Program list included 39 covered programs within the U.S. Department of Transportation in August 2022.
Federal Highway Administration (FHWA)
- Carbon Reduction Program *
- Charging & Fueling Infrastructure Grants*
- Congestion Mitigation and Air Quality Improvement Program *
- Congestion Relief Program *
- Disadvantaged Business Enterprise Supportive Services*
- National Electric Vehicle Competitive Program*
- National Electric Vehicle Formula Program*
- Nationally Significant Federal Lands and Tribal Projects *
- On the Job Supportive Services*
- Promoting Resilient Operations for Transformative, Efficient, and Cost-saving Transportation (PROTECT) (23 USC 176) *
- Protect Grants (23 USC 176(d))*
- Reduction of Truck Emissions at Port Facilities*
- Transportation Alternatives (Surface Transportation Block Grant set-aside) *
- Tribal High Priority Projects Program *
- Tribal Transportation Facility Bridges (Bridge Investment Program set-aside) *
- Tribal Transportation Facility Bridges (Bridge Replacement, Rehabilitation, Preservation, Protection and Construction set-aside) *
- Tribal Transportation Program *
Federal Railroad Administration (FRA)
- Consolidated Rail Infrastructure and Safety Improvements *
- Federal-State Partnership for Intercity Passenger Rail *
- Railroad Crossing Elimination Program *
Federal Transportation Administration (FTA)
- All Station Accessibility Program (ASAP) *
- Buses and Bus Facilities Competitive Program*
- Buses and Bus Facilities Program Formula *
- Electric or Low-Emitting Ferry Program *
- Fixed Guideway Capital Investment Grants (CIG) *
- Low or No Emission Vehicle Program *
- Passenger Ferry Grant Program*
- Innovative Coordinated Access and Mobility Pilot Program *
- Rural Transit Funding Programs (Public Transportation on Indian Reservations Competitive) *
- Transit-Oriented Development (TOD) Planning Program*
Maritime Administration (MARAD)
- America’s Marine Highway Program *
- Port Infrastructure Development Program *
Office of the Secretary of Transportation (OST)
- National Infrastructure Project Assistance (MEGA) *
- Nationally Significant Multimodal Freight and Highway Projects (INFRA) *
- Rebuilding America’s Infrastructure with Sustainability and Equity (RAISE) *
- Reconnecting Communities Grant Program *
- Safe Streets & Roads for All *
- SMART (Strengthening Mobility and Revolutionizing Transportation)*
- Thriving Communities Program
NJ Example Maps
The ETC Explorer offers an interactive dashboard to help users understand how a community or project area experiences transportation disadvantage compared to all other census tracts nationally or statewide across the various disadvantage components and forty indicators. Popup databoxes provide more information on Transportation Insecurity for a selected census tract.
Below are examples of the statewide and local area outputs that can be quickly generated.
ETC Explorer Statewide Dashboard for New Jersey. The dashboard highlights that “Disadvantaged Census Tracts” comprise 17 percent of all the Census Tracts statewide and that 1.3 million persons live in these census tracts. In this example, Environmental Burdens are displayed and indicate that they are more prevalent in NJ than other components of disadvantage. Among the individual indicators of environmental burden that rank relatively highly and exceed the threshold for “disadvantage” are Diesel PM Levels, Hazardous Sites Proximity, and Impaired Surface Waters (see Figure 2A).

DOT Disadvantaged Census Tracts – National and State Results. The ETC Explorer can be used to display the DOT Disadvantaged Census Tracts based on a nationwide comparison (see Figure 2B) or on a statewide basis (see Figure 2C). The state results map shows additional areas that meet a disadvantaged threshold than are identified in the national results map. This is particularly useful for identifying the locations and spatial distribution of these highly-disadvantaged tracts in New Jersey.
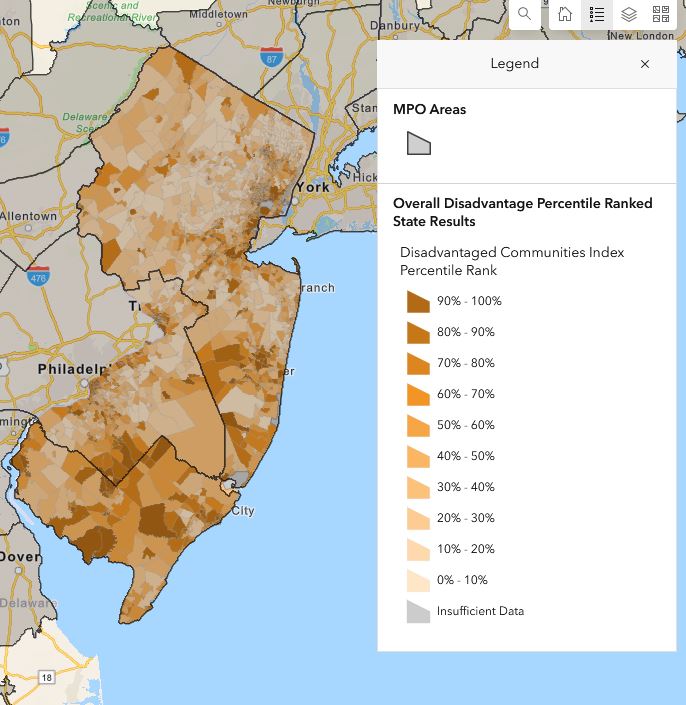
Overall Disadvantage Percentile Ranked State Results. This statewide map shows percentile rankings of disadvantage by census tract for the three MPO regions (see Figure 2D). The gradient mapping display offers more information than the simpler binary designations.
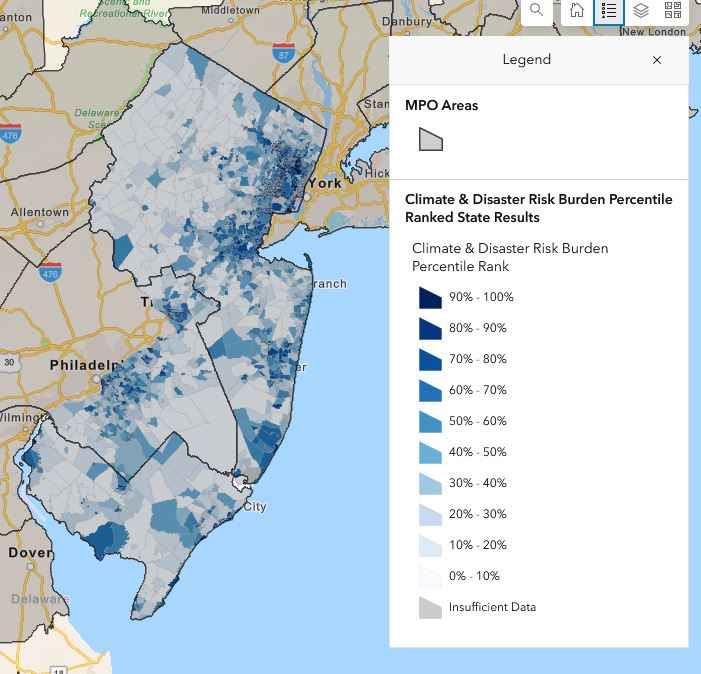
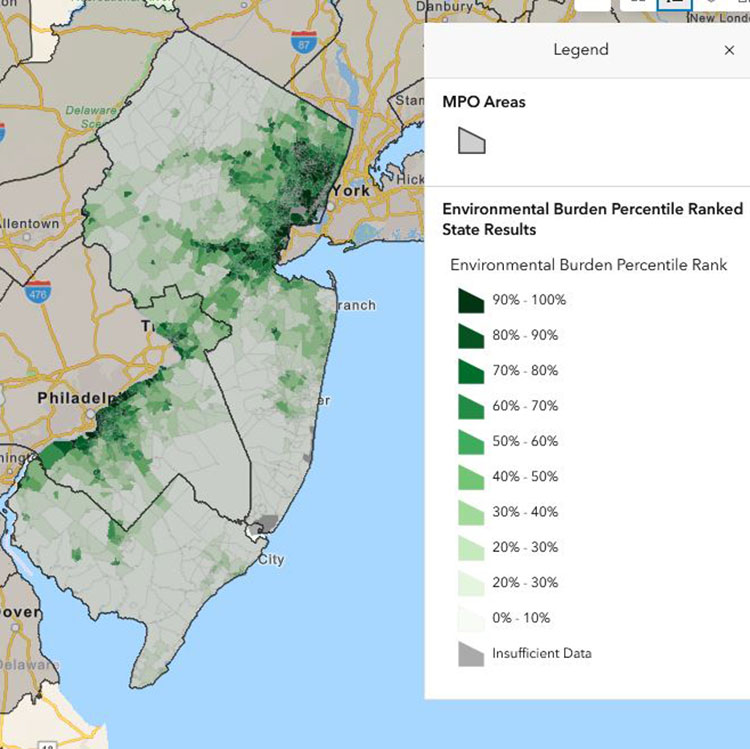
Disadvantage Components, Percentile Ranked State Results. Data on the individual underlying components of disadvantage can be mapped to show the percentile rankings within the state. Examples of statewide maps displaying the census tracts that are more and less affected by Environmental Burden (Figure 2E) and Climate and Disaster Risk Burden (Figure 2F) are shown.
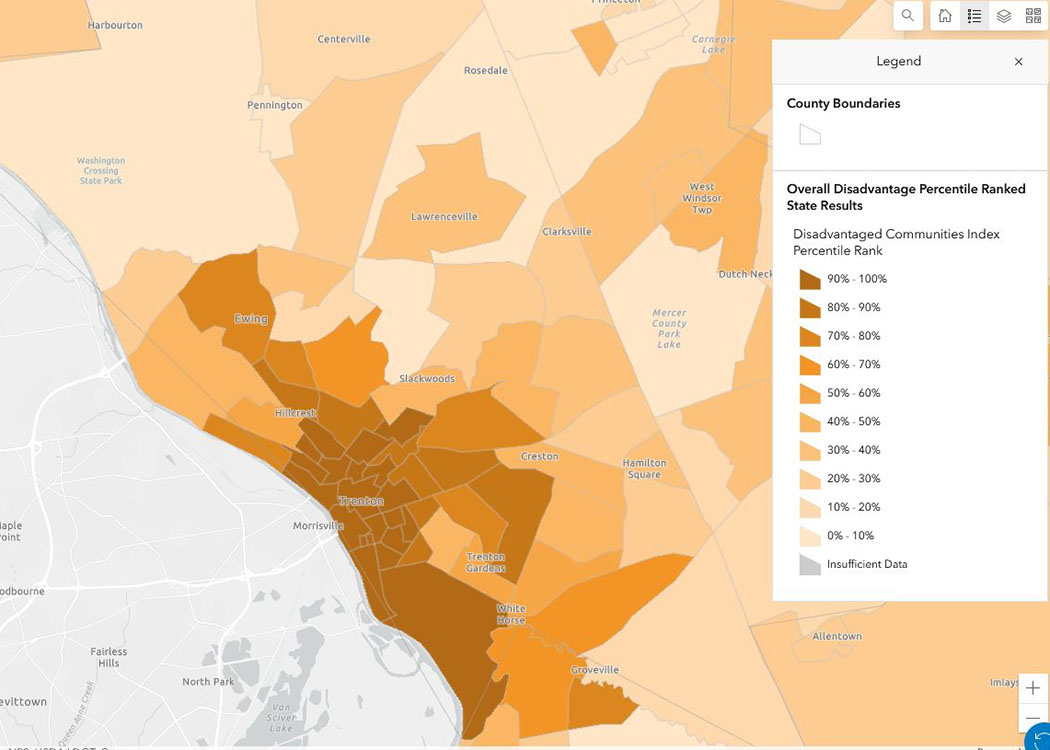
Overall Disadvantage Percentile Ranked, State Results, Community Analysis Example. The ETC Explorer on the online ArcGIS platform permits analysis of sub-areas of the state. In Figure 2G, the City of Trenton and environs are examined for Overall Disadvantage in a percentile ranking map.
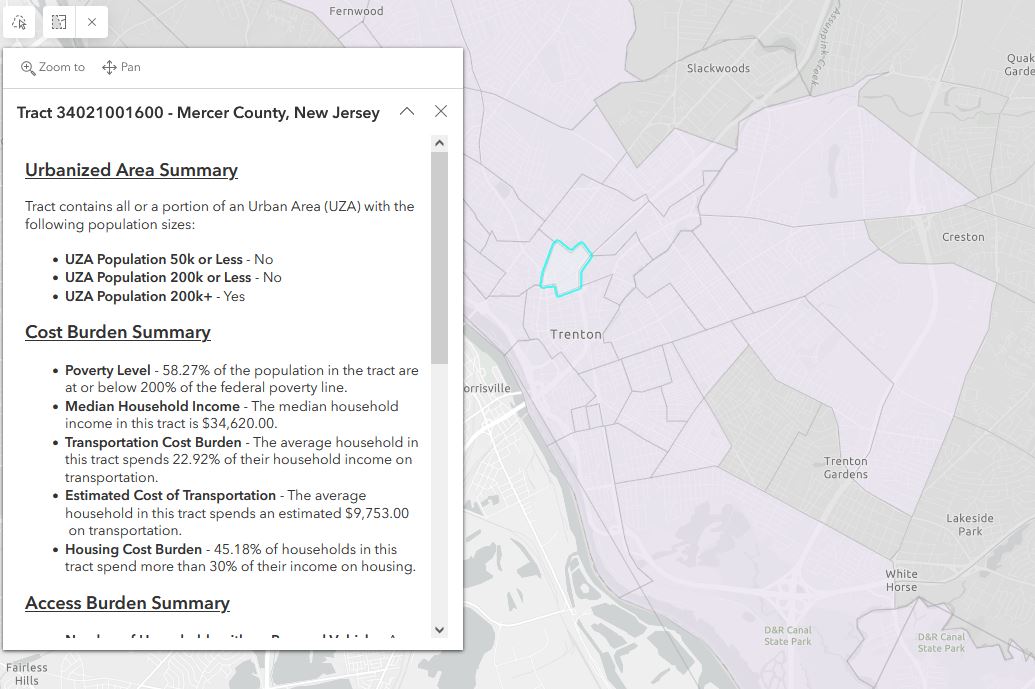
Transportation Insecurity Features. The ETC Explorer tool permits closer inspection of its various data elements. In Figure 2H, a small portion of a popup databox is shown for a selected census tract in Trenton that provides a snapshot of Transportation Insecurity indicators. When fully displayed, the popup databox displays summary and the underlying insecurity feature indicators for “Cost Burden,” “Access Burden,” and “Safety.”
Justice40 is More than a Desktop Exercise
The ETC Explorer is an important tool for identifying the underlying components of disadvantage, but achieving the objectives of Justice40 will require more than desktop exercise. USDOT emphasizes that agencies and practitioners should be cognizant of the Three Major Components of DOT’s Justice40 Initiative as they work to plan, design, program, and deliver projects. They include understanding:
- The needs of a community through meaningful public engagement
- How a community is affected by lack of transportation investments and options
- What benefits a project may create, who will receive these benefits, and how these benefits will lessen the effects of the disadvantage of the community in question
Ongoing challenges exist in building capacity and preparing transportation agencies, eligible nongovernmental organizations (NGOs), and affected communities for applying for and utilizing the project funding offered by the Bipartisan Infrastructure Bill. In a recent research brief, the Urban Institute distilled observations from interviews with representatives from agencies and NGOs on their pressing needs and how to address the varying capacities of applicants to secure discretionary grant infrastructure funding. Among the topics covered, the interviews shared insights on the challenges of facilitating meaningful community engagement, contending within the application cycle, and managing relationships within the local ecosystem.
Recognizing the capacity challenges and moving toward a more equity-centric vision for project funding, USDOT established the Thriving Communities Program to provide planning, technical assistance, and capacity building support. The first round of funding awards, announced in April 2023, included funding for teams of Capacity Builders.
The City of East Orange, in partnership with the City of Orange Township and Housing and Neighborhood Development Services, Inc. (HANDS), was among the communities awarded project funding for capacity building support. They hope to address key challenges and needs disproportionately borne by low-income and minority populations in both cities due to the construction of Interstate 280 and Freeway Drive in the 1960s that led to detrimental safety, economic development, livability, housing, connectivity, and mobility effects for the affected communities. They would like to enlist the capacity builders to “assist the cities in working with state and regional transportation partners to advance a set of improvements to bridges, roadways, and other transportation infrastructure.”
Similarly, USDOT established a Reconnecting Communities Institute (RCI) to deliver training and technical assistance to build organizational or community capacity in transportation planning and formulate innovative strategies for communities previously divided by transportation infrastructure. The BiL created a new $1 billion Reconnecting Communities Pilot Program (RCP), and the Inflation Reduction Act (IRA) created a similar $3.15 billion Neighborhood Access and Equity Program (NAEP) to fund projects that will retrofit, remove or remediate infrastructure that cause barriers and other harmful impacts that isolate and separate neighborhoods and communities. Both programs offer planning grants, capital grants, and technical assistance, and a combined Reconnecting Communities and Neighborhoods (RCN) notice of funding opportunity (NOFO) was recently issued. USDOT has indicated that enrollment into the RCI will be open to States, local and tribal governments, MPOs, and NGOs. Disadvantaged communities are expected to be prioritized for enrollment in the RCI.
RESOURCES
Axelrod, A., Boyd, C., Fu, S., Ramos, K., and Balakrishnan, C. (2022). Lessons from Local Leaders: How Federal Agencies Can Help Ensure Data-Driven and Equity-Centric Infrastructure Investments. Urban Institute. Accessed here: Link
Boutros, A., Resler, K., and Field, S. (2023). Integrating Equity into Transportation Funding and Project Prioritization. Public Roads – Spring 2023. Vol. 87 No. 1. Publication Number: FHWA-HRT-23-003. Accessed here: Link
U.S. Department of Transportation (2023). Equitable Transportation Community (ETC) Explorer, Website. Accessed here: Link
U.S. Department of Transportation. (2023). Equitable Transportation Community (ETC) Explorer, User Guide. Accessed here: Link
U.S. Department of Transportation. (2023). Equitable Transportation Community (ETC) Explorer, ETC Explorer Technical Documentation. Accessed here: Link
U.S. Department of Transportation. (2023). Equitable Transportation Community (ETC) Explorer National Results Dashboard. [Video], Accessed here: Equitable Transportation Community Explorer Video
U.S. Department of Transportation. (2023). Equitable Transportation Community (ETC) Explorer, User Guide. Accessed here: Link
U.S. Department of Transportation. (2023). FY 2022 Thriving Communities Program: Selected Capacity Builder Profiles. Access here: Link
U.S. Department of Transportation. (2023). Calculating Percentage of Population in Underserved Communities for SS4A. Access here: Link
Executive Office of the President. (January, 2021). Executive Order 14008, Tackling the Climate Crisis at Home and Abroad. Accessed here: Link
Executive Office of the President. (August, 2022). Justice40 Initiative Covered Programs List. Accessed here: Link
Zhao, L., Huynh, N., and Hawkins, J. Framework for Quantifying Benefits to Disadvantaged Communities: Application to Nebraska’s National Electric Vehicle Infrastructure (NEVI) Plan. Funded Project. Accessed here: Link.