New Jersey Department of Transportation, alongside other state and regional agencies, has embarked on ambitious initiatives to revolutionize its transportation fueling infrastructure through the National Electric Vehicle Infrastructure (NEVI) Deployment and through pursuit of Greenhouse Gas (GHG) emissions reduction target goals. These initiatives are rooted in the state’s commitment to the 2019 New Jersey Energy Master Plan, the New Jersey Global Warming Response 80x50Act, the 2022 Inflation Reduction Act, and the 2021 Federal Infrastructure Investment and Jobs Act, among other state and federal initiatives, to encourage electric vehicle (EV) adoption and cut transportation-related emissions, marking critical steps towards New Jersey’s climate goals.
We recently spoke with Megan Fackler, Director of Statewide Planning and Sudhir Joshi, Manager of Statewide Strategies from the New Jersey Department of Transportation (NJDOT) to learn more about NJDOT’s ongoing activities for advancing these two initiatives. Their involvement in the planning for NEVI Deployment and the Every Day Counts (EDC-7) innovation, “Integrating GHG Assessment and Reduction Targets in Transportation Planning,” place them at the heart of the NJDOT’s carbon reduction efforts. This interview has been condensed and edited for clarity.
NEVI Deployment Challenges and Strategies
Q: What has NJDOT been doing to advance NEVI Deployment since Plan acceptance in 2023?
A: The National Electric Vehicle Program is a program from the Joint Office of Energy and Transportation, delegated to the Federal Highway Administration. NJDOT is going to deliver this program in New Jersey.
At NJDOT, our approach has focused significantly on federally mandated stakeholder engagement on a statewide basis. Our traditional outreach, utilizing project-specific and countywide approaches, was adapted to address the breadth of the state-led, statewide initiative. This entailed actively involving various community groups, small business leaders, partner agencies, utility providers and other private industries. We have utilized various channels such as public information centers, social media, and weekly emails.
Our team coordinated with every level of our Department to prepare for our larger meetings with external stakeholders. We have had a lot of discussions internally with our subject matter experts, who have helped develop our approach to contract procurement that incorporates the comprehensive criteria outlined in the NEVI guidelines and ensures contractors are complying with state guidelines as well.
We put on a pre-bid conference on October 17, 2023 that explained the range of requirements that the awarded contractor must fulfill. We have sought to ensure contractors understood that they would need to comply with federal and state standards. For example, chargers must be accessible within 1 mile of New Jersey’s Alternative Fuel Corridors and provide a convenient, reliable charging experience for all users.
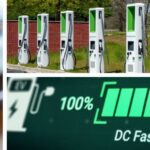
In developing our approach, NJDOT has decided to assign a single contractor to manage an EV charging site’s full range of compliance, with priority given to DC fast chargers. A DC Fast Charge operates on a voltage of 208 to 480 volts three phase alternating current — this is not a circuit you would likely have in your home. In 20 to 30 minutes of time, the DC fast charge should deliver 80 percent of a full charge of the vehicle’s battery.
At each of the 19 EV charger stations development zones along New Jersey’s Alternative Fuel Corridors, a 4-charger station will be provided, with each of the EV chargers capable of providing simultaneous charging at 150 kilowatts. Each charger will be equipped with a Combined Charging System and a North American Charging Standard, also known as the Tesla, port.
Contractors were informed about site selection responsibilities, environmental review documentation, and the necessity for agreements with site hosts and utility providers. The contractor will choose the locations of the 19 proposed sites and will provide one comprehensive environmental review applicable to all sites. The Department also stressed the importance of planning, design, and maintenance to ensure a high-quality user experience, requiring contractors to have the proper reporting mechanisms in place to monitor satisfaction and usage. There were additional discussions on revenue opportunities, and the inclusion of disadvantaged business enterprises.
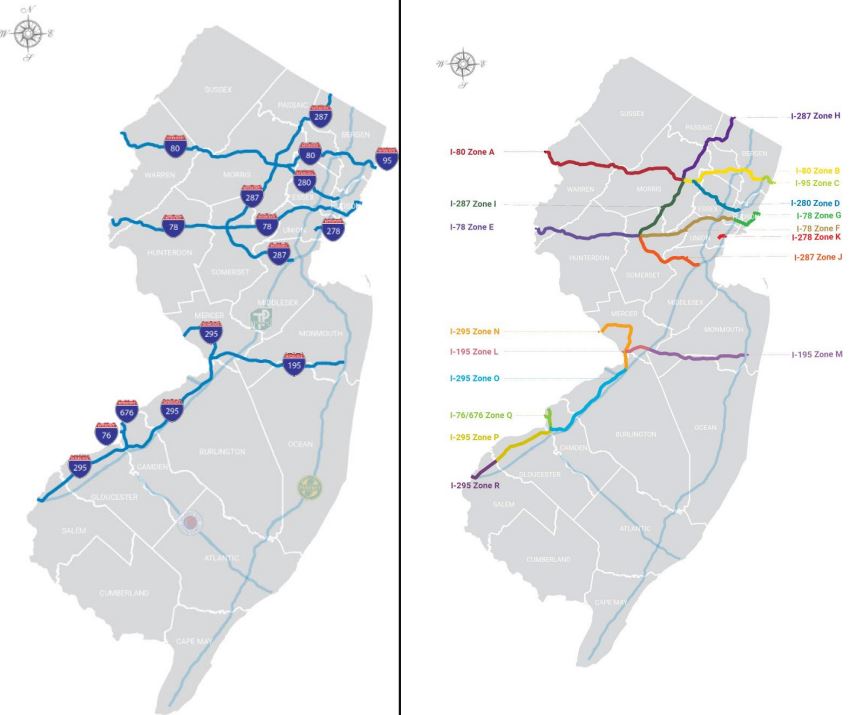
NJ Alternative Fuel Corridors (AFCs) and Direct Current Fast Charger Development Zones were shared at NJDOT’s Virtual Public Information Center sessions.
In our pre-bid meetings, we have emphasized several other requirements that an award must encompass, such as the ensuring that traditionally underserved communities are included. The awarded contractor will need to submit: a Justice40 Plan detailing benefits and impacts on overburdened communities; a workforce development plan geared to this new technology including recruiting efforts toward underrepresented groups; and other documentation that commits to monitoring and upgrading chargers over a period of 5 years of required maintenance.
Additionally, contractors must hire pre-qualified personnel such as a NJ-licensed Professional Engineer who will design the station, before an entity installs the actual chargers. Electricians must be pre-certified by the Electric Vehicle Infrastructure Training Program (EVITP) or complete an apprentice program approved by US Department of Labor.
Following the planning and installation of DC fast chargers, contractors are also required to operate and maintain the station. For example, contractors are required to ensure that their charging stations remain operational and accessible for at least 97 percent of the time over the course of each year. These standards emphasize that trained personnel are crucial to the success of the program.
We are planning to issue and advertise an RFP in 2024 and begin issuing the first awards. Projects on the NJ Turnpike and Garden State Parkway will be handled separately from this Alternative Fuels Corridor procurement.
Q: What are some of the challenges in achieving the goals of the NEVI Deployment Plan?
A: We must ensure that we align our internal schedules to federal timelines, while also ensuring compliance with the program’s equity and environmental goals and requirements. Other challenges include coordinating with utility providers in a timely manner and including them in pre-bid discussions with contractors. In all of this, our team is also prioritizing stakeholder feedback and accounting for their feedback in our analysis.
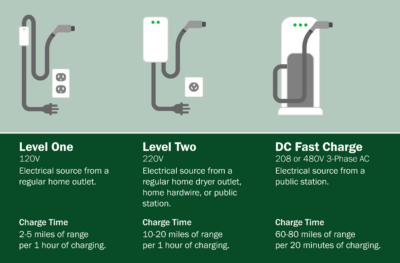
Electric vehicle chargers by type and level. NJDOT will focus on first deploying DC Fast Chargers. Source: Union County, NJ.
It is important to recognize that FHWA did not define for NJDOT how best to achieve the NEVI plan’s deployment goals. For example, it was unclear when we first started thinking about the project whether it made more sense to hire a single contractor to oversee the project – soup to nuts, or to break the project into contracts for different parts. The Department worked with the FHWA to develop a specific approach that supports EV charger implementation in New Jersey.
Q: What types of in-house technical expertise, knowledge, skills, and/or abilities will NJDOT need to have to aid in successful implementation of EV and larger carbon reduction goals?
A: NJDOT’s in-house capabilities are focused on two main areas of expertise: contracting and environmental compliance. First, the Division of Project Management, in conjunction with our Division of Procurement, specializes in various construction and non-construction contract types. Their policies and procedures guide NJDOT staff to ensure that all contractual aspects are timely managed.
Second, the Environmental Division plays a crucial role in addressing environmental compliance and specific site needs. These internal resources, combined with external consultants, form the backbone of NJDOT’s strategy for advancing its carbon reduction goals, and NEVI in particular.
In addition, NJDOT anticipates and prepares for future aspects of NEVI, such as inspection and maintenance requirements of EV charging stations. It is possible that inspection tasks may be outsourced as a result.
NEVI Stakeholder Engagement
Q: How are you facilitating community engagement and awareness about the NEVI Program? What are the major challenges in engaging with local government and other affected stakeholders.
A: NJDOT has implemented a few initiatives. Our outreach was mainly a success with a few key challenges. We initially encountered some skepticism from stakeholders in terms of the locations for charger sites and EVs in general. We have worked hard to maintain a robust community engagement process statewide that satisfied federally mandated outreach guidelines. This includes our Virtual Public Information Center (VPIC) sessions and online resources, which generated thousands of views and hundreds of comments.
With a focus on equity, we identified broad stakeholders from previous working groups and through our legislative partners. The Department leveraged our partnerships to help raise awareness of our engagement sessions. The goal of the VPIC sessions was to reach representatives of diverse groups, provide NEVI Program information relevant to New Jersey, and allow for individuals to comment back to the Department in ways convenient for them.
Workforce Readiness/Equity and NEVI Deployment
Q: What steps is NJDOT taking to ensure workforce readiness and environmental justice for the NEVI Program?
A: Our role principally involves conveying expectations and setting specifications for contractors. These specifications, among others, includes abiding by EVITP requirements, or an approved apprenticeship program for hiring skilled staff familiar with EV technologies. The contractor will be responsible for training and ensuring that the workforce is equipped with the necessary skills, particularly for deploying DC Fast chargers. These requirements also apply to the subcontracting process as well, where partnering with Disadvantaged Business Enterprises (DBEs) is highly encouraged.

FHWA’s framework to ensure equitable recruitment from underserved groups.
In recent years, the Department has been making a huge shift toward workforce development, such as with our investment in the Bordentown Training Center. This is an ever-evolving topic of conversation for us at NJDOT on how we can carry out our “commitment to communities” – whether it is speaking at the community colleges or opening the doors of training facilities for local municipalities. While there is nothing concrete at this time, I definitely could see EV charging maintenance integrated into the training center in the future should such support from NJDOT be needed.
We also have strategies to monitor progress towards our environmental justice goals, such as leveraging various tools and mapping technologies and producing the Community Engagement Outcomes Report (FHWA Approval of NJ NEVI Plan, 2023). The contractor’s role will be pivotal in this regard, as they will be tasked with effectuating Justice 40 initiatives and addressing environmental justice considerations in their operations.
EDC-7 Innovation and Greenhouse Gas Assessment
Q: How does NJDOT’s Carbon Reduction Strategy align with the NEVI Deployment Plan, and what steps are being taken to work with MPOs on this initiative?
A: NJDOT is taking specific steps that align with the goals of the NEVI Deployment Plan, including expanding the EV infrastructure at interstates, and then branching into more local areas. NJDOT’s Carbon Reduction Strategy directly supports the goals of reducing emissions established by Governor Murphy and President Biden. The strategy aims to meet the Governor’s mandate of 80 percent reductions by 2050, and President Biden’s goal [of carbon neutrality by 2035], through strategies aligned with the NEVI Deployment Plan.
NJDOT is working alongside its MPOs and NJ Transit partners to set and meet the FHWA’s recently issued rules on greenhouse gas emission targets. This includes coordinating regularly with MPOs to set greenhouse gas targets, share data on emissions metrics, and develop standardized methodologies for assessing reductions. This involves sharing data on VMT (vehicle miles traveled) and fuel usage to establish state benchmarks. The MPOs will have six months from the FHWA’s February 1st deadline to determine whether to adopt the state’s GHG targets or their own. We will be meeting with the MPOs in the coming week regarding these details. To that effort, NJDOT may leverage a single consultant funded through federal grants to help unify this process across the MPO regions. The department is poised to submit their final targets to FHWA, with the intention to make these documents public, ensuring transparency and community involvement.
The Carbon Reduction Strategy was in progress since December 2022, when the Carbon Reduction Working Group began the review process. This included developing strategies over the course of Winter and Spring 2023, in addition to resolving concerns brought forth by our leadership. Following our November 15th submission, FHWA will have 90 days to approve or deny the draft plan. (NJDOT CIA Team Planning & Environment Presentation, 2023)
In addition to deploying EV charging stations in line with our NEVI goals, NJDOT is exploring electrifying its own fleet and operations with technologies like electric garbage trucks. However, as we have seen this winter, concerns around reduced EV range and long charging times during cold winter temperatures could affect adoption goals if improvements in technologies do not continue. Regardless, all plans, targets, and strategies, in collaboration with MPOs, will undergo review and approval by FHWA. This process aligns with DOT’s recent guidelines for greenhouse gas reduction.
Resources
EV Infrastructure & Policy
New Jersey Department of Transportation. (2023). “NJ Approval Letter for EV Deployment Plan.” Retrieved from https://www.fhwa.dot.gov/environment/nevi/ev_deployment_plans/nj-approval-letter-fy24.pdf.
New Jersey Department of Transportation. (2023). NJDOT Electric Vehicle Infrastructure Deployment along New Jersey Alternative Fuel Corridors: Pre-bid Meeting Presentation. Retrieved from https://www.nj.gov/transportation/contribute/business/procurement/ConstrServ/documents/NJDOTNEVIPreBidMeetingOct172023PresentationRev.10-20-23.pdf
New Jersey Department of Transportation. (2022). “NEVI Program Overview.” Retrieved from https://dep.nj.gov/wp-content/uploads/drivegreen/pdf/nevi.pdf
U.S. Department of Transportation, Federal Highway Administration (n.d). National Electric Vehicle Infrastructure Formula Program, Fact Sheet. Retrieved from https://www.fhwa.dot.gov/bipartisan-infrastructure-law/nevi_formula_program.cfm
U.S. Department of Energy, Alternative Fuels Data Center. (n.d). Electric Vehicle Charging Stations. Retrieved from https://afdc.energy.gov/fuels/electricity_stations.html
Carbon Reduction Efforts
Federal Register (2023). 23 CFR Part 490. National Performance Management Measures; Assessing Performance of the National Highway System, Greenhouse Gas Emissions Measure, Federal Highway Administration. Retrieved from https://www.govinfo.gov/content/pkg/FR-2023-12-07/pdf/2023-26019.pdf
New Jersey Department of Transportation. (2023). CIA Team – Planning & Environment: Discussions on National Performance Management Measure (GHG). Presentation by Sudhir Joshi. Retrieved from https://www.njdottechtransfer.net/wp-content/uploads/2023/12/5-Planning.pdf
U.S. Department of Transportation, Federal Highway Administration (n.d). Carbon Reduction Program, Fact Sheet. Retrieved from https://www.fhwa.dot.gov/bipartisan-infrastructure-law/crp_fact_sheet.cfm
Environmental Justice and Equity
Conley, Shannon. Konisky, David M. Mullin, Megan. (2023). Delivering on Environmental Justice? U.S. State Implementation of the Justice40 Initiative. Retrieved from doi.org/10.1093/publius/pjad018.
Argonne National Laboratory. (2022). Using Mapping Tools to Prioritize Electric Vehicle Charger Benefits to Underserved Communities. Retrieved from https://publications.anl.gov/anlpubs/2022/05/175535.pdf
U.S. Department of Energy. (2022). Incorporating Equity and Justice40 in NEVI and Beyond. Retrieved from https://www.energy.gov/sites/default/files/2022-10/Incorporating%20Equity%20and%20Justice40%20in%20NEVI%20and%20Beyond.pdf‘.
Workforce Development and Training
National Governors Association. (2023). Workforce Development in The IIJA, CHIPS, And IRA. Retrieved from https://www.nga.org/publications/workforce-development-in-the-iija-chips-and-ira/.
National Center for Sustainable Transportation. (2022). Workforce Implications of Transitioning to Zero-Emission Buses in Public Transit. Retrieved from https://escholarship.org/uc/item/3jb4b73d.
San Jose State University. (2020). Southern California Regional Transit Training Consortium: Skills Gap & Needs Assessment. Retrieved from https://transweb.sjsu.edu/sites/default/files/1932-Reeb-Southern-California-Regional-Transit-Training-Consortium-Needs-Assessment.pdf.
National Center for Sustainable Transportation. (2018). Emerging Clean Transportation Workforce White Paper. https://www.uvm.edu/sites/default/files/media/Emerging-Clean-Transportation-Workforce-White-Paper12202018.pdf.
Argonne National Laboratory. (2022). Using Mapping Tools to Prioritize Electric Vehicle Charger Benefits to Underserved Communities. https://publications.anl.gov/anlpubs/2022/05/175535.pdf
NEVI Deployment in Other States
Colorado Department of Transportation & Colorado Energy Office (2023). Colorado National Electric Vehicle Infrastructure (NEVI) Plan. https://www.codot.gov/programs/innovativemobility/assets/2023-update-of-colorado-plan-for-the-national-electric-vehicle-infrastructure-nevi-program.pdf.
Michigan Department of Transportation. (2023). Michigan State Plan for Electric Vehicle Infrastructure Deployment 2023 Update. https://www.michigan.gov/mdot/-/media/Project/Websites/MDOT/Travel/Mobility/Mobility-Initiatives/NEVI/FY23-MI-Plan-for-EV-Infrastructure-Deployment.pdf?rev=968c7cbcf92c4b2abb08573f2af0f9f5&hash=409ED1B68C1FBEE6E52E334690405162.
New Hampshire Department of Transportation. (2023). State of New Hampshire Plan For Electric Vehicle Infrastructure Deployment Update No. 1. https://www.dot.nh.gov/sites/g/files/ehbemt811/files/inline-documents/updated-nevi-plan-8-1-2023.pdf.
North Carolina Department of Transportation (2023). North Carolina Plan Update for Electric Vehicle (EV) Infrastructure Deployment Plan. https://www.ncdot.gov/initiatives-policies/environmental/climate-change/Documents/ncdot-electric-vehicle-deployment-plan.pdf.
Washington State Department of Transportation. (2023). Washington State Plan for Electric Vehicle Infrastructure Deployment July 2023 Update. https://wsdot.wa.gov/sites/default/files/2023-09/WSDOT-NEVI-Plan-Update.pdf.