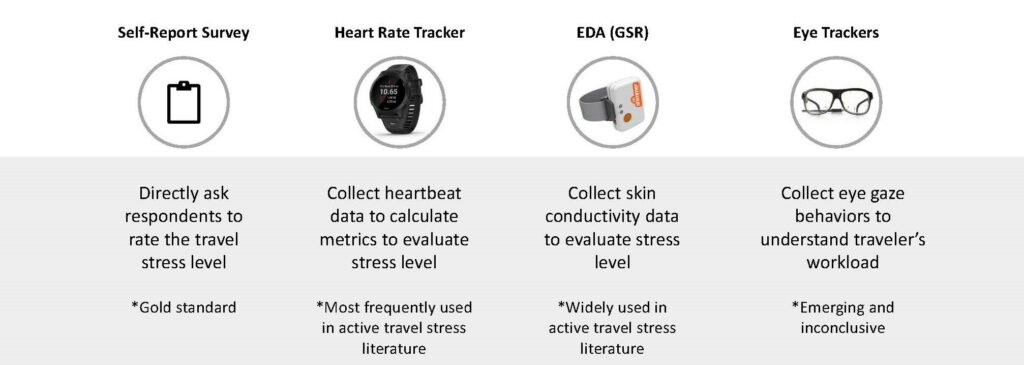
Biometric sensors have long been used in cognitive psychology to measure the stress-level of individuals. These sensors can measure a variety of human behaviors that translate as stress: the movement of eyes, stress-induced sweat, and heart rate variability. Recently, this research strategy has moved beyond psychology and into disciplines like transportation planning, to provide an alternative approach to researching micromobility and stress.
We spoke with Dr. Wenwen Zhang, associate professor at the Edward J. Bloustein School of Planning and Public Policy at Rutgers University, about her experience learning about and using biometrics for a micromobility study. Dr. Zhang’s research, “Rider-Centric Approach to Micromobility Safety” examines the stress levels of micromobility users as they transverse a varied path through an urban space.
Q. How is your research funded?
A. Funding comes from multiple sources. The first source is a seed grant from the Rutgers Research Council which supports an interdisciplinary pilot project. Through this grant, we purchased biometric sensors and hired students to conduct a literature review and develop a research design. We also processed the collected pilot data and paid for participation incentives under this funding. I presented preliminary findings from this study, Rider-Centric Approach to Micromobility Safety, at the 2023 NJDOT Research Showcase. At the time that I presented it, I had 24 samples. The presentation ended up inspiring several people who attended the Research Showcase to volunteer as participants—which increased the sample size to 30.
Our other source of funding came from an external grant from the C2Smart University Transportation Center (UTC) at NYU. We used this resource to support obtaining additional stress sensors, data analysis, cleaning, preprocessing, and modeling, as well as collecting more sample data for the E-scooter and bicycle experiments.
Q. How did you get interested in using biometrics sensors (e.g., eye tracking glasses, galvanic skin sensor, heart rate monitors) to study micromobility safety? How does this research differ from your past work?
A. Before I used biometric sensors, most of my work used passive travel behavior data. For example, to determine the revealed preferences of mode and route choices and risk factors, we used travel trajectory or existing crash big data to develop statistical models. I have found that the entire process is very passive, especially since we only explore risk factors after traffic accidents. It’s surprising that in the research field today we know so little about how human beings actually navigate urban environments while using different travel modes and how it relates to perceived safety. I wanted to explore questions like what is their gaze behavior? How do they feel while they travel using different modes? How do they feel traveling on roads with different design features and how is that going to influence their travel satisfaction or experience overall?
Dr. Robert Noland, Distinguished Professor at the Rutgers Bloustein School, suggested I investigate the use of biometrics in planning studies. As I dug more into the literature, I realized that biometrics in transportation is a very fascinating topic that I wanted to get into. Once I did experiments in the field, I realized that I really enjoyed talking with different people about how they perceive the built environment while they travel. Biometrics provide richer data compared with revealed preference data that I used to work with.
Q. In your research, you noticed that some corridors were more stress-inducing (according to biometric sensors) than expected, despite properly designed safety infrastructure. How do you think this discovery may affect how planners and engineers look at urban road design and micromobility safety?
A. This study collected one-time cross-sectional data. We asked people to walk around an area and tell us whether they feel stressed or not. If they are feeling stress, even in the presence of a safety improvement, it does not necessarily mean that the implemented safety design is not working. For example, in New Brunswick, we observed that a lot of people found it stress-inducing to cross Livingston Avenue, although it has been the subject of a road diet and has several pedestrian safety features incorporated into the new design. While outside our scope of research, one way to understand the impact of the safety infrastructure would be to conduct a “before” and “after” study. This leaves an opportunity for more research, to see how effective the pedestrian-only infrastructure is in reducing stress level. Potentially, it can provide evidence to support pedestrian-only design. Biometric sensors used in a “before and after” study can help us to answer which infrastructure is more preferred.
Q. You are in the process of collecting data for cyclists and e-scooters using the same method, what are your principal objectives in addressing this segment? Do you expect the results to be different?
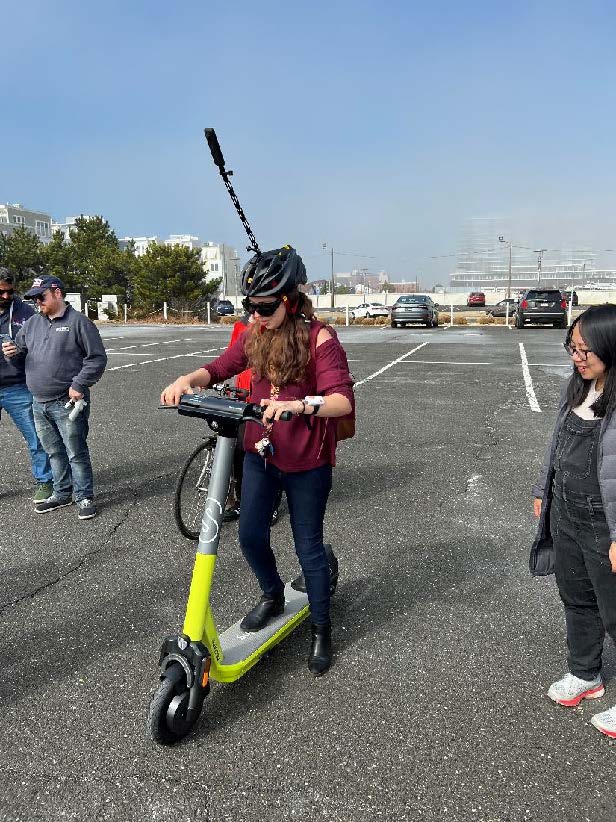
A. Yes, absolutely, different travel modes will likely alter a person’s expectation for a safe travel environment. For example, we noticed a big difference in the enjoyment of pedestrians and e-scooters on the same path through a park. We had thought that the e-scooter users would enjoy the ride as the pedestrians had, however, the pavement was too rough for the small wheels of the e-scooters. Although the park was walking-friendly, it was not friendly for e-scooters. This shows that each of these micromobility modes needs different kinds of support to feel safe and comfortable.
Q. What are the limitations to this study? Do you have plans for future research to address this? How would you like to expand your research in this topic?
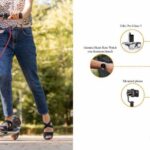
A. Each of the biometric sensors has limitations. For example, eye trackers face some difficulty when identifying the pupils of a participant in direct sunlight. As a result, the eye tracker renders a low eye tracking rate. Eye trackers also work better with darker eyes as the eye movements are more readily recognized. The eye trackers, kept on glasses, also restrict individuals who wear glasses from participating. The unfortunate result of this is that it often excludes a lot of senior people from the experiment. This issue may be alleviated as we are obtaining additional funding to obtain prescription lenses for eye trackers.
GSR sensors use low voltage on skin to measure skin conductivity, which may interfere with electric health devices. This limits individuals from participating if they have an electric health device like a pacemaker on or in their body. We purposefully excluded this population from participating to align with IRB (Institutional Review Board) protocol and to mitigate any risks.
Another limitation of the study is that we must collect sample data one by one, which is a time-consuming process. We can only collect a very small sample compared to a traditional statistical model kind of study, which may have access to thousands of records in the sample. From our literature review, biometrics sensor studies typically involve 20 to 30 participants, but for each participant we have a very rich dataset. For each participating volunteer, we end up with over one gigabyte of data. The limited number of participants may make it harder to generalize results to the entire population, and people may question the results applicability. In some ways this data is similar to the results of qualitative studies, where we have richer information but small sample size, rendering some generalizability issues.
Q. What challenges have you found in working with biometrics sensors, or in the interpretation of output measures?
A. The eye tracker and heart rate measures are reliable, but some biometrics have posed challenges. The GSR (galvanic skin response sensor), which tests your sweat level, is very sensitive to humidity and time of the day. The sensor also picks up on sweat resulting from physical exertion, making it difficult to distinguish between stress-induced sweat and physical sweat.
Interpretation of output measures for this metric requires data cleaning and processing to eliminate the effect of sweating from physical exertion. We try to decompose the data to separate the emotional peak from the sweating caused by physical activity using various algorithms. We are still underway testing out different algorithms to clean up the data. So far, we have found that GSR data are very real-time in nature and a good indicator for stress level but are very noisy data and requires some manual processing. This means we spend a lot of time preprocessing the collected data before conducting data analysis.
Q. How do you expect this research to inform transportation agencies in New Jersey and elsewhere?
A. This type of research captures such rich data on travel behavior itself. Most of the literature using biometrics has been focused on driving, so this research expands the perspective. Here we’re focusing on slow mobility, like active travel and micromobility. Individuals who participate in slow mobility are more vulnerable road users, and we want to see how they behave in different travel environments. This can help agencies gain more insights into how to design safety infrastructure. Beyond that I can also envision the technology being used to evaluate whether certain improvements or infrastructure designs help to improve travel satisfaction or improve people’s experience at the same location by doing “before and after” studies. This type of study also allows you to measure and quantify the effect of the improvement.
The use of biometric sensors in the field can also be used to foster meaningful public engagement processes to show the lived experience of different people in a neighborhood or traveling through a different corridor, which can be very powerful.
Q. Do you feel the research methods are at a stage where they are “ripe” for use on other demonstration projects, planning or project development studies?
A. After one year of experimentation, our project team can readily work with biometrics. We have a good understanding of sensor limitations and how to set up the sensors to correctly reduce noise as much as possible. Our experience has also helped determine what kind of metrics can be extracted successfully and reliably through the sensors.
The most useful case for those sensors is to evaluate before and after, so that we can quantify how much people appreciate those implementations in a more accurate way. Beyond that, the sensors can also be effective infrastructure assessment tools. For example, imagine that you ask people to wear biometric sensors and do a bicycle infrastructure evaluation; the agencies can get more realistic and rich data compared with a more traditional survey approach. This rich data can help determine the most effective improvement. It ends up being more inclusive that way.
The tools can be very useful for fostering community engagement with vulnerable populations. For example, if agencies want to improve the accessibility for wheelchair users, they can ask individuals in wheelchairs to wear the sensors and move about an area. Recording and reviewing how they experience a journey is more powerful compared with just asking individuals with needs about their travel patterns. It’s going to be a more straightforward way to show the world how we can make the streets more inclusive for those vulnerable populations.
Q. Do you think local governments and non-governmental organizations could make use of biometrics sensors as a strategy to promote community engagement and outreach to local communities, or to address specific community safety or livability issues? Would it be cost-prohibitive to employ such tools for such community-based planning issues at this time?
A. From my point of view, the most effective way would be for the agencies to identify where there are needs and promising projects and then work with skilled researchers or practitioners who have these sensors already and have begun to climb the learning curve in the use of sensors and interpretation — for example, they could work with us. They would need to pay for the researchers’ time and participation incentives, or if they were to collaborate with a UTC (University Transportation Center) to conduct such research collaboratively.
The sensors are not the most expensive part of the study. The most expensive item is the researcher’s time to collect and analyze the data. The data are very complicated to analyze in the first place because it’s a large amount of data with noises. The researchers need to put in a lot of time to get it to the state where you can extract the relevant variables out and start to interpret them.
Q. How would you characterize the “state-of-training” in using biometrics for students or early career or mid-career professionals in transportation?
A. The biometric sensor itself is not very new, but new to the transportation field, especially for slow modes. It has been widely used in cognitive psychology, where there are classes to interpret those as well. Generally, I don’t think the current transportation and urban planning curriculum for students includes enough classes to cover those sensors. We probably need to teach not only biometric sensors, but urban sensing in general.
In an ideal course, students could get their hands dirty by putting those sensors in the field and then once the data are collected, they can learn how to preprocess and analyze the data. It would have to be a one-year kind of curriculum design to get people involved and ready for it. Of course, instruction on the use of sensors will differ by topic. For example, if you are working in the air quality field, then there are many different air quality sensors and each of them come with different data formats and require different experiment design and analytic skills.
Regarding the mid-career transportation professional, at this moment I believe the research is more in the academic field and focusing on testing and evaluation. I wouldn’t suggest that the research is so ripe that a mid-career transportation or urban planner professional should need to invest their time in learning how to use biosensors unless they have a research project that may benefit substantially from using the sensors.
Resources
To learn more about the use of biometrics in the field of active transportation, see:
Ryerson, M., Long, C., Fichman, M., Davidson, J.H., Scudder, K.N., Kim, M., Katti, R., Poon, G. & Harris, M., (2021). Evaluating Cyclist Biometrics to Develop Urban Transportation Safety Metrics. Accident Analysis & Prevention, Volume 159, 2021. Retrieved from https://www.sciencedirect.com/science/article/pii/S0001457521003183?via%3Dihub
Fitch, D.T., Sharpnack, J. & Handy, S. (2020). Psychological Stress of Bicycling with Traffic: Examining Heart Rate Variability of Bicyclists in Natural Urban Environments. Transportation Research Part F: Traffic Psychology and Behavior, Volume 70, 2020, Pages 81-97. Retrieved from https://www.sciencedirect.com/science/article/pii/S1369847819304073?via%3Dihub.
To read more on Dr. Zhang’s work, see:
Zhang, W. (2023). Rider-centric Approach to Micromobility Safety. 25th Annual NJDOT Research Showcase. Presentation. Retrieved from https://www.njdottechtransfer.net/wp-content/uploads/2023/11/Zhang-Safety-2nd-Presentation.pdf.
Zhang. W. 25th Annual NJDOT Research Showcase. Recording starts at: 59:00. Retrieved from https://youtu.be/D_rQP-Dv8gU
Zhang, W., Buehler, R., Broaddus, A. & Sweeney, T. (2021). What Type of Infrastructures do E-scooter Riders Prefer? A Route Choice Model. Transportation Research Part D: Transport and Environment, Volume 94, 2021. Retrieved from https://www.sciencedirect.com/science/article/pii/S1361920921000651.
For more information about the use of biometrics in the broader transportation field, see NYU’s C2SMART’s research project on Work Zone Safety: