On May 14, 2025, the NJDOT Bureau of Research, Innovation, and Information Transfer hosted a Lunchtime Tech Talk! webinar, “Research Showcase: Lunchtime Edition 2025”, featuring four presentations on salient research studies. As these studies were not shared at the 26th Annual Research Showcase held in October 2024, the webinar provided an additional opportunity for the over 80 attendees from the New Jersey transportation community to explore the wide range of academic research initiatives underway across the state.
The four research studies covered innovative transportations solutions in topics ranging from LiDAR detection to artificial intelligence. The presenters, in turn, shared their research on assessing the accuracy of LiDAR for traffic data collection in various weather conditions; traffic crash severity prediction using synthesized crash description narratives and large language models (LLMs); non-destructive testing (NDT) methods for bridge deck forensic assessment; and traffic signal detection and recognition using computer vision and roadside cameras. After each presentation, webinar participants had an opportunity to ask questions to the presenters.
Presentation #1 – Assessing the Accuracy of LiDAR for Traffic Data Collection in Various Weather Conditions by Abolfazl Afshari, New Jersey Institute of Technology (NJIT)
Mr. Afshari shared insights from a joint research project between NJIT, NJDOT, and the Intelligent Transportation Systems Resource Center (ITSRC), which evaluated the accuracy of LiDAR in adverse weather conditions.
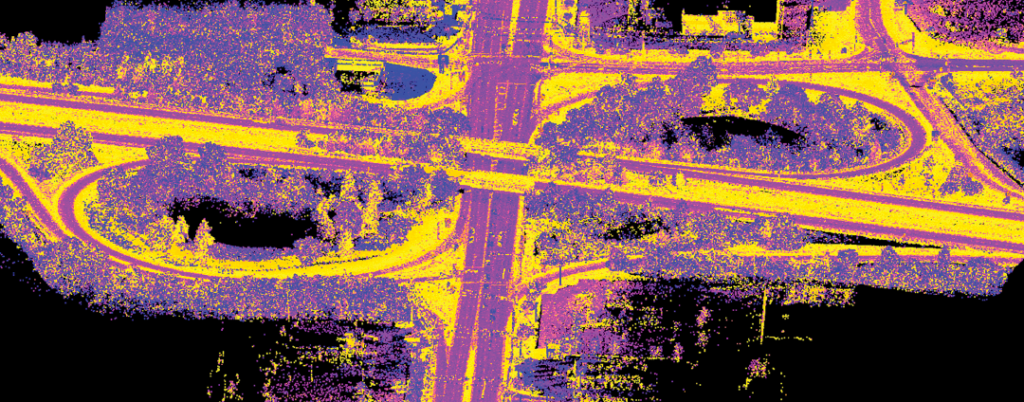
LiDAR (Light Detection and Ranging) is a sensing technology that uses laser pulses to generate detailed 3D maps of the surrounding area by measuring how long it takes for laser pulses to return after hitting an object. It offers high resolution and accurate detection, regardless of lighting, making it ideal for traffic monitoring in real-time.
The research study began in response to growing concerns about LiDAR’s effectiveness in varied weather conditions, such as rain, amid its increasing use in intelligent transportation systems. Mr. Afshari stated that the objective of the research was to evaluate and quantify LiDAR performance across multiple weather scenarios and for different object types—including cars, trucks, pedestrians, and bicycles—in order to identify areas for improvement.
To conduct the research, the team installed a Velodyne Ultra Puck VLP-32C LiDAR sensor with a 360° view on the Warren St intersection near the NJIT campus in Newark. Mr. Afshari noted that newer types of LiDAR sensors with enhanced capabilities may be able to outperform the Velodyne Ultra Puck during adverse weather. They also installed a camera at the intersection to verify the LiDAR results with visual evidence. The research team used data collected from May 12 to May 27, 2024.
The researchers obtained the weather data from Newark Liberty Airport station and utilized the Latin Hypercube Sampling (LHS) method to identify statistically diverse weather periods for evaluation and maintain a balance between clear and rainy days. They selected over 300 minutes of detection for the study.
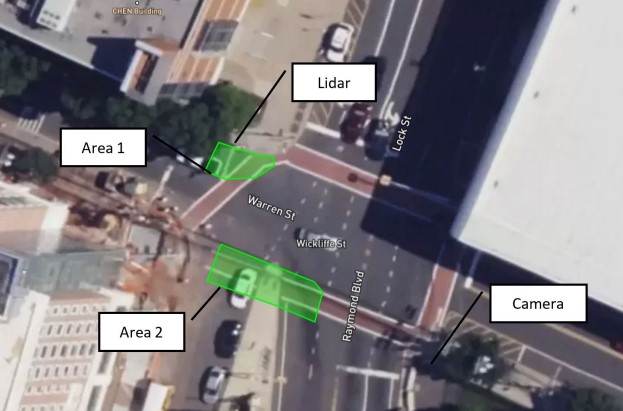
To evaluate how well the detection system performed under different traffic patterns, they divided the study area into two sections. The researchers used an algorithm for the LiDAR to automatically count the vehicles and pedestrians entering these two areas, then validated the LiDAR results by conducting a manual review of the video captured from the camera.
The research team found that, overall, the LiDAR performed well, though there were some deviations during rainy conditions. During rainy days, the LiDAR’s detection rate decreased for both cars and pedestrians, with the greatest challenges occurring in accurately detecting pedestrians. On average, the LiDAR would miss nearly .8 pedestrians and .7 cars per hour during rainy days, around 30 percent higher than on clear days.
Key limitations of the LiDAR detection identified by the researchers include: maintaining consistent detection of pedestrians carrying umbrellas or other large concealing objects, identifying individuals walking in large groups, and missing high-speed vehicles.
Mr. Afshari concluded that LiDAR performs reliably for vehicle detection but pedestrian detection needs enhancement in poor weather conditions, which would require updated calibration or enhancements to the detection algorithm. He also stated the need for future testing of LiDAR on other weather conditions such as fog or snow to further validate the findings.
Q. Do you think the improvements for LiDAR detection will need to be technological enhancements or just algorithmic recalibration?
A. There are newer LiDAR sensors available, which perform better in most situations, but the main component to LiDAR detection is the algorithm used to automatically detect objects. So, the algorithmic calibration is the most important aspect for our purposes.
Q. What are the costs of using the LiDAR detector?
A. I am not fully sure as I was not responsible for purchasing the unit.
Presentation #2 – Traffic Crash Severity Prediction Using Synthesized Crash Description Narratives and Large Language Models (LLM) by Mohammadjavad Bazdar, New Jersey Institute of Technology
Mr. Bazdar presented research from an NJIT and ITSCRC team effort focused on predicting traffic crash severity using crash description narratives synthesized by a Large Language Model (LLM). Predicting crash severity provides opportunities to identify factors that contribute to severe crashes—insights that can support better infrastructure planning, quicker emergency response, and more effective autonomous vehicle (AV) behavior modeling.
Previous studies have relied on traditional methods such as logit models, classification techniques, and machine learning algorithms like Decision Tree and Random Forests. However, Mr. Bazdar notes that these approaches struggle due to limitations in the data. Crash report data often contains numerous inconsistencies and missing values for varying attributes, making it unsuitable for traditional classification models. Even if you get a good result from the model, it cannot be used to reliably identify contributing factors because of all the data that is excluded.
To address this challenge, the research team explored the effectiveness of generating consistent and informative crash descriptions by converting structured parameters into synthetic narratives, then leveraging large language models (LLMs) to analyze and predict crash severity based on these narratives. Since LLMs can parse through different terminologies and missing attributes, it allows researchers to analyze all available data, and not the minority of crash data that has no inconsistencies or missing variables.
The research team used BERT, an Encoder Model LLM, to analyze over 3 million crash records from January 2010 to November 2022 for this study. Although crash reports often contain additional details, the team exclusively utilized information regarding crash time, date, geographic location, and environmental conditions. Additionally, they divided crash severity into three categories: “No Injury,” “Injury,” and “Fatal.”
The narratives synthesized by BERT include six sentences, with each sentence describing different features of the crash, such as time and date, speed and annual average daily traffic (AADT), and weather conditions and infrastructure. BERT then tokenizes and encodes the narrative to generate contextualized representations for crash severity prediction.
They also found that a hybrid approach—using BERT to tokenize crash narratives and generate crash probability scores, followed by a classification model like Random Forest to predict crash severity based on those scores—performed best. An added benefit of the hybrid model is that it produces comparable, if not better, results than the BERT model, in hours rather than days.
In the future, Mr. Bazdar and the research team plan to enhance their model by integrating spatial imagery, incorporating land use and environmental data, and utilizing decoder-based language models, hoping to achieve more effective results.
Q. How does your language model handle missing data fields?
A. The model skips missing information completely. For example, if there is a missing value for the light condition, the narrative will not mention anything about it. In traditional models, a report missing even one variable would have to be discarded. However, with the LLM approach, the report can still be used, as it may contain valuable information despite the missing data.
Q. What percentage of the traffic reports were missing data?
A. The problem is that while a single value like light condition, may be missing in only a small percentage of crash reports, a large portion—nearly half—of crash reports have some missing data or inconsistency.
Presentation #3 – Forensic Investigation of Bridge Backwall Structure Using Ultrasonic and GPR Techniques by Manuel Celaya, PhD, PE, Advance Infrastructure Design, Inc.
Dr. Celaya described his work performing non-destructive testing (NDT) on the backwall structure of a New Jersey bridge, utilizing Ultrasonic Testing (UT) and Ground Penetrating Radar (GPR).
The bridge in the study, located near Exit 21A on I-287, was scheduled for construction; however, NJDOT had limited information about its retaining walls. To address this, NJDOT enlisted Dr. Celaya and his firm, Advanced Infrastructure Design, Inc. (AID), to assess the wall reinforcements—mapping the rebar layout, measuring concrete cover, and detecting potential cracks and voids in the backwalls.
The team used a hand-held GPR system to identify the presence, location, and distribution of reinforcement within the abutment wall. The GPR device collects the data in a vertical and horizontal direction, indicating the distance of reinforcement like rebar and its depth of penetration. This information was needed to ensure that construction on the bridge above would not impact the abutment walls.
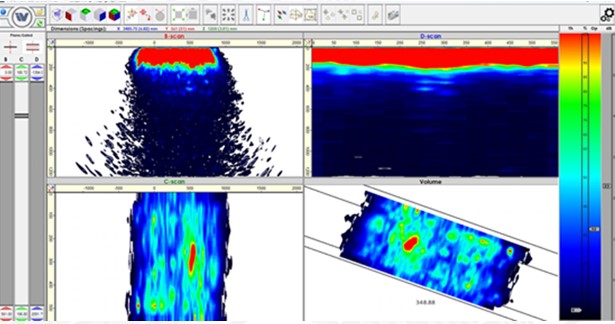
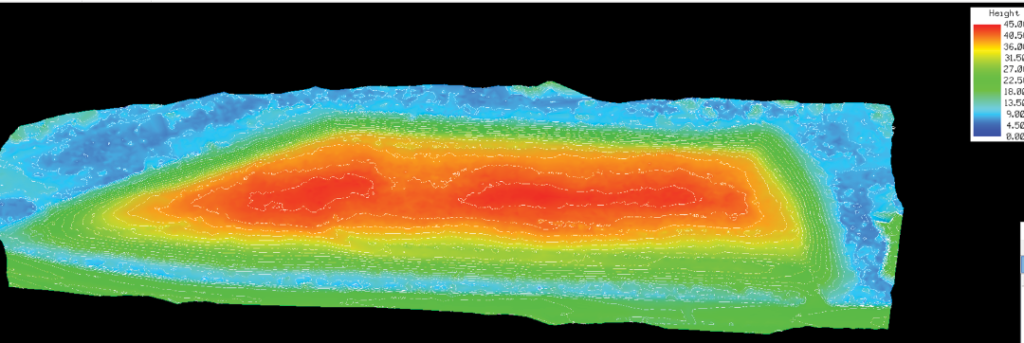
They also employed Ultrasonic Testing (UT), a method that uses multiple sensors to transmit and receive ultrasonic waves, allowing the team to map and reconstruct subsurface elements of the bridge wall. The system captures a detailed cross-sectional view of acoustic interfaces within the concrete using a grid-based measurement pattern, ensuring precise and reliable data collection. Additionally, they used IntroView to evaluate the UT data and produce Synthetic Aperture Focusing Technique (SAFT) images to illustrate and identify anomalies within the concrete.
AID also conducted NDT to assess the depth of embedded bolts in the I-287 bridge abutments using GPR scans, but aside from detecting steel rebar reinforcements, no clear signs of the bolts were found. However, the UT results offered valuable insights, revealing that the embedded bolts in the west abutment wall were deeper than those in the east abutment.
Q. What was the process workflow like for the Ultrasonic Testing?
A. It is not that intuitive compared to Ground Penetrating Radar. With GPR, you can clearly identify structures on the site. However, with UT, there has to be post-processing analysis in the office, it cannot be attained in the field. This analysis takes time and requires a certain level of expertise.
Presentation #4 – Traffic Signal Phase and Timing Detection from Roadside CCTV Traffic Videos Based on Deep Learning Computer Vision Methods by Bowen Geng, Rutgers Center for Advanced Infrastructure and Transportation
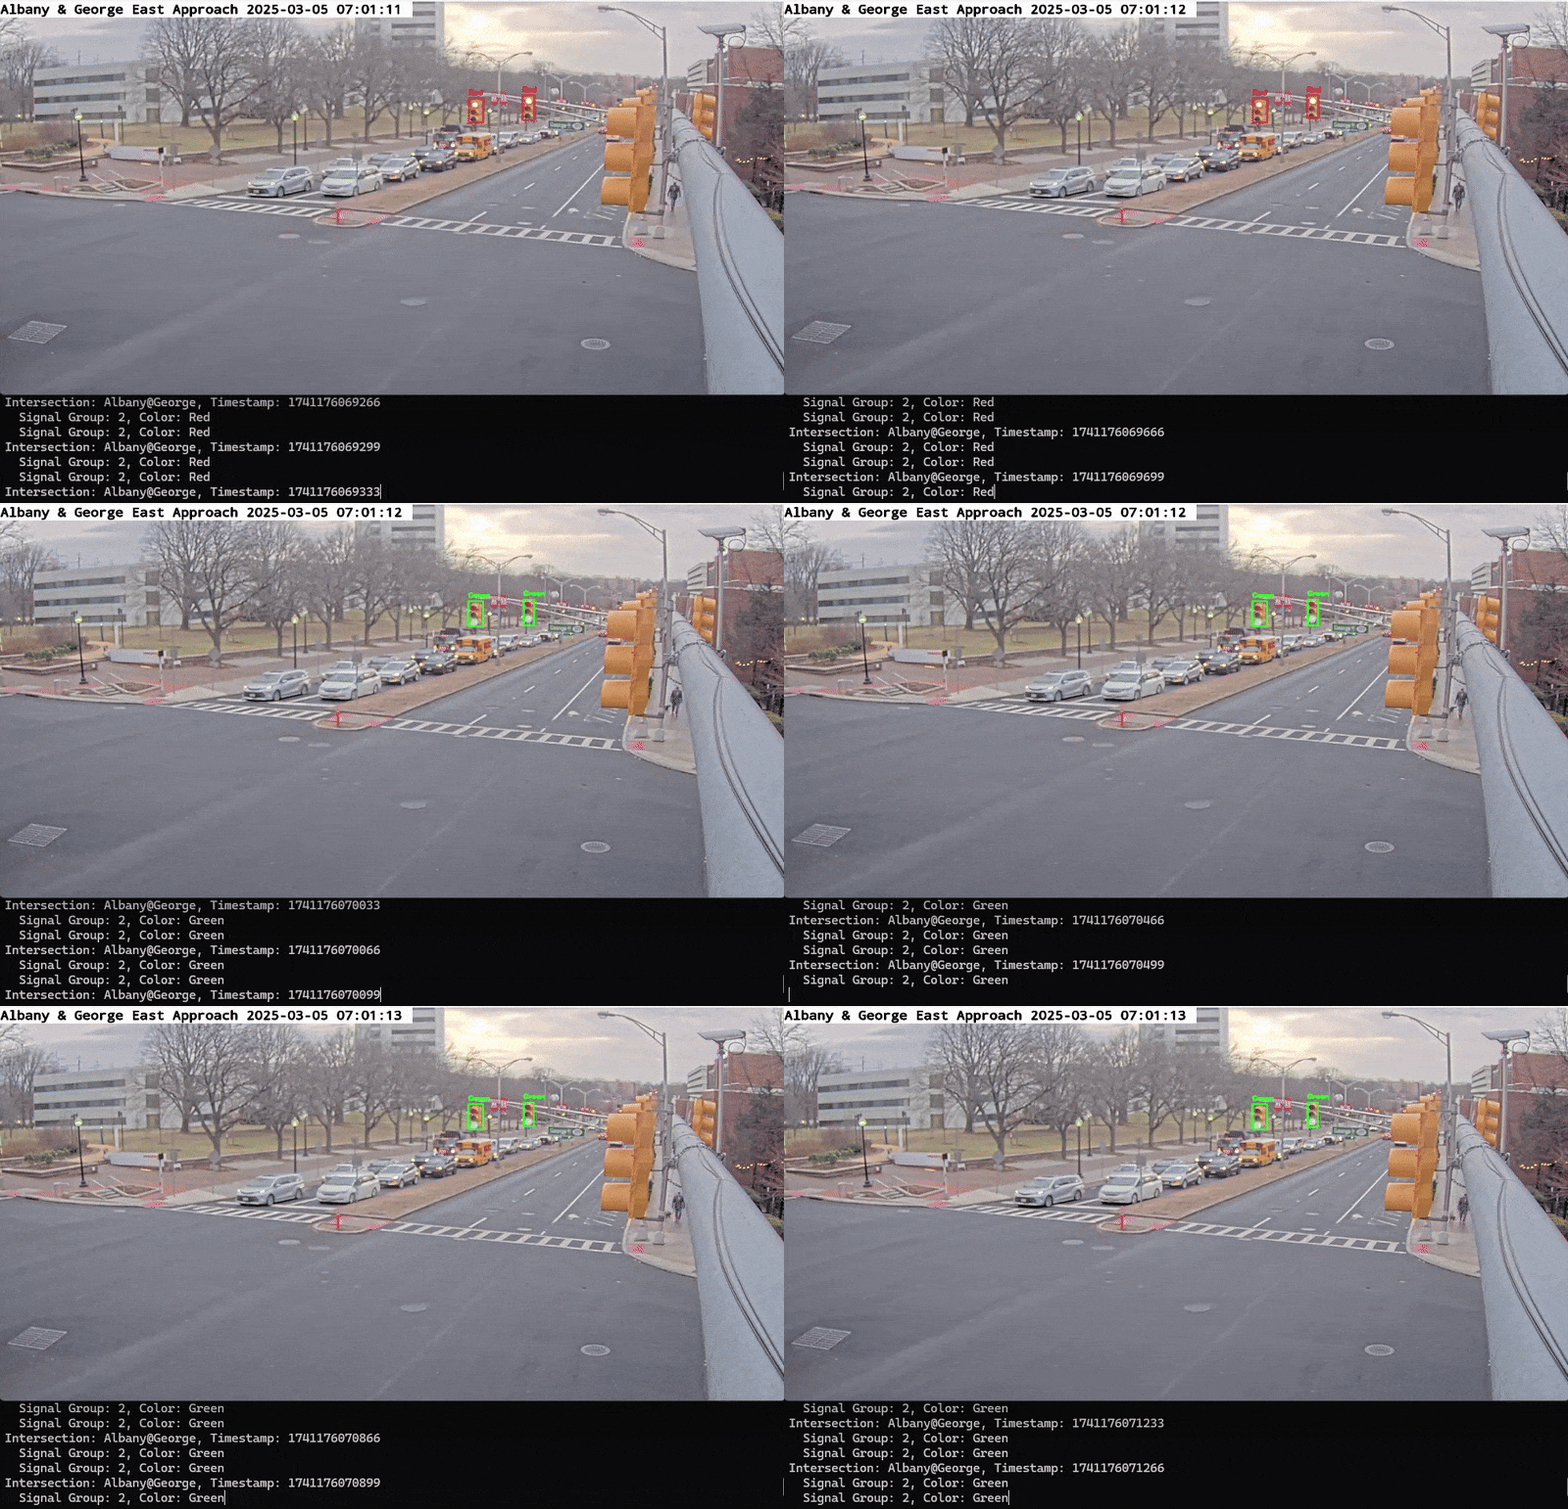
Mr. Geng shared insights from an ongoing Rutgers research project that evaluates traffic signal phase and timing detection using roadside CCTV traffic video footage, applying deep learning and computer vision techniques. Traffic signal information is essential for both road users and traffic management centers. Vehicle-based signal data supports autonomous vehicles and advanced Traffic Sign Recognition (TSR) systems, while roadside-based data aids Automated Traffic Signal Performance Measures (ATSPM) systems, Intelligent Transportation Systems (ITS), and connected vehicle messaging systems.
While autonomous vehicles can perceive traffic signals using on-board camera sensors, roadside detection relies entirely on existing infrastructure such as CCTV traffic footage. Mr. Geng noted that advancements in computer vision modeling provides a resource-efficient tool for improving roadside traffic signal data collection, compared to other potential solutions like infrastructure upgrades, which would be costly. For the study, the researchers decided to develop and implement methodologies for traffic signal recognition using CCTV cameras, and evaluate the effectiveness of different computer vision models.
Most previous studies have concentrated heavily on vehicle-based traffic signal recognition, while roadside-based TSR has received relatively limited attention, with some previous studies using vehicle trajectory to determine traffic signal status. Furthermore, early research relied on traditional image processing techniques such as color segmentation, but more recent studies have shifted toward a two-step pipeline using machine learning tools like You Only Look Once (YOLO) or deep learning-based end-to-end detection methods. Both the two-step pipeline and end-to-end detection approaches have their advantages and drawbacks. The two-step pipeline uses separate models for detection and classification, requiring coordination between stages and creating slower process speeds, but making it easy to debug. In contrast, end-to-end detection is faster and more streamlined but more difficult to debug.
In this study, the researchers adopted three different methodologies; two using the two-step pipeline, and one using an end-to-end detection model. All three models employed YOLOv8 for object detection; however, they differed in color classification methods. The researchers used video data from the DataCity Smart Mobility Testing Ground in downtown New Brunswick, across five signalized intersections.
The model achieved an overall accuracy of 84.7 percent, with certain signal colors detected more accurately than others. Mr. Geng shared that the research team was satisfied with these results. They see potential for the model to be used to support real-time traffic signal data logging and transmission for ATSPM and connected vehicle messaging system applications.
Q. How many cameras did you have at each intersection?
A. For each intersection we had two cameras facing two different directions. For some intersections, we had one camera facing north and another facing south, or one facing east and the other facing west.
Q. What did you attribute to the differences in color recognition?
A. There was some computing resource issue. Since we are trying to implement this in real-time, there are difficulties balancing accuracy with possible latency issues and processing time.
A recording of the webinar is available here.

