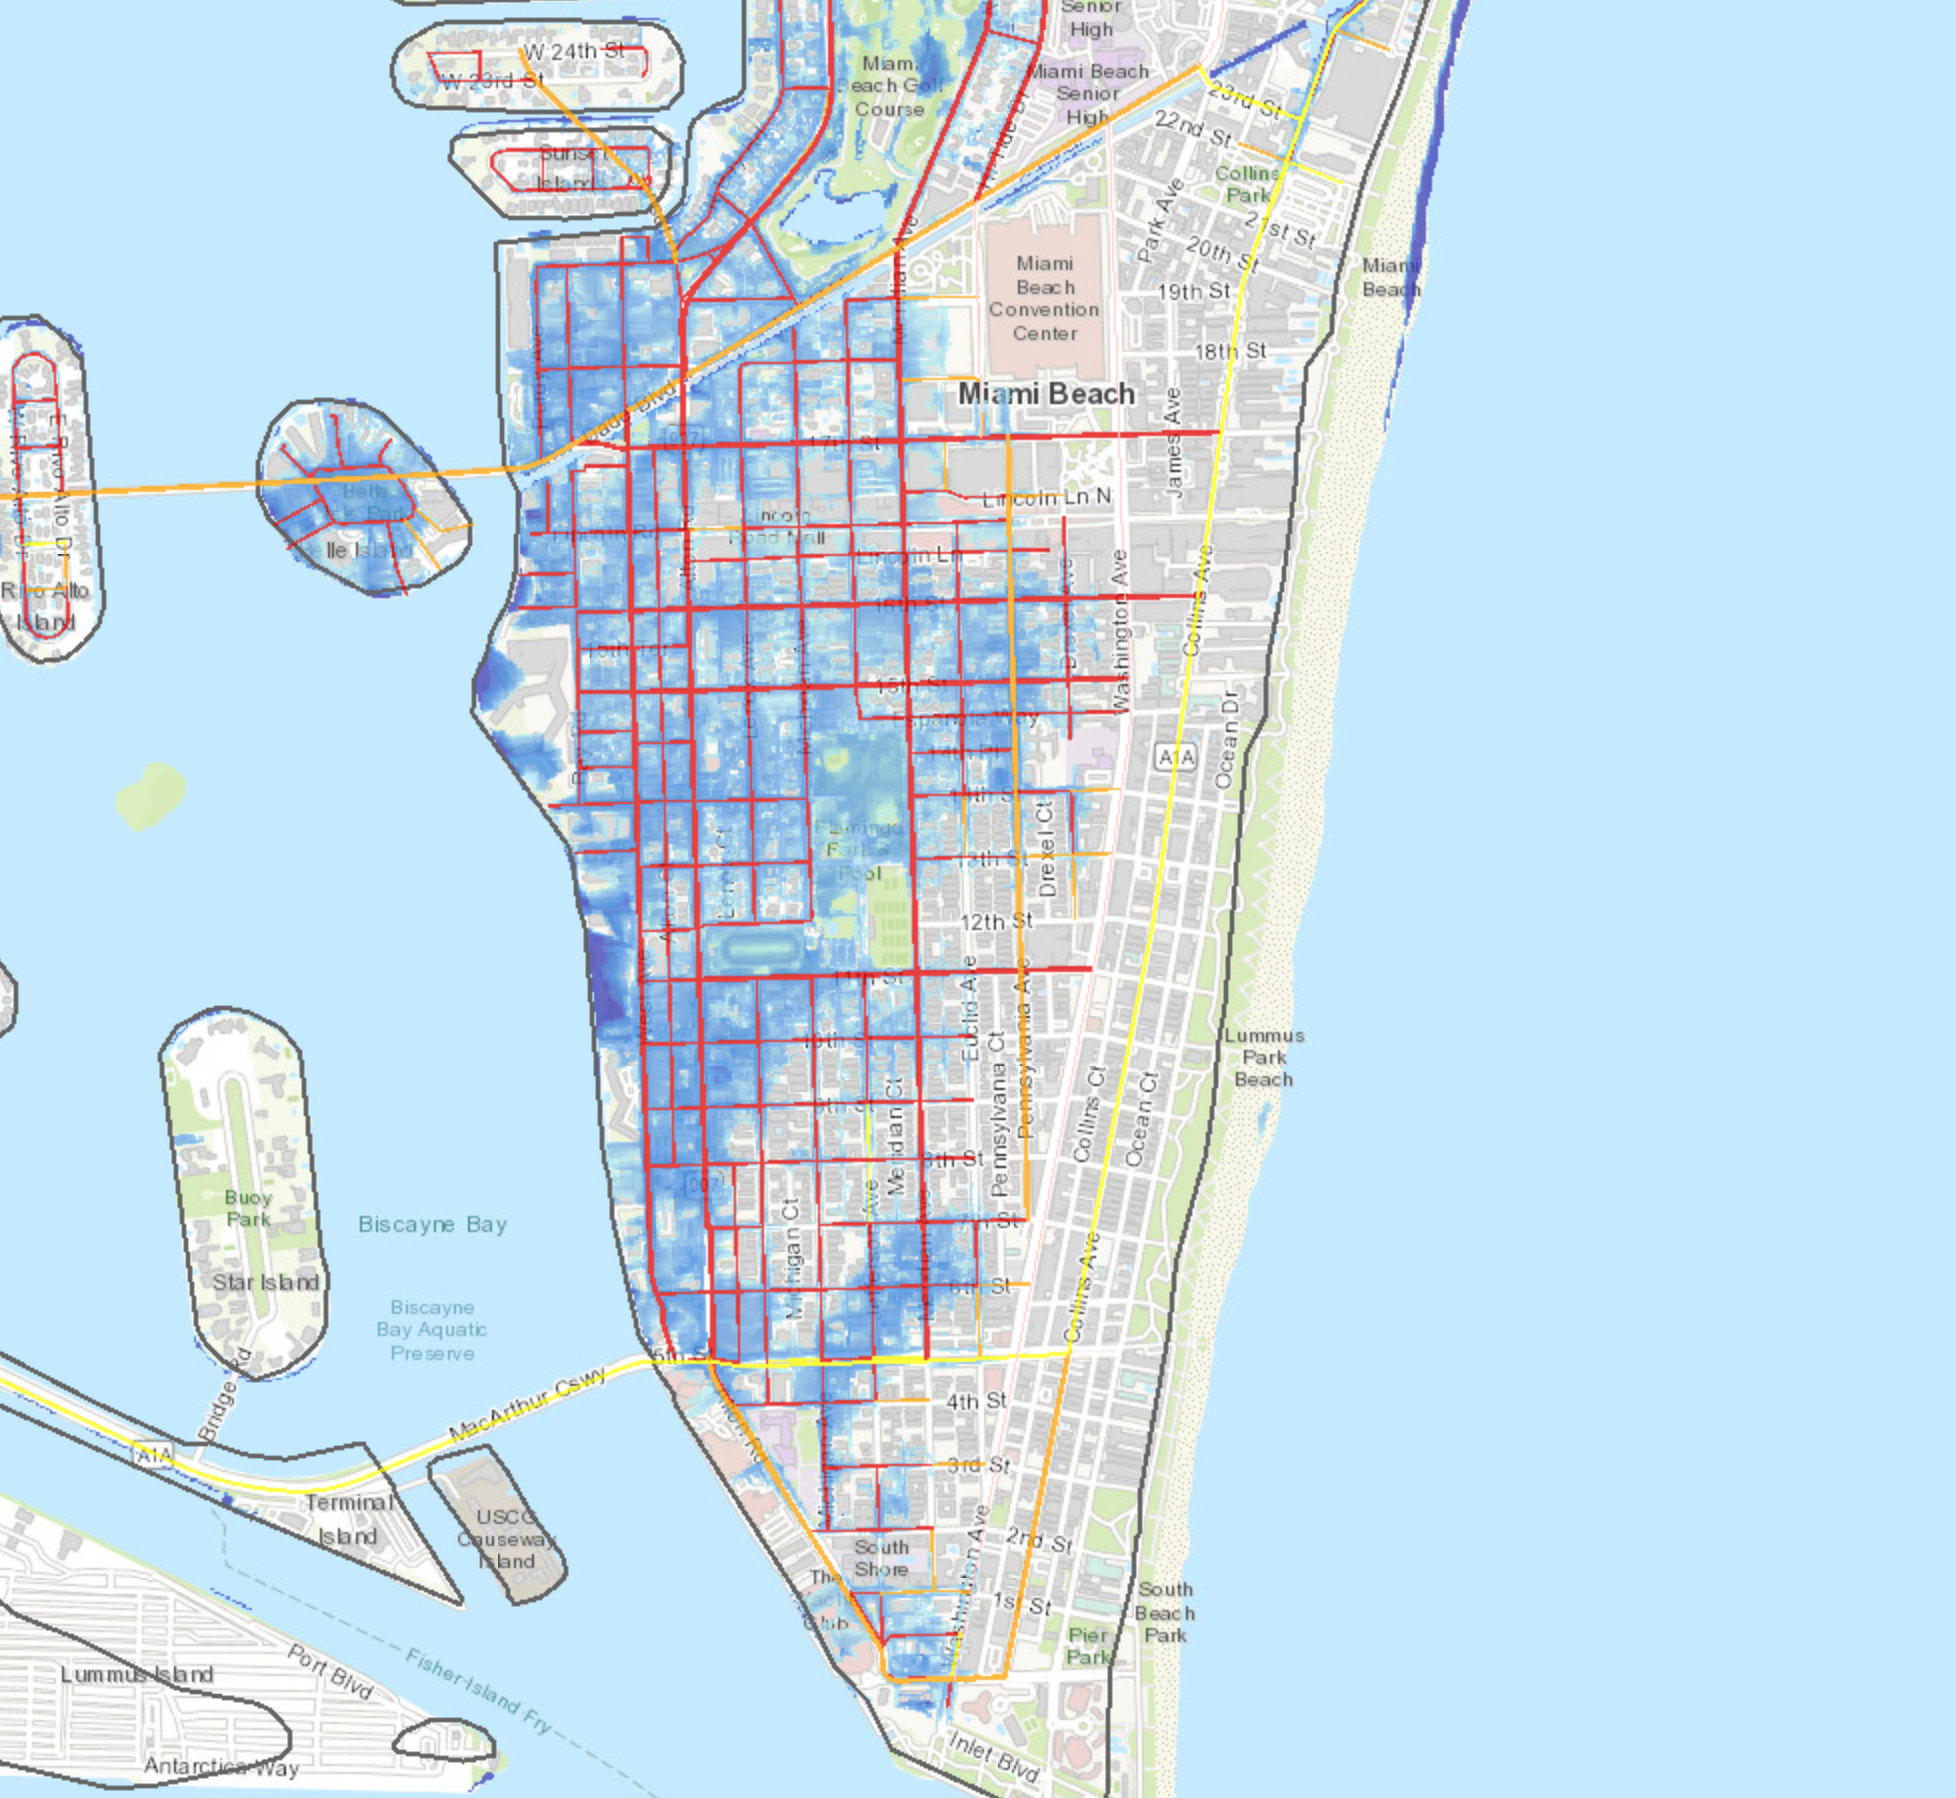
Figure 7. A mapping tool shows sea level rise (SLR) scenarios and affected transportation infrastructure in Miami Beach. Courtesy of University of Florida

Figure 7. A mapping tool shows sea level rise (SLR) scenarios and affected transportation infrastructure in Miami Beach. Courtesy of University of Florida