In prior rounds of the Every Day Counts (EDC) program, the Federal Highway Administration (FHWA) sought to raise awareness and encourage the general education of transportation professionals in the uses of 3D models in all phases of project delivery, including the areas of planning, data collection and management, design, construction, operations and maintenance of highway facilities. EDC-2 emphasized 3D engineered models for design and construction, while EDC-3 promoted the broader use of 3D models and digital data to further advance other application areas.
To find out a little more on what NJDOT has been doing to advance 3D modeling, we conducted an interview with Jim Coyle, a Geodetic Survey SME at NJDOT. He is the supervisor of a relatively new unit, the Bureau of Survey Support that is working to deploy new technologies including the in-house integration of Lidar and software to create surveys from point clouds. The 3D modeling group within Survey Support is staffed with four individuals. Below is an edited summary of our interview and follow-up discussion.
Q. What is meant by 3D Reality Modeling?
Reality modeling is the process of capturing the physical reality of an infrastructure asset, creating a representation of it, and maintaining it through surveys. Reality modeling gathers existing conditions in 3D using one or more devices—for example, cameras on drones, handheld camera, laser scanner, phones—to support mapping, design, construction, inspection and asset management.
At the foundational level, we start by establishing a 3D topographic map of the “existing world.” Other disciplines create their models, often using the 3D topo as a starting point or “designed-on-this-backdrop” model.
It’s handy to keep in mind that there are different definitions, references and standards in the usage of the term “modeling.” It depends on the discipline and who is supposed to make what deliverable or standard file type, but the backbone definition is obvious: an image speaks a thousand words.
Q. What is being done at NJDOT with 3-D reality modeling? What are typical use cases at NJDOT?
NJDOT is ahead of the curve in the use of mass data collection systems to create a visual model of existing conditions that planners can work within. We create this world using Lidar or reality capture through photogrammetry.
Photogrammetry is the process of capturing images of an object from many different angles and using these images to create three dimensional models, indexing and matching common features in each image. It is the science of making measurements from photographs. Lidar, or light detection and ranging, is a process whereby laser scanning produces accurate three-dimensional representations of elevations.
At NJDOT, we have used ContextCapture, a reality modeling software to create a 3D reality mesh. A reality mesh is a 3D model of real-world conditions that contains large amounts of triangles and image data that can be geospatially referenced. We coordinated with our Bureau of Aeronautics to fly a drone with a camera to do the data capture. Basically, the drone flies in a grid pattern taking a large number of overlapping pictures which can be plugged into software to create a 3D reality model. We used it to estimate the amount of dredging material for a project in Cape May as well as for a project at Route 29 and Duck Island (see Figures 1 and 2).

Figure 1. ROUTE 29 & DUCK ISLAND LANDFILL. Requested by Environmental for 2D topographical purposes. The most cost-efficient method to fulfill the original 50+ acre objective was to fly the area with a photographic drone and create a model from the photos (Flown by the NJDOT Aeronautics Unit). Shown above are 2 views of the resulting 3D model.
There are different ways to collect laser scanning data such as through a drone, on a vehicle, or from the side of the road. NJDOT has purchased a static laser scanner that can be placed on the side of the road to collect point cloud data. It works a lot like a typical survey unit with control targets. We have used software, TopoDot, that puts in lines and features that creates the topographic layer and the digital terrain model, or DTM, surface file. We have done multiple projects with our static laser scanner.

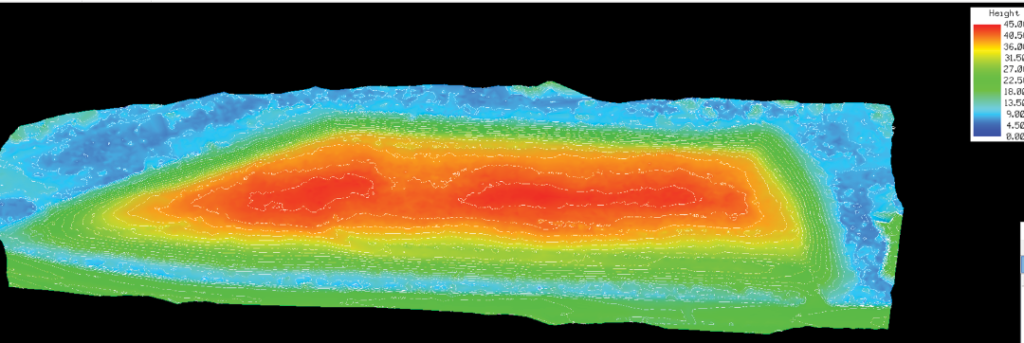
Figure 2. ROUTE 29 & DUCK ISLAND LANDFILL. Shown here is a contoured elevation heatmap. The model that was created is 3D by default, so creating this view is extremely easy to do. The model shows little erosion along the top and steep sides. Inasmuch as the model is both precise and accurately geo-located, future surveyed models of this ecologically sensitive area can easily be compared to this model.
For larger projects, such as for roadway segments of two or three miles, a mobile scanner is needed. At present, NJDOT lacks a mobile scanner so this work has been outsourced to consultants. NJDOT has piloted the mobile scanning process, and we just used it for a bridge replacement project for the Route 55 Bridge over Route 47. The survey resulting from this mobile scanning is being used to support the design phase (see Figures 3 through 6).
The good thing about doing a laser scanner survey is that we get information from the surface all the way up—from signal heads to overhead wires. Normally, you do not deliver that for the survey work, but if the engineer later needs additional information you do not need to go back into the field with supplemental surveys. You can see that this can offer benefits in terms of safety, cost-savings and other efficiencies.
Traditionally, NJDOT did not have staff of photogrammetrists so the agency had to outsource to consultants all of its mapping. Now with this LIDAR technology, NJDOT is able to use the raw point cloud data (still collected by the consultant in the case of mobile scanning) to do the survey mapping in-house which appears to offer cost-savings.

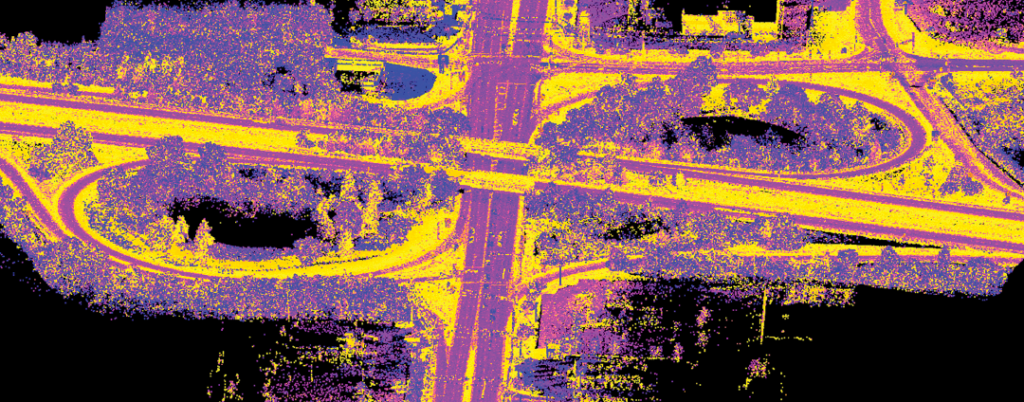
Figure 3. ROUTES 55 & 47 POINT CLOUD MODEL. Routes 55 & 47 were surveyed using a mobile unit which produces an enormous number of accurate and precise points (approximately ¼” inches apart for about 2 miles) for this bridge replacement project.
Q. Who will make use of 3-D Modeling in the future?
Everybody, but for this discussion we will focus on transportation, including planning, construction and maintenance of transportation systems.
3D models of transportation systems will enable planners to get a real world, spatially accurate, view of preexisting roadway features. 3D models are the foundation for 4D simulation models. For example, proposed traffic patterns and sight distances can be simulated visually. It is possible to lay down concept plans within this visual model essentially bringing the real world into your computer.
Designing in 3D is really a new paradigm. The combination of 3D modeling and Global Positioning Systems (GPS) will allow construction crews to use Automated Machine Guidance (AMG) to complete projects faster and with improved quality and safety. GPS-enabled construction equipment can run virtually non-stop with guidance from 3D model data and achieve precise grades on the first pass. GPS rovers can be used to spot check elevations and horizontal offsets. Traditional 2D methods rely on grade stakes and 2D paper plan sheets.

Figure 4. ROUTES 55 & 47 POINT CLOUD MODEL. Switching the “view mode” of a point cloud is just a click. These views show the point cloud in contour mode (0.1 contours) and deviation from a plane mode.
The 3D model can be updated with as-built location data throughout the construction process. After construction, the 3D model becomes the record drawing. The 3D model will have useful benefits as a base map for future maintenance and can be stored in a GIS database for asset management.
Q. How does 3D reality modeling benefit the agency’s various operations?
Having all design elements in 3D improves accuracy and decreases unintended occurrences. Design conflicts become much more apparent.
It is also easier for each discipline to identify how they fit into the project as a whole. This understanding allows for efficient conflict resolution during design and an improved product that should be much easier to construct.

Figure 5. ROUTES 55 & 47 POINT CLOUD MODEL. Low Cost As-Builts. In this view (RGB/real color mode) of the Route 55NB to Route 47 NB Ramp nose, assets such as signs, inlets, junction boxes, guide rail and post, striping, etc. are documented with true mapping grade 3D coordinates. The density of point cloud (approx. 4 to 5 mm apart) can be seen near the inlet/curb in the lower left.
With an engineered 3D model, everyone can see a lifelike representation of what the finished project will look like. These 3D project files can be uploaded anywhere, which means everyone—even those without a technical background—can quickly get up to speed around a project’s concept. The emphasis on 3D-driven design offers new ways of easily communicating information with clients and the public; from 3D KMZ files that can be viewed in Google Earth to full virtual reality (VR) tours of a virtual corridor; the final product has never been easier to visualize.
When a project is presented to the public in 3D, stakeholders quickly have a comprehensive understanding of what is occurring by seeing the depth and details they will ultimately see once the project is constructed.

Figure 6. ROUTES 55 & 47 POINT CLOUD MODEL. Measuring and calculating bridge clearances takes seconds when using a 3D point cloud model, and no one had to step into the road to do it.
Q. What skills, knowledge and abilities are needed to advance the use of 3D reality modeling at NJDOT?
The skills required include an understanding of surveying general principles. There is a need for surveyors and technicians with the ability to interpret and render 3D data including data capture, registering, and creating the point cloud, and familiarity with MicroStation/CADD and TopoDOT software. Folks need to be comfortable working with computers and CADD.
Q. What tools, equipment, or techniques are being used by the agency to advance modeling?
The Bureau of Survey Support is currently working with Static/Mobile Lidar scanners, cameras, drones as well as traditional survey equipment and various software (Bentley/Leica Suite products). As I’ve mentioned, we are exploring how to use these products for projects in-house and in collaboration with our consultants where we may not have the scanning equipment.
The future is in 3D design. NJDOT Design is in the process of upgrading the Bentley CAD suite of software including OpenRoads Designer and OpenBridge Designer. NJDOT should have the tools within six months or a year. Following training, I anticipate that NJDOT will be designing with 3D within two to three years.
Resources
FHWA. (2017). 3D Engineered Models. Retrieved from: https://www.fhwa.dot.gov/construction/3d/

