Research Spotlight: Calibration and Development of Safety Performance Functions for New Jersey

In 2019, a team of researchers from New York University and Rutgers University examined ways to calibrate and develop Safety Performance Functions (SPFs) to be utilized specifically to address conditions on New Jersey roadways. SPFs are crash prediction models or mathematical functions informed by data on road design. These data include, but are not limited to, lane and shoulder widths, the radius of the curves, and the presence of traffic control devices and turn lanes. With these data, SPFs help those tasked with road design and improvement to build roads and implement upgrades that maximize safety.

The Highway Safety Manual (HSM) presents SPFs developed using historic crash data collected from several states over several years at sites of the same facility type. These SPFs data cannot be transferred to other locations because of expected differences in environment and geographic characteristics, crash reporting policies and even local road regulations. To help SPFs better reflect local conditions and observed data, one of two strategies is usually undertaken to fine-tune SPFs:  calibrating the SPFs provided in the HSM so as to fully leverage these data or developing location-specific SPFs regardless of the predictive modeling framework included in the HSM.

The research team, led by Dr. Kaan Ozbay (of NYU’s Tandon School of Engineering), chose to pursue both of these strategies. The research report, Calibration/Development of Safety Performance Functions for New Jersey, can be found here. A webinar highlighting the research and findings can be found here.  A monograph, supported by the NJDOT funded study and partially by C2SMART, a Tier 1 UTC led by NYU and funded by the USDOT, was also recently published and can be found here.

C2SMART Webinar highlighted the research methods, findings, challenges and technology transfer efforts of the NYU-Rutgers team for this NJDOT funded research project.

SPFs can be utilized at several levels. At the network level, researchers and engineers use SPFs to identify locations with promise for improvement. SPFs can be used to predict how safety treatments will affect the likelihood of crashes based on traffic volume and facility type. SPFs can be used to influence project level design by showing the average predicted crash frequency for an existing road design, for alternate designs, and for brand-new roads.

SPFs also can be used to evaluate different engineering treatments. In this case, engineers and researchers return to a site where a safety countermeasure has been installed to collect and analyze data to see how the change has affected crash frequency. They examine before and after conditions and measure if the prediction made using the SPF was accurate or needs improvement (Srinivasan & Bauer, 2013). In the end, SPFs are only as good as the data used in their development.

NJDOT and the NYU-Rutgers team set out to calibrate SPFs using New Jersey’s roadway features, traffic volumes and crash data, and if necessary, to create new SPFs that reflect conditions in the state. The facility types considered for this research project included segments and intersections of rural two-lane two-way, rural multilane, and urban and suburban roads. In examining these datasets, the researchers identified areas where data processing improvements could be made to enhance the quality or efficiency in use of the data in addition to pursuing the stated goal of developing New Jersey-specific SPFs.

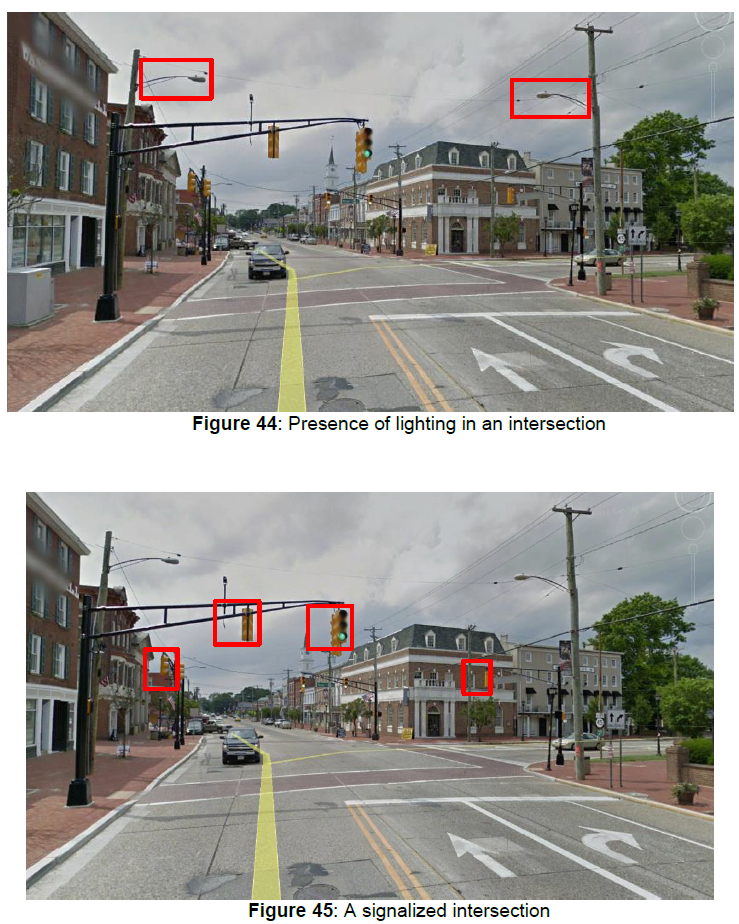
For example, utilizing the data provided by NJDOT, the research team developed methods for processing a Roadway Features Database of different kinds of road facilities. The researchers utilized the Straight Line Diagrams (SLD) database, which offers extensive information about the tens of thousands of miles of roadways in New Jersey, but observed issues and errors in the SLD database that required corrections. For example, the research team utilized Google Maps and Google Street View to conduct a manual data extraction process to verify information in the SLD database (e.g., confirm whether an intersection was an overpass, number of lanes, directionality) and extract missing variables, such as the number of left and right turn lanes at intersections, lighting conditions, and signalization needed for the analysis.

The research team using Google Street View to identify missing data points.

The research team also needed to develop programming code to correctly identify the type and location of intersections and effectively work with available data. The team developed a novel “clustering-based approach” to address the absence of horizontal curvature data using GIS centerline maps.

Utilizing Google Maps (Left) and the state’s Straight Line Database (Right), researchers were able to identify missing paths in the database that contributed to inconsistent data.

Police reports of crashes often have missing geographic identifiers which complicates analytical work such as whether crashes were intersection-related. In NJ, police are equipped with GPS devices to record crash coordinates but this crash information is somewhat low in the raw crash databases before post-processing by NJDOT. The researchers employed corrective methods and drew upon other NJ GIS maps to provide missing locations (e.g., Standard Route Identification or milepost).

The processing challenges for roadway features, traffic volumes and crashes encountered by the research team suggest the types of steps that can be taken to standardize and streamline data collection and processing to secure better inputs for future SPF updates. Novel data extraction methods will be needed to minimize labor time and improve accuracy of data; accurate crash data is integral to employing these methods.

The research team modified the spreadsheets developed by the HSM and used by the NJDOT staff. The calculated calibration factors and the developed SPFs are embedded in these spreadsheets. The users can now select whether to use the HSM SPFs with the calculated calibration factors or the New Jersey-specific SPF in their analyses

The researchers’ data processing and calibration efforts sought to ensure that the predictive models reflect New Jersey road conditions that are not directly reflected in the Highway Safety Manual. The adoption of this data-driven approach can make it possible to capture information about localized conditions but significant expertise is required to carry out calibration and development analyses. With more research—and improved data collection processes over time —the calibration and development of SPFs holds promise for helping New Jersey improve road safety.


Resources

Bartin, B., Ozbay, K., & Xu, C. (2022). Safety Performance Functions for Two-Lane Urban Arterial Segments. Retrieved from https://papers.ssrn.com/sol3/papers.cfm?abstract_id=4175945

C2SMART. (2020, September 23). Webinar: Bekir Bartin, Calibration and Development of Safety Performance Functions for New Jersey . Retrieved from YouTube: https://youtu.be/IRalyvjDaFM

Ozbay, K., Nassif, H., Bartin, B., Xu, C., & Bhattacharyya, A. (2019). Calibration/Development of Safety Performance Functions for New Jersey [Final Report]. New Jersey Department of Transportation Bureau of Research. Retrieved from https://www.njdottechtransfer.net/wp-content/uploads/2020/07/FHWA-NJ-2019-007.pdf

Ozbay, K., Nassif, H., Bartin, B., Xu, C., & Bhattacharyya, A. (2019). Calibration/Development of Safety Performance Functions for New Jersey [Tech Brief]. Rutgers University. Department of Civil & Environmental Engineering; New York University. Tandon School of Engineering. Retrieved from https://www.njdottechtransfer.net/wp-content/uploads/2020/07/FHWA-NJ-2019-007-TB.pdf

Srinivasan, R., & Bauer, K. M. (2013). Safety Performance Function Development Guide: Developing Jurisdiction-Specific SPFs. The University of North Carolina, Highway Safety Research Center. Retrieved from https://rosap.ntl.bts.gov/view/dot/49505

NJDOT Tech Talk! Webinar – Research Showcase: Lunchtime Edition 2022

On April 21, 2022, the NJDOT Bureau of Research hosted a Lunchtime Tech Talk! webinar, “Research Showcase: Lunchtime Edition!”. The event featured three important research studies that NJDOT was not able to include in the NJDOT Research Showcase virtual event held last October. The Showcase serves as an opportunity for the New Jersey transportation community to learn about the broad scope of academic research initiatives underway in New Jersey.

The three research studies focused on evaluation and testing of the performance and durability of materials and pavement for use in transportation infrastructure. After each presentation, webinar participants had an opportunity to pose questions to the presenter.


Evaluating the Potential of Using Foamed Concrete as the Insulation Layer for Pavements in Cold Regions. Cheng Zhu, PhD, PE, Assistant Professor, Rowan University, Center for Research and Education in Advanced Transportation Engineering Systems (CREATES)

In cold-weather areas, water freezes and thaws in the subgrade layer of the soil and causes weak zones in the subgrade that affect surface layer performance. These weaknesses appear as pavement surface distress and cracking. To protect the subgrade, insulating material is used.

Click for PDF

Extruded polystyrene (XPS) boards are commonly used as insulation but face deterioration over time with water infiltration, and installation is time-consuming and labor-intensive. This study looked at the potential for using foamed concrete as an alternative material. The study also looked at the methodology of selecting optimum parameters that balance mechanical strength and insulating effect. When density is low, more air bubbles provide more insulation, but more density gives higher mechanical strength.

Some of the results found through laboratory testing and large-scale testing using a soil box, include: foamed concrete with higher density has a higher compressive strength, thermal conductivity, and a lower porosity; to ensure the subgrade layer remains unfrozen, there is a minimum insulation thickness needed for a foamed concrete layer; increasing the depth of the insulation layer will achieve a better mechanical performance, while also increasing the frozen depth; and using a foamed concrete with a higher density results in a better mechanical performance.

Several questions were posed to Dr. Cheng after his presentation:

Q. What is the estimated design life with foamed concrete?
A. We did not check the timeframe of the pavement structure. We are currently working on lab tests to study the real traffic load on the pavement structure. A simulation could also be used.  This is something that we are currently working on.

Q. Were you able to find an optimal thickness and depth combination in this research?
A. We have some recommendations for the specific material used in this study. We have a design table that we can share for the foam concrete material but was not included in this presentation. We did a comparison among several insulation materials including foamed concrete, tire chips, foamed glass aggregates, and XPS board.

Q. Was the insulation box used to create the sample box replicated in the real life soil scenario?
A. We used XPS board around the sides to minimize heat transfer and to ensure heat transfer process in this test is vertical. In reality, the heat transfer in pavement is in the vertical direction.


Development of High Friction Surface Treatment Pre-screening Protocols and an Alternative Friction Application. Thomas Bennert, PhD, Rutgers University, Center for Advanced Infrastructure and Transportation (CAIT) Associate Research Professor

The use of HFST can improve surface friction in road pavements around curves to reduce lane departure crashes or on steep declines to improve braking. With HFST, hard angular stone is glued to the pavement surface in less than a ½ inch application. The aggregate of choice, calcined bauxite, is applied using epoxy. HFST must be applied to pavements in “good” or better condition (i.e. with no cracking or rutting).

Click for PDF

There can be situations where pavement appears to be in good condition, but is not a good candidate for HFST. In 2018, in studies on two county roads, overlays showed signs of premature deterioration, probably due to previously undetected issues. It was determined that a prescreening protocol was needed to determine substrate conditions before HFST is applied. The study developed an effective prescreening tool that assesses the compatibility of asphalt and epoxy. Field core samples would be used to evaluate pull-off strength and relative asphalt binder properties.

The study also explored High Friction Chip Seal as an alternative to HFST. In a case study, an asphalt-based binding system was shown to be more compatible with the pavement than epoxy resin. Aggregate from local sources proved to be an acceptable substitute and less expensive than bauxite.

Following the presentation, Dr. Bennert responded to questions asked through the chat feature:

Q. What is the life expectancy of HFST? Is it suitable for places with higher traffic volumes?
A. If a road carries high traffic volumes, it is probably designed without horizontal curves and steep declines that might require quick braking. Some areas in Pennsylvania and lower volume highways have used this application. Pavement life expectancy is debatable but generally depends more on the level of traffic volume than years in place. At around a million passes, pavement starts to show raveling, in part due to the effects of UV on epoxy, but aggregate also debonds. Applications can lose friction quickly, an aspect that we are concerned with for its safety implications as well.

Q. Is there any difference in the noise with HFST?
A. In applications using aggregates that point upwards, there is a slight increase in noise at the tire-pavement interface, similar to noise resulting from other microsurface applications in place around the state.

Q. Anything similar to high friction chip seal in use elsewhere in the country?
A. No. We were one of the first to consider this particular application. We worked with the asphalt binder supplier and did some laboratory work and looked at durability. Chip seals have been used in other areas of the country in areas where friction is an issue, but chip seals have not been specifically designed as a friction treatment as this one is.


Influence of Cracking and Brine Concentration on Corrosion and Chloride Content. Aaron Strand is a Ph.D. Candidate in the John A. Reif, Jr. Department of Civil & Environmental Engineering at New Jersey Institute of Technology and recently defended his Ph.D. Dissertation successfully.

Throughout the U.S., agencies are using increasing amounts of salt and brine to counter road icing. Corrosion is an expensive problem for highway bridges. In reinforced concrete bridges, the primary cause of deterioration is chloride-induced corrosion. The focus of this study was the effect of surface-applied chlorides through road salting, typically using rock salt or brine. The research showed that the effect varies dependent on the condition of the bridge deck.

Click for PDF

The research explored whether current testing takes into consideration the amount of salt placed on the roads, salt placement cycles, and the current condition of the bridge deck. Chlorides can affect the bridge steel reinforcement through diffusion from the surface, and through cracks in the bridge deck. The variables explored were salt brine concentration and degree of cracking and their effect on the corrosion time of bridge decks. Testing was undertaken in the lab and from core samples from a large-scale bridge deck specimen.

Ongoing work based on this preliminary study includes testing of other concrete mixture designs, testing other rebar types, and developing a model for the amount of chloride content and corrosion current process. Looking at other concrete designs.

Mr. Strand answered several questions following his presentation:

Q. Among the cracked samples, did the higher brine solution show faster corrosion? What was the rate?
A. They all really showed corrosion immediately, at least in the macrocell test, but the rate was not shown. Going back to the total corrosion, six percent showed a quicker rate, but the other three passed the threshold at the half-year mark. There might be a decrease in the time to corrosion as the brine is increased, but it’s maybe not as much as would be expected from such an increase.

Q. Did you introduce temperature as a variable or do you see this as part of a future study?
A. This would be part of a future study. We did look at doing some type of freeze-thaw work on the concrete itself, but not as part of the brine cycling. As part of research into different mixture design, we would look into temperature’s role into the rate of ingress.

Q. How would you like to see your research findings used to inform bridge design, operations or maintenance in the future?
A. The testing we do shows how mixtures might perform together. For actual application-based work, we need to be more careful about the testing of the materials. For example, we know very little about how incorporating changes is in brine concentration might impact corrosion.

A recording of the webinar is available here.

NJDOT Tech Talk! Webinar – What Happens Now? Virtual Public Engagement During and Beyond Covid-19

The New Jersey Department of Transportation Bureau of Research convened a Lunchtime Tech Talk! Webinar on What Happens Now? Virtual Public Involvement During and Beyond COVID-19 on October 6, 2021. Amanda Gendek, Manager of the NJDOT Bureau of Research, welcomed everyone to the event which included presentations by five representatives of public sector transportation agencies who discussed the immediate transition and ongoing adaptation to virtual platforms to engage with the public for transportation plans, projects, and other activities, and the benefits and challenges associated with this shift. Of particular emphasis was outreach to underserved and vulnerable populations.

Facilitators for the Tech Talk, Andrea Lubin and Trish Sanchez, from the Rutgers University-Voorhees Transportation Center, Public Outreach and Engagement Team (POET), opened the session with reference to their work on NCHRP Synthesis 538: Practices for Online Public Involvement, and the next phase of work, NCHRP 08-142 Virtual Public Involvement (VPI) – A Manual for Effective, Equitable, and Efficient Practices for Transportation Agencies. During the pandemic, Rutgers POET has conducted public engagement which transitioned to virtual for the South Jersey Transportation Planning Organization, Somerset County, and Middlesex County’s Destination 2040 projects. Ms. Sanchez noted the need to experiment with different engagement practices to find what works for each community, and the benefits of building partnerships with local organizations to reach a broad audience. She also noted challenges with VPI such as the digital divide, internet access, and staffing. Ms. Lubin discussed a 2020 study conducted for the Kessler Foundation and interviews with social service agencies and community organizations that offered lessons learned when conducting virtual outreach with vulnerable populations. Despite challenges, Ms. Lubin emphasized that VPI has expanded engagement opportunities in many instances to those who had previously been unable to participate in-person due to obstacles including transportation and childcare.

Rickie Clark, Transportation Specialist with FHWA, noted that Virtual Public Involvement (VPI) is one of the innovative initiatives supported in the fifth and sixth rounds of the agency’s Every Day Counts Initiative. He reviewed the legislation and regulations that requires early and continuous public involvement in the transportation planning and project development process. To meet those requirements during the COVID-19 pandemic, FHWA issued VPI Temporary Guidance that will remain in effect until the pandemic has ended. Mr. Clark encouraged the use of a wide array of VPI tools that can be customized to the needs of particular projects and audiences. VPI extends outreach to the public and enables the public to engage with transportation officials efficiently and effectively. For those who have limited access to the internet, he emphasized that transportation agencies must provide alternatives to ensure full, fair, and meaningful participation for all. Mr. Clark noted that New Jersey is using many VPI innovations.

Jamille Robbins, Public Involvement, Community Studies & Visualization Group, Leader, North Carolina DOT, spoke on how his agency has reached underserved communities with VPI. He discussed the importance of pursuing thoughtful marketing to support the success of VPI and other outreach efforts designed to educate and inform the public and other stakeholders in the transportation project development process. He explained that broadening outreach and increasing engagement contributes to transparency and builds trust. He noted that social media is an effective tool for reaching rural, lower-income, Black, Hispanic, and less-educated populations, and that mobile phone friendly communication is essential.  However, agencies should not be solely relying upon VPI. Traditional media, webpages, partner agency and organization networks, newsletters, postcards, door hangers and local access television and radio remain effective tools for reaching traditionally underrepresented groups. Similarly, integrating the use of phones to collect public comments can augment traditional methods for collecting input, such as paper surveys. Mr. Robbins shared experiences with utilizing a variety of VPI tools and platforms including public engagement software such as publicinput.com and the social networking service Nextdoor. He also described pre-recorded project information videos as a highly effective tool for controlling messaging and highlighted the agency’s use of online engagement platforms for live meetings, with the recordings placed on the web, so that constituents can access them and provide feedback at any time. Mr. Robbins also promoted the use of project visualizations, including 3D renderings and interactive animation that can be easily dispersed across online communication channels and improve understanding of proposed projects. While sharing many tools creatively being used by NCDOT, Mr. Robbins balanced his remarks with several takeaways and lessons learned observations about the limitations of VPI for reaching underrepresented communities.

Alison Hastings, Associate Director, Communications, Delaware Valley Regional Plan Commission (DVRPC) spoke about the agency’s use of VPI in the Long Range Plan 2050 Visioning process, and for the Ben Franklin Bridge Eastbound Access project, and the regional MPO’s anticipated integration of VPI for public involvement in the post-pandemic era. When pivoting from in-person public engagement to virtual events, Ms. Hastings listed several themes that required consideration:  accessibility and accommodations, recreating the in-person experience, setting ground rules and ensuring security. She also described her team’s considerations in determining the specific staffing roles needed for their virtual events, such as lead facilitator, technical assistance leader, and comment response facilitator, among other roles. She noted identifying these positions has helped to ensure smoother virtual events.

DVRPC has used many VPI platforms and tools, both old and new, such as videos, targeted social media campaigns, live transcription and captioning in meetings, web maps, and postcard mailings and noted that public participation has increased with their VPI efforts. Ms. Hastings discussed the advantages of meeting platforms that run well on browsers and smart phones and enable participation in underserved communities that lack internet access. In the future, DVRPC’s equity checklist will include using American Community Survey data to understand the demographics of the project area, communicating why the meeting is important, using Google forms to build contact lists, preparing the team for the challenges of online meetings, experimenting with different outreach, and evaluating the VPI process.  She anticipates that hybrid meetings – in person and virtual – will continue and may require additional staff to run efficiently to achieve desired outcomes.

Vanessa Holman, Deputy Chief of Staff and Megan Fackler, Director of Government and Community Relations at NJDOT explained that their Public Information Centers (PICs) and other outreach must be compliant with Title VI requirements. Due to the pandemic, they needed to find ways to bridge the digital divide which is economic, generational, and geographic. NJDOT has combined established methods of engagement with virtual methods, and in particular, collaborated with stakeholders through social media, websites, and digital news sources. They noted that virtual meetings have helped to remove some barriers to participation, such as the need for transportation and childcare. Ms. Holman shared that they have lost some of the interaction typical of an in-person meeting, and noted the different staff demands of online meetings such as prepared scripts. The Department has also expanded communication in other ways, including through 1-2 page project update memos, written in plain language, for public officials. They now tend to over-communicate and continue to use a range of tools. These efforts are resulting in more public participation and comment in general.

Public involvement tools are available to engage underserved and vulnerable populations and expand outreach so every community member can participate in transportation decision making. Click for Andrea Lubin and Trish Sanchez's presentation

Mr. Clark noted that there is no one-size-fits-all public involvement process and promoted the use of an array of public involvement tools to communicate with the public and receive input. Click for Rickie Clark's presentation

North Carolina JDOT uses 3D visualizations and interactive animation, among other tools, to help public involvement participants understand proposed projects and impacts.

North Carolina DOT uses 3D visualizations and interactive animation, among other tools, to help public involvement participants understand proposed projects and impacts. Click for Jamille Robbins' presentation

DVRPC used both old and new methods of communication for the Ben Franklin Bridge Outreach Plan. Click for Alison Hastings' presentation

NJDOT was successful with their two-week, on-line PIC for the Rt. 80 and Rt. 15 Interchange project. They received large volumes of survey responses and discovered key times for public participation that will inform future efforts. Click for Vanessa Holman and Megan Fackler's presentation

At the end of the event, the speakers responded to questions posed by attendees through the platform’s chat feature.

Q. How expensive is NextDoor?

Jamille Robbins: I don’t believe there’s a huge cost associated but I would have to check with our social media coordinator.

Q. What program did North Carolina use to do 3D presentations?

Jamille Robbins: We use 3D Studio Max for a lot of the presentations.

Q. How do you provide for two-way communications and conversations in an online environment that would occur at in-person events?

Alison Hastings: The platforms, such as Zoom, help. The chat box becomes a primary source of input since you can save it. Conversations can happen in breakout rooms with small groups and a facilitator sharing a screen while using Google docs to record notes. Platforms push updates that provide these tools to emulate the in-person experience.

Trish Sanchez: Break-out groups allow people to feel more comfortable speaking openly.

Andrea Lubin: Especially if they are intimidated by large groups.

Q. What are typical costs for publicinput.com?

Jamille Robbins:  North Carolina uses it on all projects and it is cost-effective, but I do not know specific costs.

Q. For NJDOT: Have you received feedback, either positive or negative, on the VPI process or the platforms used and has that encouraged you to change anything in your VPI strategies?

Megan Fackler: Not thus far. We have received questions on the platform, and requests for technical assistance. It is important to provide a phone number for people to reach out prior to a meeting if they are having difficulties accessing the meeting.

Q. For Rickie Clark: If a municipality requested an in-person event, would FHWA provide guidelines for conducting such a meeting?

Rickie Clark: The possibility for in-person meetings would depend on state and municipal guidance for in-person engagement, as well as the guidance of local health officials. During the pandemic, the VPI Temporary Guidance is in effect.

Q. If you could offer one piece of advice for VPI for underserved or vulnerable populations, what would it be?

Andrea Lubin: What I heard from Jamille was the power of radio advertising to target outreach, based on the number of people who are regular radio listeners.

Rickie Clark: From the federal perspective, agencies must have a public involvement plan in place to begin with. Agencies should evaluate the effectiveness of VPI tools. DOTs have become more nimble in modifying their approach. Imagine a time after COVID-19 when a hybrid model can be used and start planning now. It will be a win-win.

Jamille Robbins: Look at the demographics of the area and population characteristics. If there are EJ or LEP communities, reach out to the local planning office or someone familiar with the area. This is the most effective way to get into those communities.

Q. How do you handle data protection in the VPI process?

Alison Hastings: Don’t ask the question if you can’t protect the information you gather. Also, sunset dates determine how long a survey remains open. Set a date for expunging contact information after gathering that information. Use the same process for focus groups.

Jamille Robbins: We are simplifying the demographic information we are requesting. Asking for a name, email, and address may pass a threshold. Keep in mind that information gathered at a public meeting is a matter of public record.

A recording of the webinar is available here.

Research to Implementation: Design and Evaluation of Scour for Bridges Using HEC-18

This Research to Implementation video presents an example of NJDOT-sponsored research and the effect such research has in addressing transportation-related issues within the State.

Bridge scour is the removal of sediment such as sand and gravel from around non-tidal bridge substructures and supports caused by swiftly moving water. This water can scoop out ​scour holes​, compromising the integrity of a structure. Understanding the extent of bridge damage and prioritizing the order of repair is critical to maintaining safe bridges.

With the support of NJDOT's Bureau of Research, researchers developed the NJ-specific Scour Evaluation Model (SEM) to prioritize bridges for repair. The SEM model was determined to be effective and is now approved by FHWA and NJDOT to evaluate scour risk. The project included training of consultants to encourage the expanded use of the SEM model in NJ.

The video promotes the benefits of funded research to increase the safety of the traveling public, reduce costs, and increase efficiency.

NJDOT Tech Talk! Webinar – Research Showcase: Lunchtime Edition

On April 22, 2021, the NJDOT Bureau of Research hosted a Lunchtime Tech Talk! webinar, “Research Showcase: Lunchtime Edition!”. The event featured three important research studies that NJDOT was not able to include in the NJDOT Research Showcase virtual event held last October. The Showcase serves as an opportunity for the New Jersey transportation community to learn about the broad scope of academic research initiatives underway in New Jersey.

The three projects examined various issues in transportation from surface transportation vulnerability to climate change, to the impacts of lighting on work zone safety, to policies that regulate overweight trucks in New Jersey. After each presentation, webinar participants had an opportunity to pose questions of the presenter.

Quantifying Impacts of Disruptive Precipitation to Surface Transportation: A Data-Driven Mitigation Approach. Raif Bucar is a third-year Engineering Management Ph.D. student at Stevens Institute of Technology, currently conducting research on surface transportation vulnerability to flood events. The study adopts a multidisciplinary approach to look at the effects of not only 100 and 500 year floods, but also more frequent events that cause local flooding to assess the impact on mobility and accessibility in Hoboken, NJ. The resulting study explores flooding impacts on the transportation system in terms of mobility and accessibility metrics and can inform the flood mitigation measures and measures to improve resilience.

The study used a traffic simulation model to look at storm magnitude and high and low tide in relation to Vehicle Miles Traveled, Vehicle Hours Traveled, and Trips Completed. Mr. Bucar described analysis of data to predict flood risk and determine areas of higher probability of flooding by year-storm and tide to determine why some areas flood more often than others. The study explored urban characteristics including land cover and topography, elevation, slope, impervious coverage, and drainage system features, and looked at the correlation of these features with flooding.

Mr. Bucar described the application of this information to determine routing information for drivers by applying machine learning to develop a “most valuable path” that adjusts travel time based on each link in the route and diverts drivers in response to changing conditions during flood events. The study findings can also be applied to guide flood resilience transportation planning. Future work will look at other models to validate this study’s assumptions, and will investigate driver behavior during flood events and how drivers respond to new information.

Following the presentation, Mr. Bucar responded to questions asked through the chat feature:

Q. There is not as much research on rainfall-induced flooding. Why not?
A. There may be resistance to using interdisciplinary approaches to exploring this problem. This is an area that needs more research as the disruptive effects of flooding on transportation mobility is increasingly apparent.

Q. How translatable is this approach to other cities or locations?
A. Thus far, we have not applied the framework to other areas, but should be able to apply it to other controlled study areas. A study of larger areas, such as a state, will not show local differences. There is a limit to how much we can scale this model.

Q. How do you plan on factoring in driver behavior and driver knowledge of flood events in future studies?
A. We anticipate using surveys and controlled experiments.

Lighting, Visual Guidance and Age: Importance to Safety in Roadway Work Zones. Dr. John Bullough is the Director of Transportation and Safety Lighting Programs and a Course Instructor in the graduate program in lighting at the Lighting Research Center at Rensselaer Polytechnic Institute.

Work zones are complex visual environments, and particularly so at night when illumination is needed for workers to complete tasks and for drivers to see the work area and understand how to navigate around it. Roadway delineators, and steady and flashing lights used in work zones can cause glare and visual chaos that affect drivers’ ability to see well. These challenges are exacerbated for older drivers due to physical changes in the eye over time.

Dr. Bullough described the Relative Visual Performance (RVP) model used to look at the speed and accuracy of visual processing in relationship to light level, the contrast between an object and the background, the size of an object, and the age of the observer. The research compared the effects of: steady lighting; flashing lights at night and during the day; sign retroreflectivity, color, and lettering; and road delineators on younger and older drivers.

Dr. Bullough noted that, with an aging driving population, the needs of older drivers should be considered to improve road safety around work zones. Study conclusions emphasize that older drivers need higher light levels than younger adults, but warns that higher light levels can create more glare. There is a need for flashing warning light intensity specifications that reflect the needs of drivers of all ages. It was noted that higher reflectivity in sign sheeting can extend legibility distances and so assist older drivers. Dr. Bullough noted that monitoring of light levels is needed throughout their use to keep levels of glare low.

Several questions were posed to Dr. Bullough after his presentation:

Q. Was the information broken down for age groups over 60 years?
A. Optical changes continue to ages 70 and 80. However, there are other potential visual problems among individuals in these age groups – for example, cataracts, macular degeneration, and glaucoma which make generalizations more difficult.

Q. Does the color of light affect glare and visibility?
A. It depends on what we mean by “glare”. Red and blue lights – which we might find on police and flashing lights of highway maintenance trucks – have the same contrast-reducing characteristics regardless of color. However, people tend to be more sensitive to bluer colors; they find them much brighter, more glaring, more annoying and distracting even if they do not affect visibility any more than red or yellow lights of the same intensity. So, depending on what we mean by glare – if it’s that sensation of pain or annoyance – color matters a lot; if it is just visibility than it really comes down to candle-power, or candelas.

Q. What were the overall differences between urban and rural environments?
A. Urban environments tend to be more difficult for all drivers to find key information in the visual clutter. However, the effect is still much harder for older people than young people.

Q. How does eye recovery after glare differ between younger and older people?
A. Eyes in older people take twice as long to recover (3-4 seconds) after exposure to glare than in younger people.

Analysis of Overweight Truck Permit Policy in New Jersey. Dr. Hani Nassif is a professor at Rutgers, The State University of New Jersey, where he has established the Bridge Engineering Program.   Dr. Nassif introduced the study and acknowledged the contribution of the research team that worked on this study and a prior study focused on the impact of freight on pavement and bridge infrastructure.

This research study explored whether New Jersey’s scheduled permit fees for overweight trucks allow NJDOT to recover all or part of the costs of the damage imposed by these vehicles traveling on NJ roads and bridges.

In a previous study, researchers had correlated truck overweight data with damage to bridges and pavements which showed higher rate of deterioration with higher rates of use by overweight trucks. The main question for this study considered whether the permit fees were sufficient to recover the costs incurred on the infrastructure. Then, in light of these findings, what policy recommendations could be made to change permit policies.

Dr. Nassif described various data sources and methods that were used to estimate the costs of damage to roads and bridges caused by overweight vehicles, including six years of data from the NJ Overweight Permit Database, Straight Line Diagrams of the NJ roadway network, GIS and the National Bridge Inventory including bridge location and conditions.

Dr. Nassif also provided an overview of NJ Overweight Permits, explaining the various types, validity, fee schedule and weight rules.  He highlighted the challenges of effectively collecting fees for overweight trucks and use categories for which fees are not adequately collected.   If a truck weighs more than 80,000 lbs., a permit should be obtained. Although, the State issues 100,000 permits each year, 96 percent of overweight trucks are estimated to be running without permits. These are not short hauls; the trip length is, on average, 50 miles.

The study also looked at fee permitting across the country. Each state uses one of three different permit fee structures: a flat fee; an oversize, overweight fee; and a new model which combines oversize, overweight, and mileage. The study included an effort to benchmark New Jersey against other states in terms of its fee structure. NJ is fourth highest in terms of overweight fee structure.  Any revised policy must take into account these higher fees in relation to neighboring states.

Dr. Nassif noted that the study findings can inform discussion of alternative policies on trucking fees.  The State can maintain the same fee schedule, add mileage to the fee calculation, or charge a flat fee. Dr. Nassif noted that it is not the objective of the state to recoup all the damage costs but perhaps to try to have all sectors of the economy pay their share in terms of the damage to the infrastructure. He suggested that, because trucks using more than six axles cause less damage, the use of more axles could be incentivized. Fees in NJ are already high, so an increase may not be feasible. All sectors of the trucking industry should pay their fair share.  There may be greater efficiency and equity in imposing a permit fee structure that collects a greater fee for longer mileage trips.

Dr. Nassif answered several questions following his presentation: 

Q. What would be your recommendation for regulating overweight trucks- to change to a flat fee or a mileage-based fee?
A. A combination of overweight and mileage fees might be most appropriate in NJ for a fair distribution of permit fees. This is similar to neighboring states. The average trip length is 50 miles for a permit. If a truck travels more, the State could add $1 for each additional mile would recoup 80 percent of the damage cost.

Q. Have you considered the cost of compliance in payment of fees for overweight vehicles?
We have been trying to work with the trucking association – we had a couple of workshops with stakeholders from agencies and trucking association – with the overall goal of enhancing the movement of goods. For example, the state could incentivize the use of a larger number of axles by lowering fees for these trucks. Truck weight enforcement is currently inefficient – it’s like chasing “cat and mouse”. Permits are not obtained for most overweight vehicles. Autonomous enforcement using accurate sensors along the road could result in citations and force drivers to get overweight permits. Weigh-in-Motion stations could be used as enforcement stations.

The enforcement needs to be more effective and we need more legislation; this legislation is under consideration in NY. NJ should consider this legislation to generate more revenue, and provide an equal footing for all parts of the trucking industry.

Q. With regional partners working together would we see more compliance?
A. There have been some regional efforts, including the Port Authority of New York and New Jersey calling for harmonizing the permitting process across state lines. New Jersey and New York could take the lead in advancing legislation to create a unified approach from Connecticut to Delaware and Maryland.

A recording of the webinar is available here.

Research to Implementation: Environmental Impacts of Reclaimed Asphalt Pavement

This Research to Implementation video presents an example of NJDOT-sponsored research and the effect such research has in addressing transportation-related issues within the State.

Reclaimed Asphalt Pavement (RAP) is material gathered through the milling and removal of existing pavement surfaces. In New Jersey, reuse of this material is restricted to inclusion in new asphalt pavements. NJDOT's Bureau of Research supported a study that explored the environmental impacts associated with reuse of RAP in unbound applications.

The video summarizes the research and the resulting recommendations that have influenced legislation and helped frame discussions among various stakeholders concerning the beneficial uses of RAP.

Lunchtime Tech Talk! WEBINAR: Analysis of Local Bus Markets

On October 7, 2020, NJDOT hosted a Lunchtime Tech Talk! Webinar on the Analysis of Local Bus Markets with Deva Deka, Ph.D., Assistant Director, Research, at Rutgers – Alan M. Voorhees Transportation Center, and Susan O’Donnell, Senior Director, Business Analysis and Market Research at NJ TRANSIT. Dr. Deka began the presentation with a general description of the NJ TRANSIT system that operates approximately 250 bus routes throughout New Jersey. Bus riders constitute almost 60 percent of all riders using NJ TRANSIT services, including commuter rail and light rail. For many New Jersey residents, those buses are essential for meeting almost all daily travel needs.

Dr. Deka provided a profile of the demographics of bus users, including household income, race, and vehicle ownership

Dr. Deka provided a profile of the demographics of bus users, including household income, race, and vehicle ownership.

For the past five years, the Alan M. Voorhees Transportation Center of Rutgers University has been conducting onboard surveys of bus riders in different parts of New Jersey for projects funded by the NJDOT Bureau of Research and sponsored by NJ TRANSIT. Dr. Deka, the Principal Investigator for these survey studies, presented the bus survey methodology, and key findings. He described the questionnaire design, survey scheduling, training of surveyors, and the process of data collection, and the post-survey process that has involved data cleaning and weighting, and analysis. Over the five years, the project has generated clean data for over 15,000 riders.

Dr. Deka gave an overview profile of bus rider characteristics and trip characteristics found from the survey research. The survey showed that riders are predominantly Hispanic and/or African-American, lower-income, from households with no car or one car, and dependent on the bus system. The data support the essentiality of bus services for zero-car households and inform analyses of the broader impacts of bus services such as decreases in traffic delays and reductions in greenhouse gas emissions.

In the second half of the presentation, Ms. O’Donnell described the use of the survey data by NJ TRANSIT for planning purposes. The data supports travel demand modeling which replicates existing conditions and predicts future conditions to inform roadway projects and transit projects. This information is shared with New Jersey’s three Metropolitan Planning Organizations, the Port Authority of New York and New Jersey, and the New York Metropolitan Transportation Council. Current data is required in transit grant applications, and contributes to studies related to access to transit, corridors, intermodal systems, and transit oriented development.

To fulfill the agency’s obligations under Title VI of the Civil Rights Act of 1964, NJ TRANSIT uses the data to perform an equity analysis to evaluate the effect of fare changes or service changes on low-income populations and minority populations, and to provide data to help in developing a language assistance plan for Limited English Proficiency populations.

In addition, NJ TRANSIT uses the data when working with advertisers that want to target their message efficiently to specific demographic groups.

The agency’s Newark Bus System Redesign Project will use the data collected in fall 2019 to align and modify bus routes and explore service to new areas. This is the first, and largest, of multiple systems to be evaluated to bring the agency’s entire bus system up to date.

In closing, Ms. O’Donnell presented an update on bus use during the pandemic based on surveys given during April and June. The data shows how important the bus system has been to essential workers.

Following the presentation, the Dr. Deka and Ms. O’Donnell responded to questions asked through the chat feature:

Q. What was the number of questions asked on the survey and what incentives were offered?
A. The survey comprised about 30 questions. Incentives helped increase interest in the surveys and respondents had a chance of winning 1 of 5 $100 gift cards.

Q. Did you consider using IPads rather than paper-based intercept surveys?
A. Dr. Deka noted that they did consider them, but use of IPads limits the number of surveys that can be collected at one time. The surveyor has to stay with the individual using the IPad, and cannot approach other riders at the same time, limiting the efficiency of the survey-taker. Dr. Deka also referenced a Mineta Transportation Institute report that compared data quality and costs for different approaches to on-board transit passenger surveys that found efficiencies with the paper-intercept approach for bus users. Ms.O’Donnell noted that this technology might work at a station or on a platform because a number of surveyors can be located in the same place but is difficult to use on a crowded bus. During the pandemic, IPads probably could not be used due to safety concerns with touching and handling equipment.

Q. What are typical variables used to weight the data to the total ridership?
A. The sample is weighted by direction of the bus, time of day, and the run. A trip is from an origin to the destination and all trips combined is a run. They do not weight the sample by demographic variables or geography because they do not have solid information on the total transit user “universe” population related to these variables.

Q. Did you compare rider survey results by types of service area?
A. No. While there are some suburban routes if you segment or categorize by origins, such as Morristown, almost all routes are generally very urban. It would be possible to use the data to compare by counties.

Q. What is the delay imposed by traffic congestion on buses?
A. Traffic impacts have been an issue that has been looked at by traffic engineers at Rutgers – CAIT some years ago. They collected data traffic signal timings at intersections that the bus traveled through and applied VISSIM for simulations. Dr. Deka said that he could connect anyone interested with the detailed technical methods that the researchers used on that traffic impact study, if they’re interested.

The presentation given by Dr. Deka and Ms. O'Donnell can be downloaded here

A recording of the webinar is also available (see right).

Share Your Ideas on the NJ Transportation Research Ideas Portal!

The New Jersey Department of Transportation’s (NJDOT) Bureau of Research invites you to share your ideas on the NJ Transportation Research Ideas Portal.

We are asking NJDOT’s research customers and other transportation stakeholders to propose research ideas for the NJDOT Research Program. Join us in finding workable solutions to problems that affect the safety, accessibility, and mobility of New Jersey’s residents, workers, visitors and businesses.

REGISTER TO PARTICIPATE.  Once you are registered, you may submit ideas at any time.  If you registered last year, you do not need to register again.

HOW DO I SUBMIT AN IDEA?  Only registered participants can log in to submit a new idea or vote on other ideas to show your support. Register at the NJ Transportation Research Ideas website welcome page here:  https://njdottechtransfer.ideascale.com/

NEXT ROUND OF RESEARCH.  Please submit your research ideas no later than December 31, 2020 for the next round of research RFPs. The NJDOT Research Oversight Committee (ROC) will prioritize research ideas after this date, and high priority research needs will be posted for proposals.

Questions about how to register?
Email: ideas@njdottechtransfer.net

For more information about NJDOT Bureau of Research, visit our website: https://www.state.nj.us/transportation/business/research/

Or contact us:  Bureau.Research@dot.nj.gov or (609) 963-2242

Development of Real-Time Traffic Signal Performance Measurement System

Adaptive Signal Control Technology (ASCT) is a smart traffic signal technology that adjusts timing of traffic signals to accommodate changing traffic patterns and reduce congestion. NJDOT recently deployed this technology in select corridors and required a set of metrics to gauge functionality and effectiveness in easing traffic congestion and reliability. However, the monitoring and assessment of the ASCT performance at arterial corridors has been a time-consuming process.

The Automated Traffic Signal Performance Measures system (ATSPMs) developed by Utah DOT is one of the widely-used platforms for traffic signal performance monitoring with a large suite of performance metrics. One limitation of the existing ATSPM platform is its dependency on high-resolution controllers and the need to set up hardware and software at each individual intersection. Upgrading the existing controllers and reconfiguring the hardware and software at each intersection requires significant investment of funding and labor hours.

Recently completed research funded by the New Jersey Department of Transportation’s Bureau of Research mobilized researchers from Rutgers University, The College of New Jersey (TCNJ), and Rowan University to assist in advancing the goal of establishing automated traffic signal performance measures. The goals of the needed research were to develop a prototype Automated Traffic Signal Performance Measures platform for ASCT systems. The main focus was how to take advantage of the centrally-stored signal event and detector data of ASCT systems to generate the ATSPM performance metrics without intersection-level hardware or software deployment.

The study’s primary objectives were to examine: 1) how to utilize existing field data and equipment to establish Signal Performance Measures (SPMs) for real-time monitoring; and 2) identify what additional data and equipment may be employed to generate additional SPMs while automating the real-time traffic signal monitoring process. This research is especially important for New Jersey (NJ) with the deployment of ATSPM and the establishment of NJDOT’s Arterial Management Center (AMC).

Background

At present, NJDOT maintains a traffic signal system comprised of many types of equipment that affect signal performance, including different signal configurations and vehicle detection devices. Older equipment and ineffective detection technologies make real-time traffic signal monitoring quite difficult to implement across the state. With the implementation of more centrally-controlled traffic signal systems and the Department’s Arterial Management Center (the central control for remotely monitoring these signals) coming online, NJDOT needed standards to assure that the signals would operate properly and ease traffic congestion, and that the signals could be monitored remotely in real-time effectively.

ATSPMs are promoted by FHWA (Federal Highway Administration) as an EDC-4 (Every Day Counts 4) initiative. The use of ATSPMs has important foreseeable benefits:

  • Increased Safety. A shift to proactive operations and maintenance practices can improve safety by reducing the traffic congestion that results from poor and outdated signal timing.
  • Targeted Maintenance. ATSPMs provide the actionable information needed to deliver high-quality service to customers, with significant cost savings to agencies.
  • Improved Operations. Active monitoring of signalized intersection performance lets agencies address problems before they become complaints.
  • Improved Traffic Signal Timing and Optimization Policies. Agencies are able to adjust traffic signal timing parameters based on quantitative data without requiring a robust data collection and modeling process.
Research Approach

The research team recognized that the deployment of various adaptive traffic control systems such as InSync and SCATS systems on major NJ corridors and networks improved the capability for building real-time performance measures. The study included: a review of the literature and best practices; several stakeholder meetings; and recommendations and development of performance metrics, system architectures, data management, and strategies for deploying ATSPM systems using existing and planned NJDOT arterial infrastructure and technologies.

Figure 1: An Example real-time performance monitoring on County Road 541 and Irwick Road, Burlington County, NJ

Figure 1. An Example real-time performance monitoring on County Road 541 and Irwick Road, Burlington County, NJ

The researchers first conducted a literature review to identify examples of existing Signal Performance Measurement (SPM) systems to help inform the development of ATSPMs. The researchers described several exemplary initiatives, including the following:

  • In 2013, the Utah Department of Transportation’s (UDOT) SPM Platform was named an American Association of State Highway and Transportation Officials (AASHTO) Innovation Initiative. Deployed across the state, the system allows UDOT to monitor and manage signal operations for all signals maintained by the agency while aiding in more efficient travel flows along corridors.
  • From 2006 to 2013, the Indiana Department of Transportation (INDOT), with Purdue University, established a testbed of signal performance measures. INDOT developed a common platform for collecting real-time signal data, which became the foundation for AASHTO’s Innovation Initiative on Signal Performance Measures. This performance system has now been deployed at more than 3,000 intersections across the country.
  • Researchers at The College of New Jersey have established a signal performance measurements testbed using Burlington County’s centralized traffic signal management system. Traffic signal data collected along County Route 541 has been used to generate real-time performance measures and identify infrastructure improvements that could advance NJDOT’s ability to use real-time SPMs. An example of the existing real-time performance monitoring for Irwick Road and CR541 in Westhampton, NJ in Burlington County is shown in Figure 1.
  • Many state or local agencies including Pennsylvania DOT, Michigan DOT, New Jersey DOT, Lake County (Illinois), and Maricopa County (Arizona), etc., are actively incorporating ATSPMs into their traffic management and operation strategies. Lessons learned from implementation of ATSPMs from different agencies revealed that ATSPMs are critical to ATCS.

The research team organized and facilitated targeted stakeholder meetings. These meetings confirmed that stakeholders were not currently able to perform efficient real-time post-processing of the existing available data.  Through the meetings, the research team was able to scope more deeply into the type of performance measurements that were feasible and what could be done with the collected information.  Stakeholders also conveyed that the total number of operating adaptive signal intersections would more than double in the near-term future, making the need to efficiently process and leverage data from adaptive systems a more pressing concern. The discussions further confirmed that the big question for study was how to best leverage these adaptive systems to evaluate and manage future corridors.

Figure 2. Corridors where NJDOT has deployed ASCT systems; red denotes full operation, yellow denotes under construction, and blue denotes concept development

Figure 2. Corridors where NJDOT has deployed ASCT systems; red denotes full operation, yellow denotes under construction, and blue denotes concept development

The research team sought to better understand the inventory of NJDOT’s existing and planned ASCT systems. In 2019, New Jersey had over 2,500 NJDOT-maintained signals, but only 76 signals were on Adaptive Traffic Signal Systems.  In addition to the existing five corridors and the district in which ASCT systems had been deployed, 3 corridors were under construction and/or in final design and another 11 corridors were in the concept development phase for future ASCT installation at the time of the study (see Figure 2).

The research team visited the state’s Arterial Management Center (AMC) and investigated several signal performance systems – specifically, the Sydney Coordinated Adaptive Traffic System (SCATS), Rhythm Engineering’s InSync, and the Transportation Operations Coordinating Committee’s (TRANSCOM) real-time data feed – to better understand their interfaces, different types of detectors and their availability.

Figure 3. System Operation Data Flow Diagram

Figure 3. System Operation Data Flow Diagram

The research team designed an automated traffic signal performance measurement system (ATSPM) based on existing ATSPM open-source software to develop an economically justifiable ATSPM for arterial traffic management in New Jersey.  The entire system operates as shown in Figure 3. The high-resolution controller belonging to existing infrastructure is connected to an AMC at each signalized intersection. The controller event log file contains signal state data that is sent to an AMC database. The research team’s program automatically retrieves these data logs and translates the unprocessed data into a standard event code. The converted event file is inserted into an ATSPM database and the ATSPM software can generate signal performance metrics and produce visualizations to support performance-based maintenance and operations by traffic engineers.

Key Research and Implementation Activities

The research team successfully created a bench test of the ATSPM system based on data collected from high-resolution data from adaptive signal control systems including 13 SCATS locations on NJ Route 18 and 2 InSync locations on US Route 1. As a result of the testing, the research team successfully assembled a prototype for automated traffic signal performance measures in New Jersey.

1
2
10
3
7
6
4
8
9
5
previous arrow
next arrow
1
2
10
3
7
6
4
8
9
5
previous arrow
next arrow

Key research activities from the project are as follows:

  • Create Inventory of Existing NJDOT Arterial Management System: The team investigated several signal performance systems including InSync, SCATS, and TRANSCOM fusion application interfaces and different types of detectors and their availability. The team also conducted intensive review of state-of-the-art-and-practice of ATSPM system and identified ways of migrating the system to NJ.
  • Identify Performance Metrics and Measurement Methods for NJDOT ATSPM System: The team conducted a comprehensive review of SPMs built into an ATSPM system. The team investigated and customized SPMs that can be generated by NJDOT detector and travel time data.
  • Develop System Architecture and Concept of Operations for NJDOT ATSPM System and Established a Bench Test of ATSPM Located on TCNJ’s Campus: To leverage the existing ATCS system, the team developed a signal event conversion program to translate existing SCATS and InSync history log file to an event code that can be recognized by ATSPM. The detailed metrics are summarized in the figures to the right.
  • Prepare Real-Time Traffic Signal Data Management Guidelines: The research team created data management guidelines and a manual for data processing. The team validated the outputs through a comprehensive process. The team also completed a test to automatically connect to an ATSPM database using a VPN and MSSQL database management system.
  • Develop Deployment Strategies Considering Existing, Planned, and Future Systems/ Conduct Case Studies of System Deployment: The team initiated the pulling of one-month of data into their platform for the ATSPM. Large scale deployment of this system was expected to be conducted as part of Phase II research.

The research team observed that ATSPMs have distinct advantages over traditional traffic signal monitoring and the accompanying management process. The systems help shorten feedback loops with easier data collection and signal performance comparisons to enable before and after timing adjustments.

Future Work

In the first phase of the research project, the research team developed a software toolbox, NJDOT ATSPM 1.0.  The toolbox can convert the event output data from SCATS and InSync ATSC Systems into event data that can be processed by the ATSPM platform. The primary accomplishment was to integrate ATSPMs with existing ATCS from the centralized management console, instead of configuring at each controlled intersection on field. The proposed system bridges the gap between increasingly deployed ATSC and emerging ATSPMs without investment on new controllers. The effect of this research was validated on two selected corridors. NJDOT arterial management operators are able to use the ATSPM platform to generate key performance metrics and conduct system analysis for NJDOT’s ATSC corridors.

While the initial deployment and analysis was successful, it was limited in its scope. Phase II of the research involves the development and deployment of a significantly-enhanced version of the original toolbox, NJDOT ATSPM 2.0, along with a pilot study on the integration of ATSC controllers with Connected Autonomous Vehicle (CAV) technologies.

The research team will work with NJDOT to identify and add new performance metrics to generate additional Signal Performance Measures. The team can incorporate proprietary data from traveler information providers (e.g. INRIX and HERE) to generate other performance metrics such as queue/wait time, degree of saturation, predicted volumes, etc., and incorporate them into the NJDOT ATSPM platform. The team will also conduct pilot testing on the integration of Connected and Automated Vehicle (CAV), Roadside Units (RSU), On Board Unit (OBU) with the existing and planned NJDOT ATSC systems.

This developed ATSPM system from Phase II will bridge the gap between collected traffic data (e.g., signal controller data, detector data, and historical data) and needed performance information for decision-making. Phase II research is underway with an expected completion by November 2021.

Relationship to Strategic Goals

The development of RT-SPMs and the adapting and deployment of ATSPM with existing NJ ATSC systems is aligned with the FHWA EDC (Every Day Counts) Initiative to promote the rapid deployment of proven innovations. NJDOT ATSPM 2.0 will help meet the strategic EDC goal to accelerate the deployment of ATSPMs on existing and planned arterial corridors to reduce crashes, injuries, and fatalities, optimize mobility and enhance the quality of life.

The Phase II research supports the state initiative on advancing policy and testing of CAV technologies in New Jersey. The outcome of the project will be reported to NJDOT which is part of the New Jersey Advanced Autonomous Vehicle Task Force to make recommendations on laws, regulations and guidance to safely integrate advanced autonomous vehicle testing on the State’s highways, streets, and roads.


Resources

McVeigh, Kelly. (2019). Automated Traffic Signal Performance Measures.  Presentation at NJ STIC May 7th, 2019 Meeting.

Jin, P. J., Zhang, T., Brennan Jr, T. M., & Jalayer, M. (2019). Real-Time Signal Performance Measurement (RT-SPM) (No. FHWA NJ-2019-002).  Retrieved at: https://www.njdottechtransfer.net/wp-content/uploads/2020/01/FHWA-NJ-2019-002.pdf

Jin, P. J., Zhang, T., Brennan Jr, T. M., & Jalayer, M. (2019). Real-Time Signal Performance Measurement (RT-SPM) – Technical Brief Retrieved at: https://www.njdottechtransfer.net/wp-content/uploads/2020/01/FHWA-NJ-2019-002-TBrev.pdf

Zhang T., Jin P., Brennan, T., McVeigh, K. and Jalayer, M, Automating the Traffic Signal Performance Measures for Adaptive Traffic Signal Control System. ITS World Congress. 2020.

Lunchtime Tech Talk! WEBINAR: Evaluation of Precast Concrete Pavement Systems and State Specifications

On June 10, 2020, the NJDOT Bureau of Research hosted a Lunchtime Tech Talk! Webinar on "Evaluation of Precast Concrete Pavement Systems and State Specifications.” Dr. Yusuf Mehta, Director of Rowan University’s Center for Research and Education in Advanced Transportation Engineering Systems (CREATEs), introduced the presentation and acknowledged the contributions of individuals and other state DOTs to the research effort.  Dr. Daniel Offenbacker began the presentation with a description of the research study performed for NJDOT to identify, evaluate, and compare precast pavement systems, specifications, and practices currently in use for Precast Concrete Pavement (PCP). The study included an extensive literature review and surveys with Subject Matter Experts from various state DOTs that have experience with precast concrete pavement rehabilitations.

Dr. Offenbacker discussed the benefits and drawbacks of Precast Concrete Pavements.

Rigid pavements play an important role in highway infrastructure, primarily in regions with high traffic density such as New Jersey. NJDOT is continuously exploring innovative pavement rehabilitation strategies, such as Precast Concrete Pavement (PCP), that allow for faster and more durable rehabilitation of rigid pavements. Precast concrete is cast off-site to specifications and installed to match a particular location. Dr Offenbacker noted the benefits of precast concrete systems including quick installation that limits the duration of road closure and requires minimal interaction with drivers. The material is durable and long-lasting. Drawbacks include the high cost, challenges to installation requiring tight specifications, and limited capability among contractors and systems.

The researchers surveyed 17 states and followed up with 8 states that are using PCP systems. Other states shared experiences with systems in use, standards for manufacture and installation, permitting of new systems, and experiences with installation and performance. Eight different state specifications were identified that addressed panel fabrication, bedding and grout stabilization, installation tolerances, and encasement grout.

The research led to the conclusion that installation is critical to PCP performance. Failure is generally due to misalignment or poor leveling. Dr. Offenbacker described a proposed five-step system approval process to be used in New Jersey for acceptance of newly-developed precast pavements. The approval system included materials and slab approval, demonstration of system installation, and proof of performance. Recommendations included use of documented experiences from other states in establishing specifications and exploring development of a generic PCP system for New Jersey.

The research resulted in recommendations for a Precast Concrete Pavement approval process for use in New Jersey

Dr. Offenbacker noted the need for future work to investigate the long-term performance of PCP systems, to prepare a life cycle cost analysis to quantify the economic benefits, to assess the usefulness of intermittent precast systems in light of surrounding pavement deterioration, and to develop a training platform for contractors to insure proper installation.

Following the presentation, participants posed questions via the chat feature. Responding to a question about the use of planar vs. non-planar slabs, Dr. Offenbacker noted that the existing conditions of the roadway would determine which slab would be used to match the existing structure.

A participant asked if there was any criteria for choosing between rapid-set concrete and PCP. Dr. Offenbacker responded that there was no criteria yet for when one would choose one over the other.

A participant asked what Dr. Offenbacker considered the key takeaway from the surveys. He responded that installation was the key consideration. He emphasized the need to understand the economic benefits of PCP, which are starting to outweigh the benefits of other rehab techniques such as rapid-set.

In response to a question about training needed, Dr. Offenbacker noted that training is needed in the specific systems. California requires each contractor to go through a certification process if they want to use precast pavement systems on a regular basis.

A participant asked if deterioration of slabs adjacent to a replacement slab was due to the replacement slab. Dr. Offenbacker replied that the replacement slab would not cause deterioration if installed properly. The roadway may be deteriorating incrementally.

A participant asked if the Federal Highway Administration (FHWA) provided input on QA/QC for underslab grouting and grouting dowel bar slots. Dr. Offenbacker responded that there are thorough specifications for these elements and they are available in the final report.

In response to a question about whether there is a maximum and minimum size for PCPs and how that correlates to performance, Dr. Offenbacker noted that this has not been explored well yet. The typical length is 15 feet.

The presentation given by Dr. Mehta and Dr. Offenbacker can be downloaded here.

For more information about the research study, please access the final report and technical brief here.

For more information about research at Rowan University's CREATES, click here.

A recording of the presentation is also available here (or see right).